
Week 2/52

The purpose of this is to provide a comprehensive overview of the fundamentals of statistics in a manner that can be skimmed over relatively fast. There are many articles already out there, but I?m aiming to make this more condensed!
Data Types
Numerical: data expressed with digits; is measurable. Can either be discrete (finite number of values) or continuous (infinite number of values)
Categorical: qualitative data classified into categories. Can be nominal (no order) or ordinal (ordered data)
Measures of Central Tendency
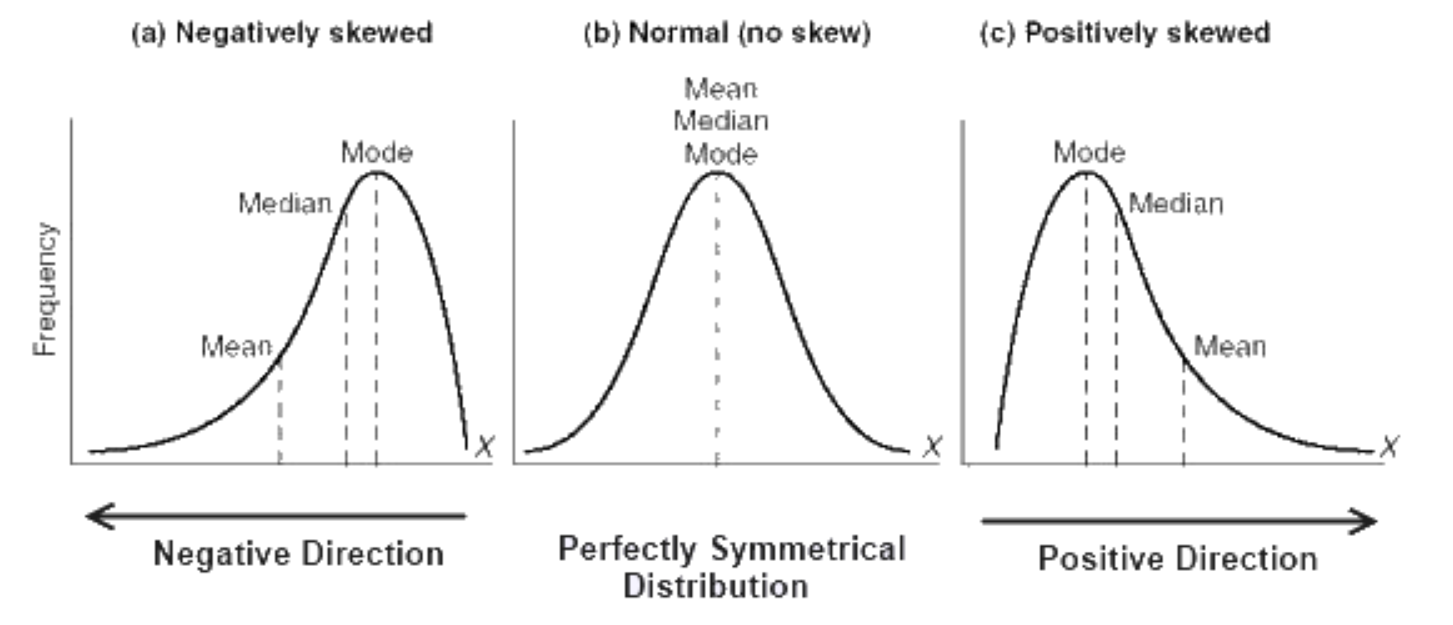
Mean: the average of a dataset
Median: the middle of an ordered dataset; less susceptible to outliers
Mode: the most common value in a dataset; only relevant for discrete data
Measures of Variability
Range: difference between the highest and lowest value in a dataset
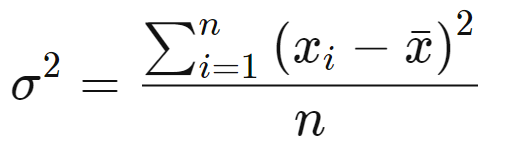
Variance (?2): measures how spread out a set of data is relative to the mean.
Standard Deviation (?): another measurement of how spread out numbers are in a data set; it is the square root of variance.
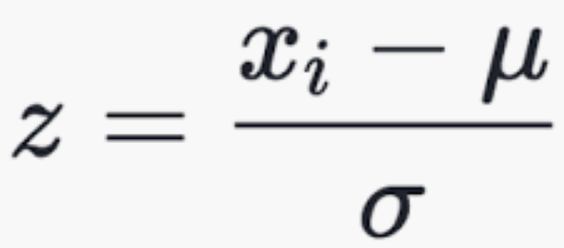
Z-score: determines the number of standard deviations a data point is from the mean
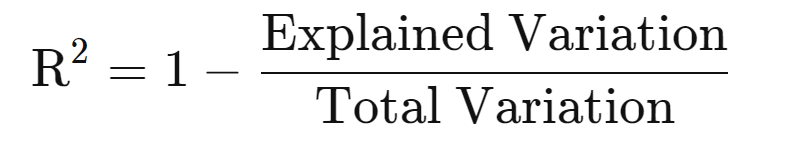
R-Squared: a statistical measure of fit that indicates how much variation of a dependent variable is explained by the independent variable(s); only useful for simple linear regression.
Adjusted R-squared: a modified version of r-squared that has been adjusted for the number of predictors in the model; it increases if the new term improves the model more than would be expected by chance and vice versa.
Measurements of Relationships between Variables
Covariance: Measures the variance between two (or more) variables. If it?s positive then they tend to move in the same direction, if it?s negative then they tend to move in opposite directions, and if they?re zero, they have no relation to each other.
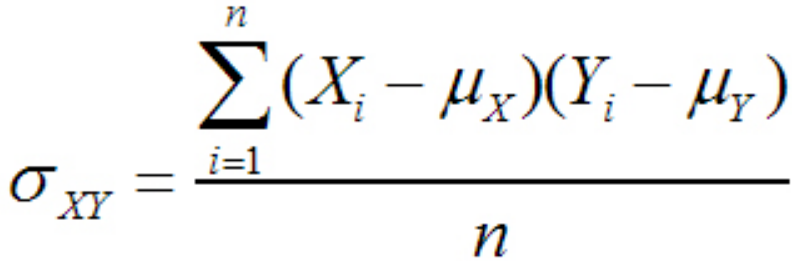 Denominator becomes (n-1) for samples
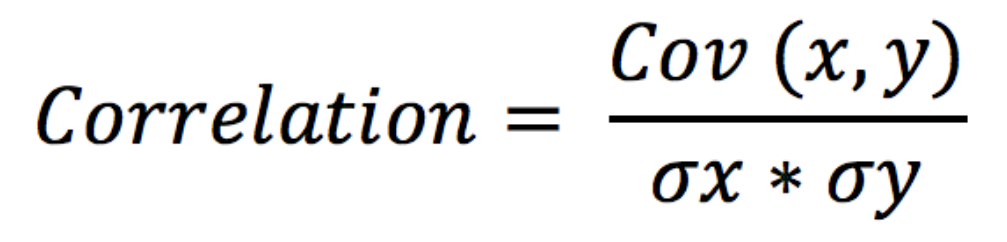
Correlation: Measures the strength of a relationship between two variables and ranges from -1 to 1; the normalized version of covariance. Generally, a correlation of +/- 0.7 represents a strong relationship between two variables. On the flip side, correlations between -0.3 and 0.3 indicate that there is little to no relationship between variables.
Probability Distribution Functions
Probability Density Function (PDF): a function for continuous data where the value at any point can be interpreted as providing a relative likelihood that the value of the random variable would equal that sample. (Wiki)
Probability Mass Function (PMF): a function for discrete data which gives the probability of a given value occurring.
Cumulative Density Function (CDF): a function that tells us the probability that a random variable is less than a certain value; the integral of the PDF.
Continuous Data Distributions
Uniform Distribution: a probability distribution where all outcomes are equally likely.
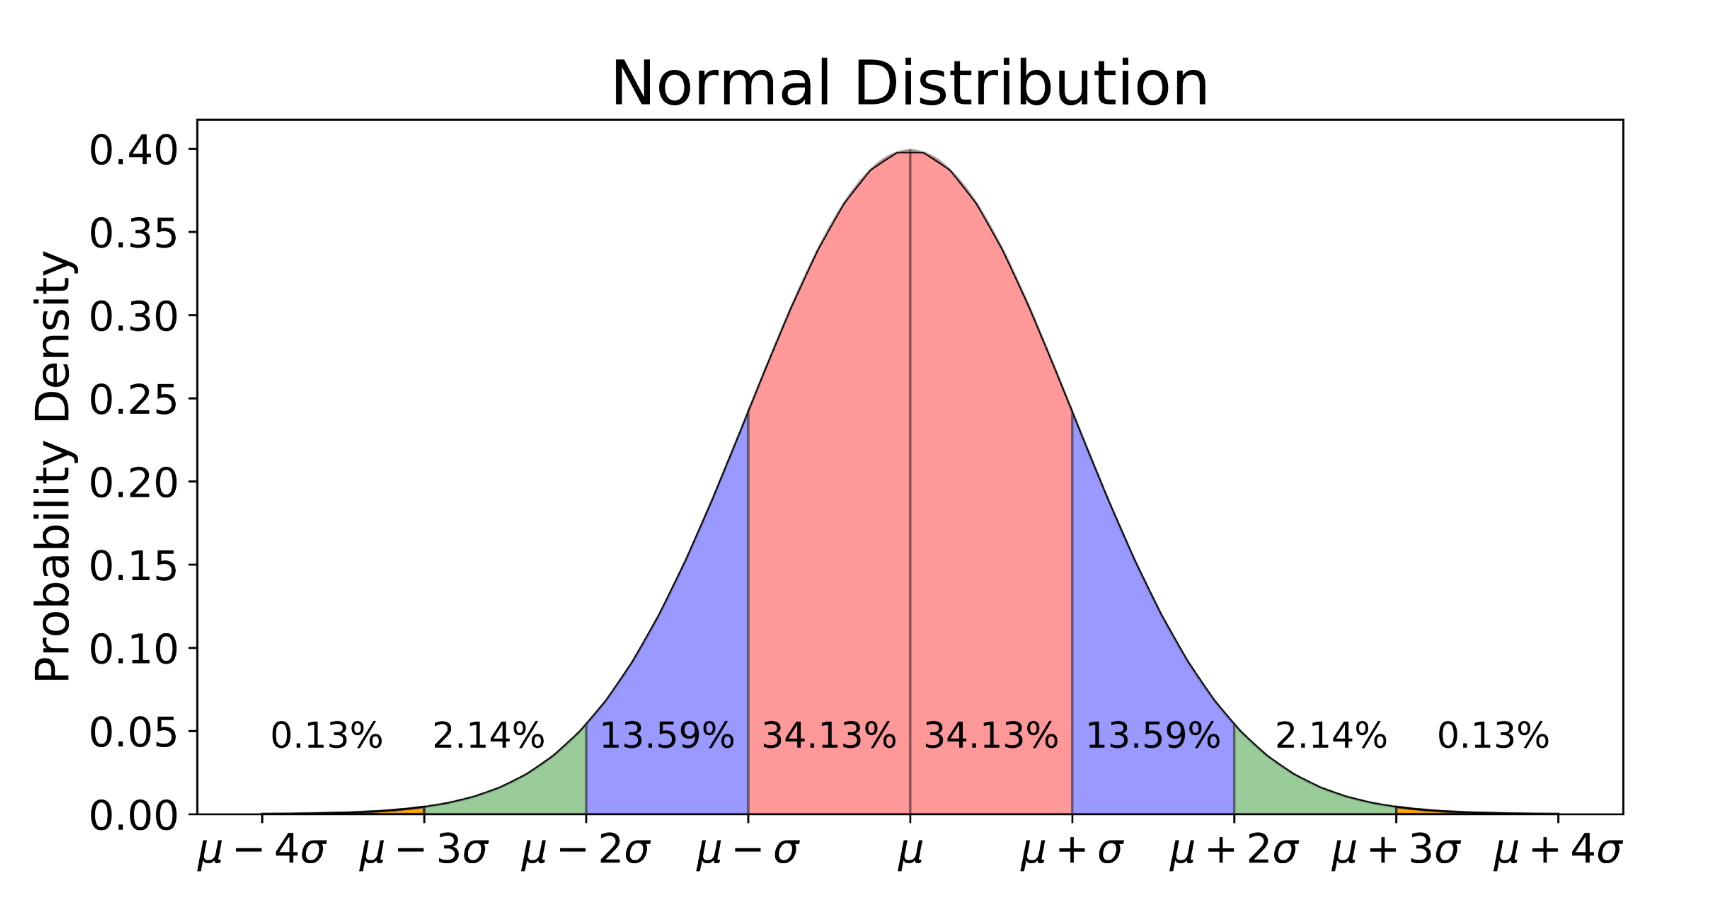
Normal/Gaussian Distribution: commonly referred to as the bell curve and is related to the central limit theorem; has a mean of 0 and a standard deviation of 1.
T-Distribution: a probability distribution used to estimate population parameters when the sample size is small and/r when the population variance is unknown (see more here)
Chi-Square Distribution: distribution of the chi-square statistic (see here)
Discrete Data Distributions
Poisson Distribution: a probability distribution that expresses the probability of a given number of events occurring within a fixed time period.
Binomial Distribution: a probability distribution of the number of successes in a sequence of n independent experiences each with its own Boolean-valued outcome (p, 1-p).
Moments
Moments describe different aspects of the nature and shape of a distribution. The first moment is the mean, the second moment is the variance, the third moment is the skewness, and the fourth moment is the kurtosis.
Probability
Probability is the likelihood of an event occurring.
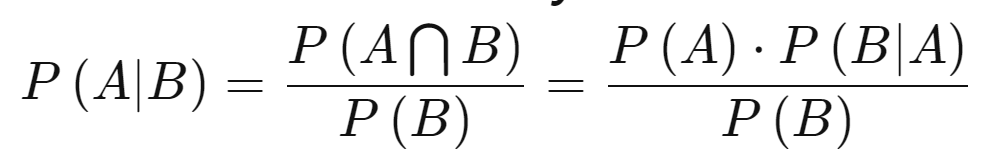
Conditional Probability [P(A|B)] is the likelihood of an event occurring, based on the occurrence of a previous event.
Independent events are events whose outcome does not influence the probability of the outcome of another event; P(A|B) = P(A)
Mutually Exclusive events are events that cannot occur simultaneously; P(A|B) = 0
Bayes? Theorem: a mathematical formula for determining conditional probability. ?The probability of A given B is equal to the probability of B given A times the probability of A over the probability of B?
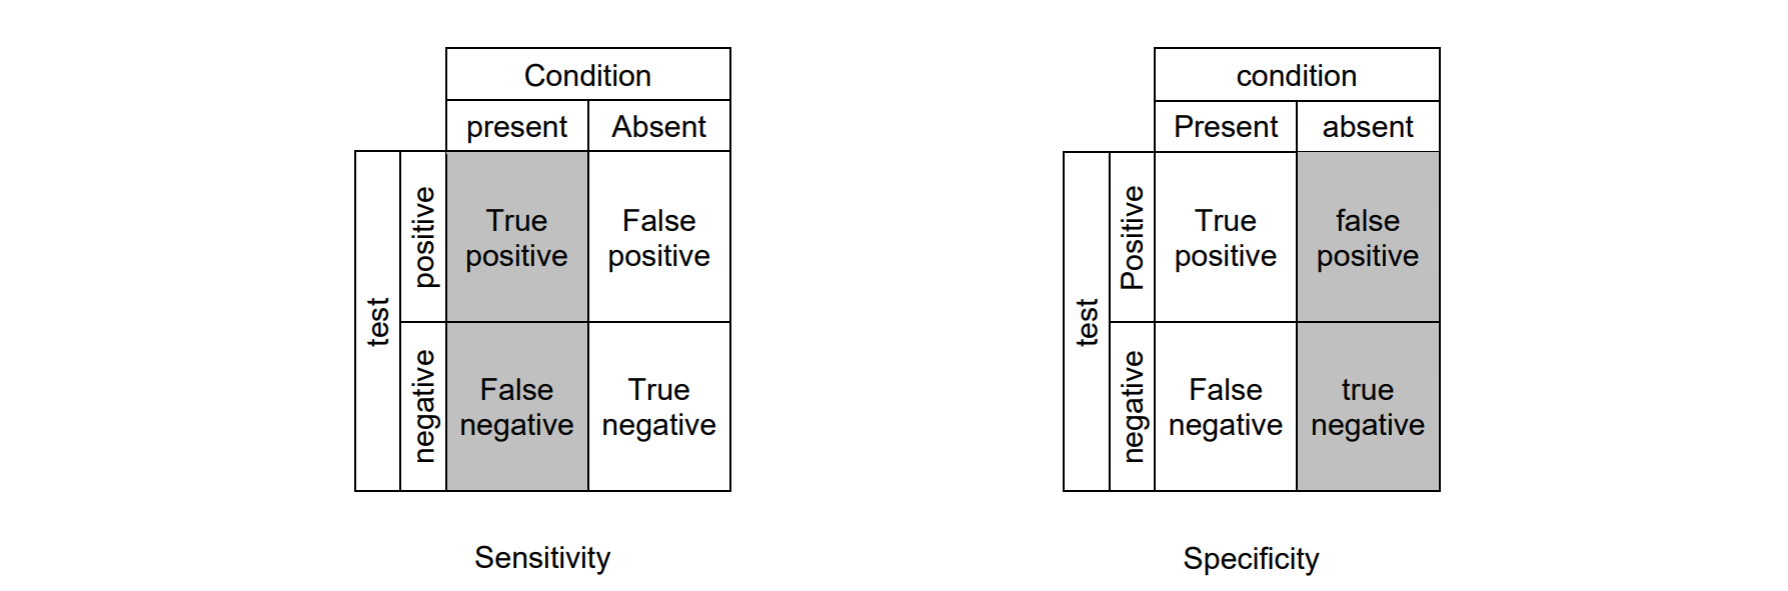
Accuracy
True positive: detects the condition when the condition is present.
True negative: does not detect the condition when the condition is not present.
False-positive: detects the condition when the condition is absent.
False-negative: does not detect the condition when the condition is present.
Sensitivity: also known as recall; measures the ability of a test to detect the condition when the condition is present; sensitivity = TP/(TP+FN)
Specificity: measures the ability of a test to correctly exclude the condition when the condition is absent; specificity = TN/(TN+FP)
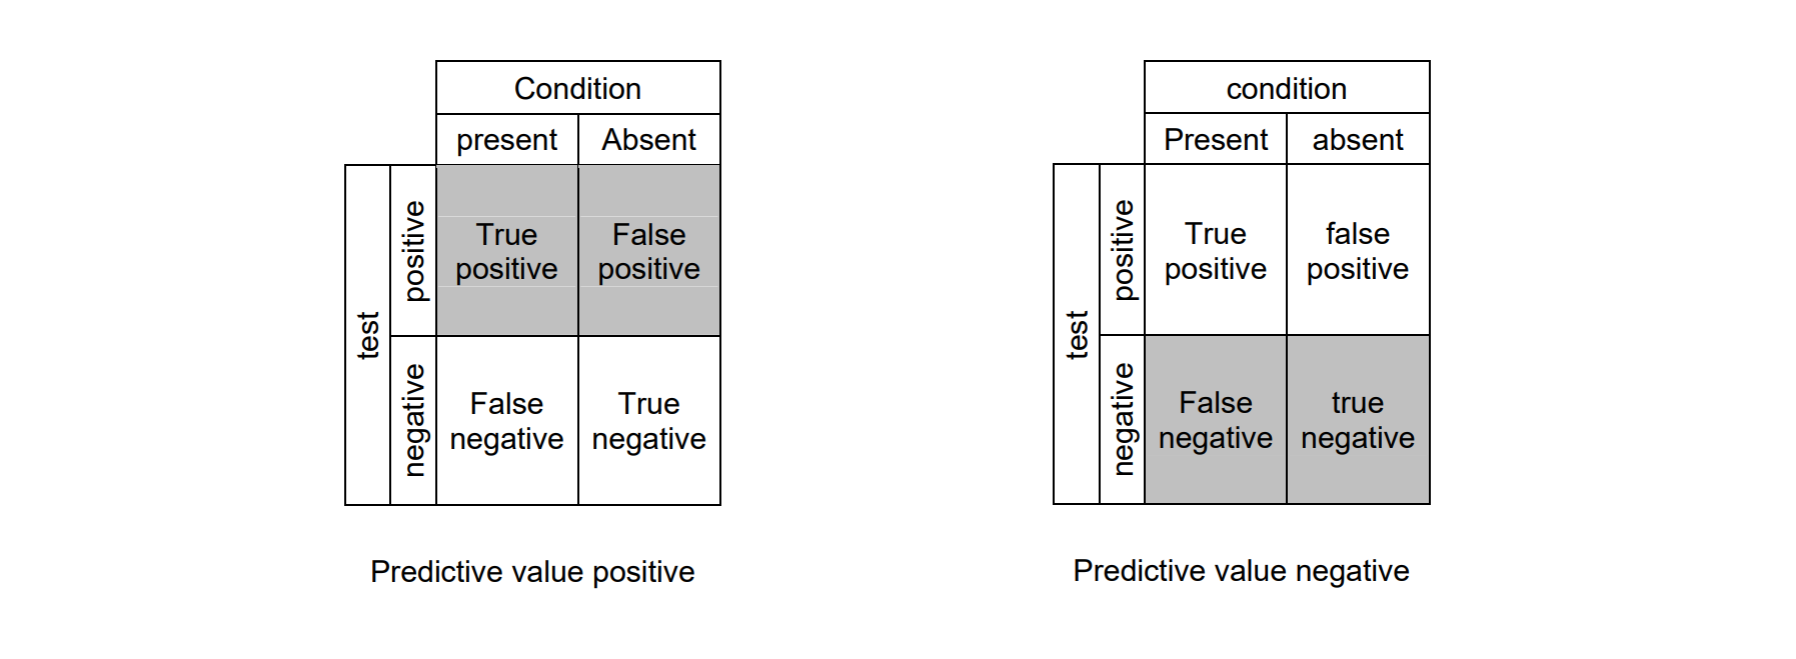
Predictive value positive: also known as precision; the proportion of positives that correspond to the presence of the condition; PVP = TP/(TP+FP)
Predictive value negative: the proportion of negatives that correspond to the absence of the condition; PVN = TN/(TN+FN)
Hypothesis Testing and Statistical Significance
Null Hypothesis: the hypothesis that sample observations result purely from chance.
Alternative Hypothesis: the hypothesis that sample observations are influenced by some non-random cause.
P-value: the probability of obtaining the observed results of a test, assuming that the null hypothesis is correct; a smaller p-value means that there is stronger evidence in favor of the alternative hypothesis.
Alpha: the significance level; the probability of rejecting the null hypothesis when it is true ? also known as Type 1 error
Beta: type 2 error; failing to reject the null hypothesis that is false
Steps to Hypothesis testing:1. State the null and alternative hypothesis2. Determine the test size; is it a one or two-tailed test?3. Compute the test statistic and the probability value4. Analyze the results and either reject or do not reject the null hypothesis (if the p-value is greater than the alpha, do not reject the null!)
?and that?s it! If I find that I missed a lot of important topics later in my journey, I?ll create a second part to this and hyperlink it here. Thanks!

