Whether you?re a social media manager for a big company or a (link karma hungry) regular Redditor, the timing of your Reddit posts is incredibly important. A badly timed submission will flop; a well timed one can go viral. But our intuition about when the best time to post can be faulty, so I coded a solution using Google?s BigQuery and the statistical scripting language R.
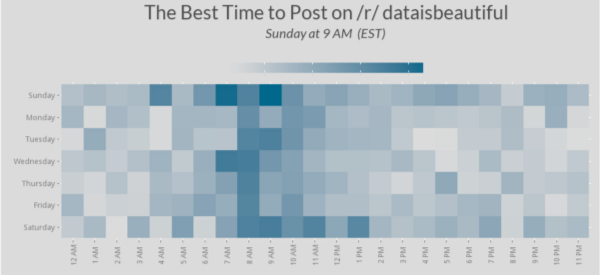
 Heatmap of optimal posting time generated for /r/dataisbeautiful
A few weeks ago this dataset containing Reddit?s full post history from January of 2006 to August of 2015 (about 200 million posts) was posted to /r/BigQuery. The dataset contains information about each post, including its score (upvotes minus downvotes), which subreddit it was posted to, and when it was posted. With this information, you can generate a heatmap (like the one at the top of the post) tailored to your subreddit of choice, which will tell you the absolute best time to post.
Using BigQuery to subset this data is convenient and free. Google provides up to 1TB/month of free data processing, which is more than enough for a project like this. In addition to needing a Google Account, to run the script provided at the bottom of this post you?ll also need to have a recent version of R. Other than that, however, the script is all self-contained, and all the packages called will be installed via the script.
Before handing you the code, however, I?d like you walk you through my decision-making process. The biggest choices I had to make for this project were:
- whether to separate by subreddit or not
- what metric to use to quantify a ?best time to post? and
- which type of plot to use to visualize my results.
To Separate or Not to Separate
This is by no means the first attempt to quantify the best time to post on Reddit. In researching this idea, one of the first solutions I stumbled across was this image. I almost moved on to another idea, thinking that this problem had already been solved. But then I realized that whoever made this graphic made a key mistake: they did not separate the data by subreddit. I had a hunch that the optimal time to post could differ significantly (even between the biggest subreddits) according to the demographics of the subreddit community. It seemed ridiculous to expect (given such factors as differing time zones and waking habits) that the best time to post would be uniform (or even similar) between subreddits, but just to be sure I tested it out. And I was right, as these graphs indicate:
 A comparison of optimal posting times for Reddit as a whole versus three different major subreddits. Although some subreddits have similar distributions to Reddit as a whole, many do not
In fact, the kind of aggregate data relied on in the image I linked to is at best useless and at worst counter-productive.
What is the ?Best Time to Post??
Probably the most important step in answering a question is understanding what the question is. ?What is the best time to post on Reddit?? may seem like a simple enough question to understand, but it actually has a lot of nuance to it. Take, for example, the image I linked to above. The author uses a score of 3,000 as an arbitrary standard, and counts every post that receives a score above 3k equally. These two impacts are incredibly problematic. If I made a post and it got a score of 2,999 I would be incredibly excited, only marginally less so than if I had gotten a score of 3,000. But the metric that the author uses gives equal weight to a score of 2,999 and a score of 0, plus an equal weight to a score of 3,000 and a score for 10,000.
The other part of the metric that I used (which I could not find a single example of anybody else doing) was normalizing my data. And this, I think, is perhaps the most important argument for why if you want to know what the best time to post really is, you should check out the code for this project.
 Randall Munroe ? https://xkcd.com/1138/
Normalizing data is an incredibly simple, but also incredibly important step in making raw data into useful information. As Randall Munroe points out in one of my all time favourite XKCD comics, if you don?t normalize your geographic data with respect to population (in Munroe?s case it should be ?Consumers of Furry Pornography per Capita?), you?ll generally just end up making a population map. Similarly with internet use, if you don?t normalize your data, you generally just end up making something that resembles a chart of peak usage times. Don?t get me wrong, peak usage time data can be incredibly helpful with some things. In this case, however, the data point we should be looking for isn?t the total score of all posts made within that hour, it?s the total score divided by the total number of posts made in that period of time. This ends up making a huge difference, as you can see below:
 A side-by-side comparison of the /r/xkcd heat map for optimal posting time. On the left is the normalized data, on the right is the data which hasn?t been normalized. As we can see, the discrepancy is not insignificant
Bar Chart, Histogram, Line Graph, Oh My
One of the other ?What is the best time to post on Reddit? solutions that I stumbled across is from Adam Bard at Reddit Later. Now, I have to give this guys props: the webapp has a simple UI, clean design, he made the right choice to segregate the data by subreddit, and didn?t do the same ?only count posts over 3,000? silliness as the solution mentioned above. They fail to normalize their data (but so did everybody else), and only analyze at most 500 posts per query, but overall it seems like a pretty reasonable answer to our question. Except for one crucial thing: their choice of chart.
 ?Best Time to Post? for /r/news ? http://www.redditlater.com/analysis/#/r/news
Now, these are not bad looking bar charts, but the problem isn?t aesthetics. The problem is how bad a pair of bar graphs is at transmitting data. I can tell that the best hour to post is around 8AM, and the best day to post is Monday, but that doesn?t necessarily mean that the best time to post is Monday at 8AM. According to Simpson?s paradox, we have no reason to believe that even though 8AM might be the best scoring hour, and Monday may be the best scoring day, that does not indicate to us that when we combine these two datasets it will be the best scoring time. In fact, according to my analysis the best time to post on /r/news is Thursday at 9AM, not Monday at 8AM. Looking at the bar graph?s above though, both 9AM and Thursday looking like pretty mediocre times to post. Perhaps this difference can be chocked up to differing data sets (as Reddit Later only accesses 500 posts in its analysis), but none-the-less, this just goes to show how important careful selection of plot type is.
I elected to use a heat map (along with a text subtitle for clarity) because I felt that it transmitted the maximum amount of information as succinctly as possible, while still looking aesthetically pleasing. The heat map gives the viewer an idea of what the dispersal is (that is, how much better is it to post at one time than another), and conserves space in the process.
What?s the best time to post this article?
At the end of the day, the code (and the comments I inserted in it) should speak for itself. If you have a couple of minutes on your hands and want to find out more about when to post on your favourite subreddit, I definitely recommend setting up a BigQuery project (it takes under a minute), booting up R, and running the script below.
Note: I got a chance to present this project at the useR! 2016 conference at Stanford. Check out a video recording of my talk here.
Also availble at https://github.com/dleybz/BestTimeToPostOnReddit
If you have any questions, bugs, issues, concerns, comments, or other data sets for me to work with, feel free to comment here or shoot me an email at [email protected]. Thanks for reading and have a great day!
