In data science we create regression models to see how well we can predict one variable using one or more other variables. The hope of a regression line is that is that we will be able to predict our dependent variable by plugging in our independent variables into our best-fit line equation. But how do we know that this line is predicting the y values accurately? This is where R-Squared comes into play.
What is R-Squared?
R-Squared, also known as the Coefficient of Determination, is a value between 0 and 1 that measures how well our regression line fits our data. R-Squared can be interpreted as the percent of variance in our dependent variable that can be explained by our model. The closer R-Squared is to 1 or 100% the better our model will be at predicting our dependent variable. This can be a little confusing so to truly understand R-Squared we must look into how it is calculated.
How to Calculate R-Squared
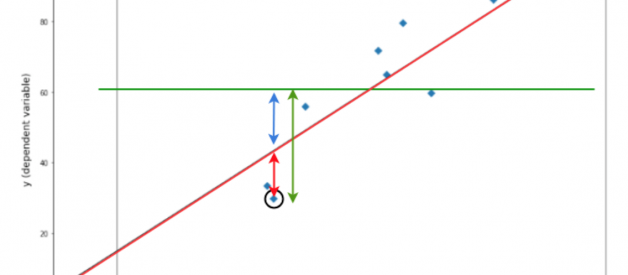
The R-Squared formula compares our fitted regression line to a baseline model. This baseline model is considered the ?worst? model. The baseline model is a flat-line that predicts every value of y will be the mean value of y. R-Squared checks to see if our fitted regression line will predict y better than the mean will.
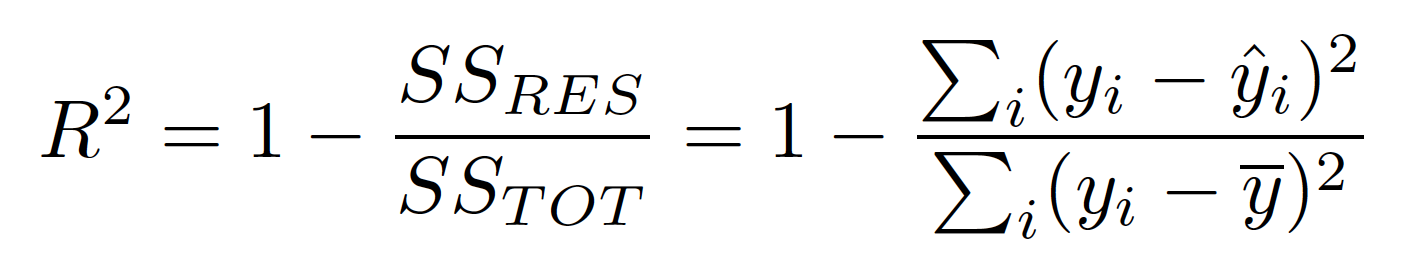
The top of our formula, is the Residual sum of squared errors of our regression model (SSres). So if the actual y value was 5 but we had predicted it would be 6 then the residual squared error would be 1 and we would add that to the rest of the residual squared errors for the model.
The bottom of our formula is the total sum of squared errors (SStot). This is comparing the actual y values to our baseline model the mean. So we square the difference between the all the actual y values and the mean and add them together.
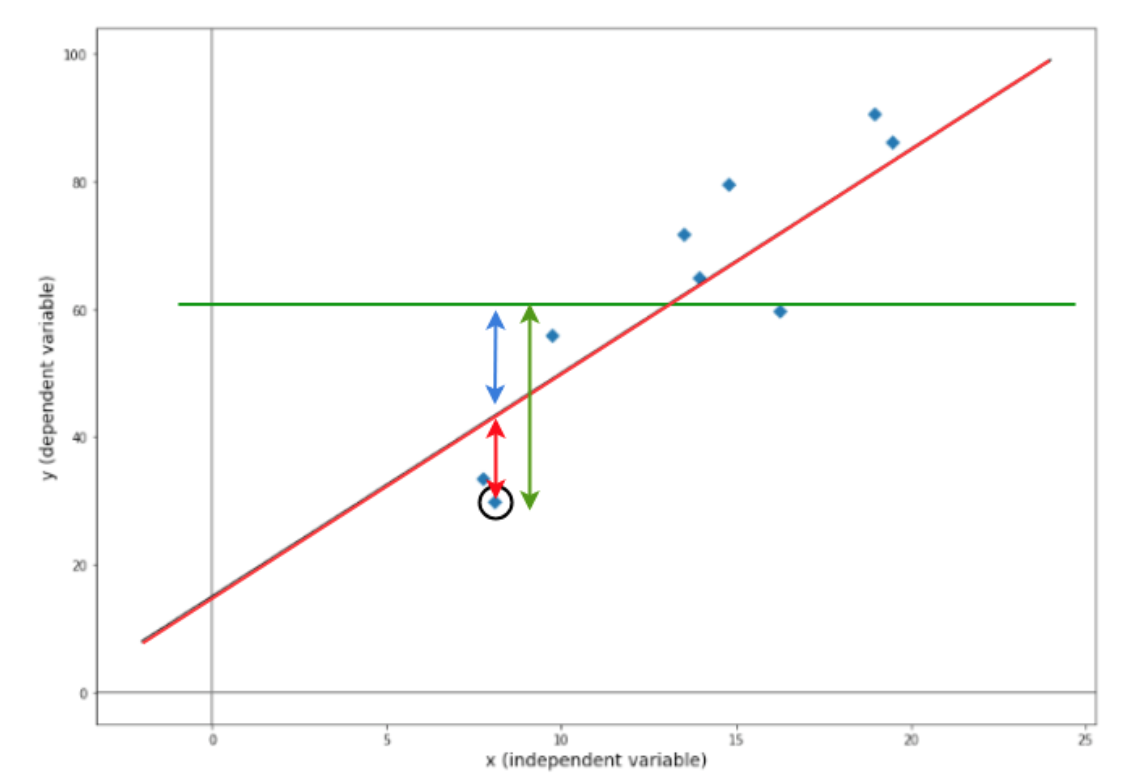 Image via: https://learn.co/tracks/data-science-career-v2/module-1-python-for-data-science/section-07-introduction-to-linear-regression/coefficient-of-determination
It is interesting to note that the R-Squared formula does not make use of any independent variables.
Is a Low R-Squared Always Bad?
Just because a model a has a low R-Squared does not mean it is a bad model. R-Squared is often said to measure the goodness of fit of a regression line however this can be misleading. Some areas of study will always have a a greater amount of unexplained variation, for example, studies trying to predict human behavior. If you have a low R-Squared but the independent variables are still statistically significant you can still draw conclusions about the relationships between the variables and your regression model may be the best fit for a given dataset. If the residuals are widely dispersed and variance (?2) is high, your R-Squared will inevitably be smaller but the regression line may still be the best way to describe the relationship between variables.
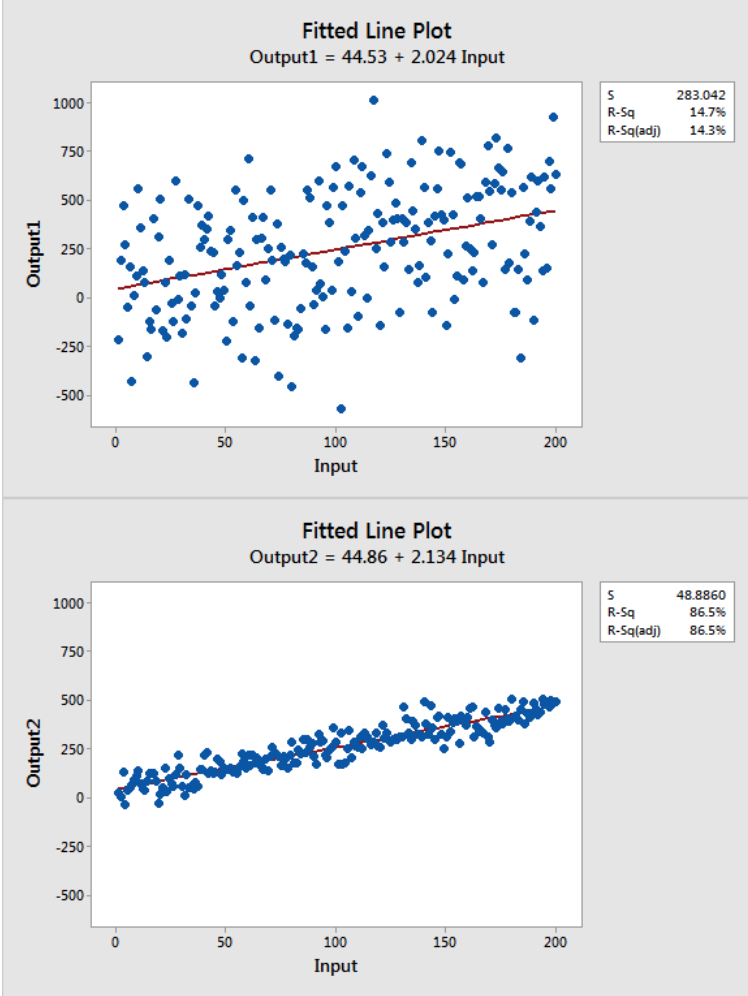 Image via: https://blog.minitab.com/blog/adventures-in-statistics-2/how-to-interpret-a-regression-model-with-low-r-squared-and-low-p-values
Is a High R-Squared Always Good?
R-Squared may also be high but does that mean the model is accurate? Not necessarily. There are many possibilities as to why your R-Squared is high that have nothing to do with the predictive validity of your model. One case is that you can be predicting one variable by unintentionally using a different form of the same variable, for example you may be predicting the temperature in Fahrenheit and one of your independent variables is temperature in Celsius. You would obviously get a very high R-Squared but a model that predicts one variable using the same variable in another form is useless.
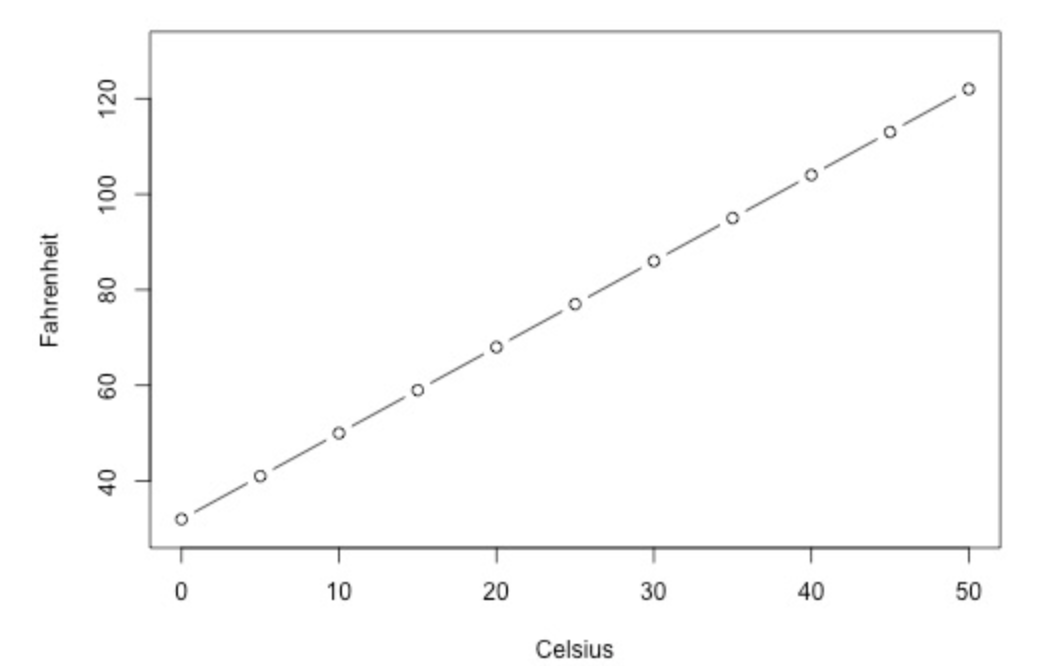 Image via: https://newonlinecourses.science.psu.edu/stat501/node/251/
Another possibility is that there are too many variables in your model compared to the number of observations. This will lead to an overfitted model and although it can predict the modeled data well it will not predict new data well. To ensure you are not over-fitting your data to achieve a high R-Squared you can either split your data to train and test it but you can also look at the Predicted R-Squared.
Predicted R-Squared can be calculated using a statistical program that removes each data point from the data set, re-calculates the regression line, checks how well the line predicts the missing data point, and then repeats this process for each data point in the the dataset. If your Predicted R-Squared is significantly lower than your R-Squared value then you can assume your model is over-fitting to the data and you may need to remove some independent variables from your model.
We may also see situations where R-Squared is close to 1 but the model is completely wrong. If you look at the below figure you will see that the below model has a R-Squared of .92 but all you have to do is look at the graph and you will see that the regression line does not fit the data well and another model should be used.
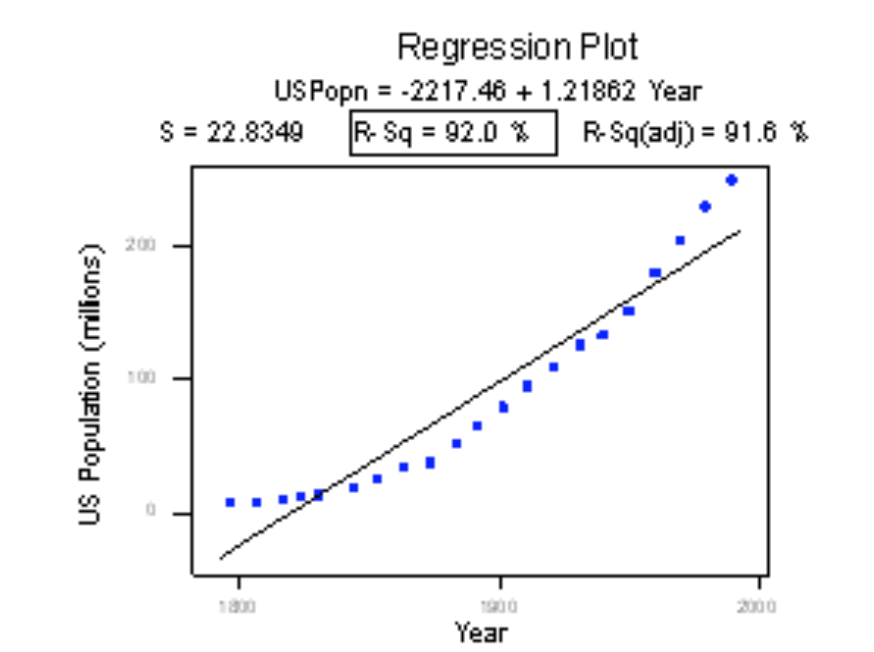 Image via: https://newonlinecourses.science.psu.edu/stat501/node/258/
Another problem with R-Squared is that if you keep adding more and more independent variables, R-Squared will go up. However, that does not mean these additional variables have a predictive quality. For example, let?s say you are creating a model to predict the weight of a person using their height. You then decide to add the variable, eye color and find that your R-Squared goes up. Does this mean that someone with brown eyes is likely to weigh more or less than someone with blue eyes? Probably not but in order to confirm this we could use Adjusted R-Squared.
Adjusted R-Squared takes into account the number of independent variables you employ in your model and can help indicate if a variable is useless or not. The more variables you add to your model without predictive quality the lower your Adjusted R-Squared will be. You can see that the number of independent variables, k, is included in the Adjusted R-Squared formula below.
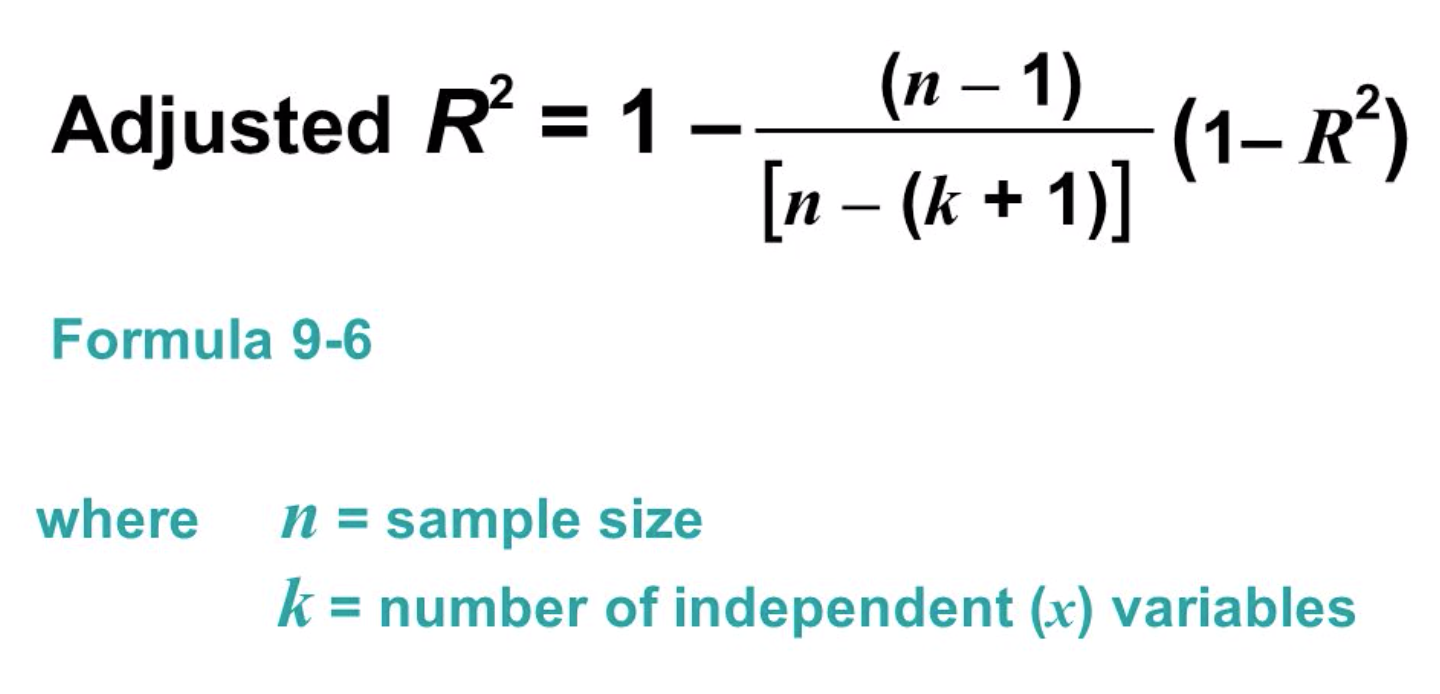 Image via: https://slideplayer.com/slide/8485605/
Just like R-Squared, Adjusted R-Squared is a value between 0 and 1 and will either be lower than or equal to R-Squared. You want the difference between R-Squared and Adjusted R-Squared to be as small as possible.
Final Thoughts
R-Squared is a useful statistic to use when determining if your regression model can accurately predict a variable but it must be used carefully. We cannot simply throw away a model because an R-Squared value is low or assume we have a great model because our R-Squared is high. We must look at the spread of our residuals, what type of predictor variables we are using and how many we are using. It is also helpful to look at the Predicted R-Squared and Adjusted R-Squared compared to our original R-Squared. Keep in mind that R-Squared is not the only way to measure our prediction error and it may be useful to look at other statistics like the Mean Squared Error.

