
A complete guide to stock market returns, crucial dividends, fatal mistakes, and the magic of compounding
 Photo by NeONBRAND on Unsplash
This is one of the biggest questions in all of stock market investing:
?How much money can I really make from stocks??
Let?s cut right to the chase:
If you start early, save steadily, and invest intelligently, you can make a lot of money in the stock market.
OK, but how much is ?a lot??
Based on in-depth research, we uncovered 10 major insights about how much money you can earn in the stock market:
- Stocks generally return 7?10% per year over long periods of time.
- In any given year, they could do far better or far worse than that.
- Over longer stretches of time (10?15+ years), the market almost always makes money.
- Pay attention to dividend stocks, because roughly 40% of the stock market?s gains tend to come from dividends (although it varies over time).
- Individual investors may do far better or (more commonly) far worse than the market, depending on how good they are at investing and whether they avoid common mistakes.
- The longer you?re invested in the market, the more your money will grow.
- The higher your annual investing returns, the more your money will grow.
- Small improvements in your investment returns can make a huge difference in your wealth over time.
- The more you can avoid paying taxes on your investment gains, the more your money will grow.
- Solid stock investment returns compounded over long periods of time create almost magical amounts of wealth.
Below is the full story, with detailed charts, explanations, and a stock market wealth calculator.
How Much Does the Stock Market Return?
First, we need to know how much the stock market will go up (or down) while you?re invested in it.
Much research has gone into the question of how much the stock market will return, but let?s keep it simple for this discussion.
Most analysts agree that historically the stock market has returned an average of 7% ? 10% per year over the last 100+ years.
Now, the first thing to understand is that 7% ? 10% is an average return over long stretches of time. It?s not what you should actually expect to return each year.
For example, in 2008 the S&P 500 (a collection of the 500 biggest companies on the market) returned a devastating -38.5% loss as the stock market crashed. The very next year, it rallied for a strong +23.5% return.
Now, those are two extreme examples and returns don?t typically vary that wildly.
However, it highlights an important point:
While you can expect 7% ? 10% annual returns from stocks over the long term, in the short term stock market returns will vary widely.
Vanguard presents an interesting visual example of this concept:
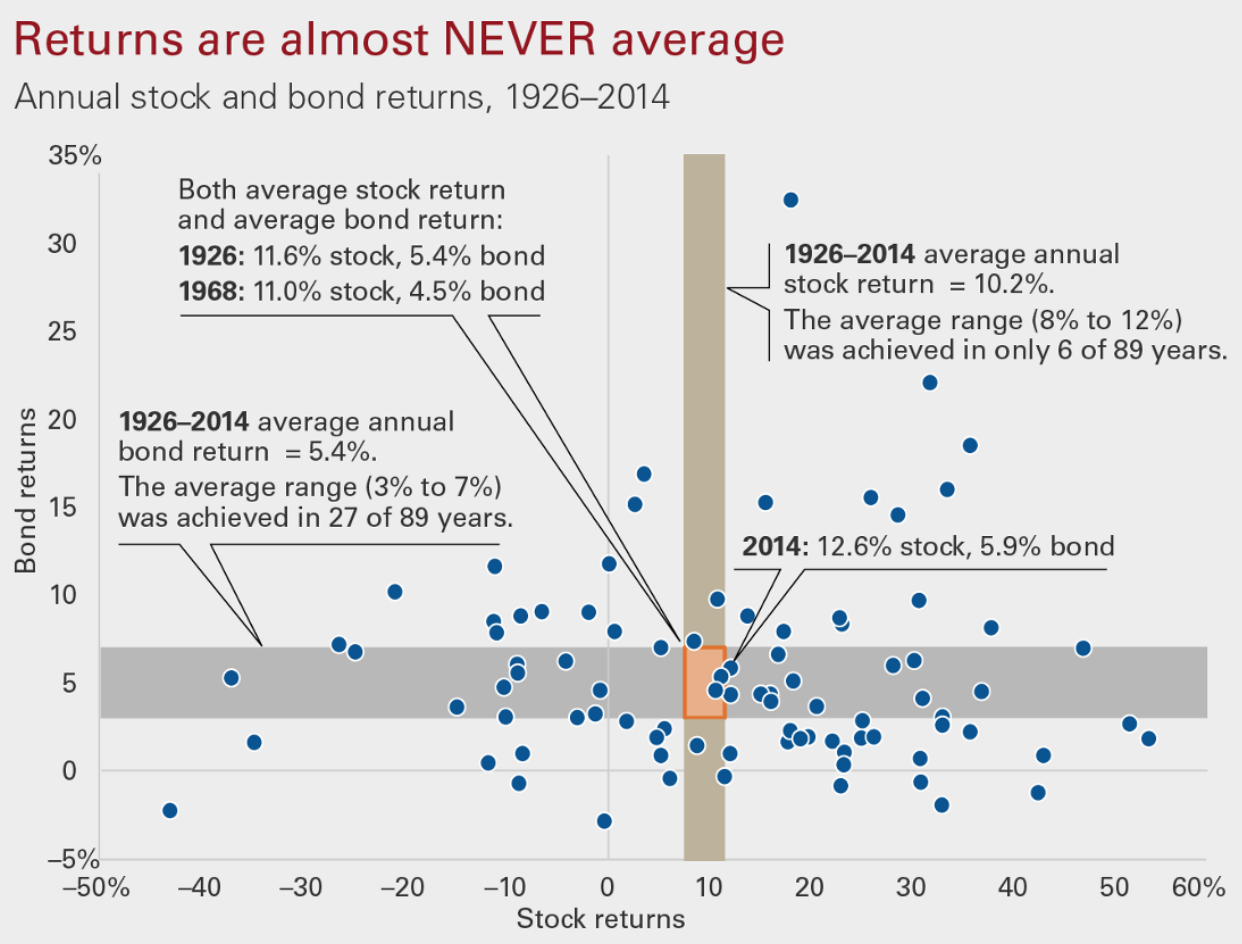
They say that from 1926?2014 (89 years), the stock market returned an average of 10.2% per year. However, of the 89 years plotted on the graph (each blue dot represents stock market returns for a single year), only 6 years actually returned in the 8?12% range!
So this is a very important lesson:
Even though you can plan for 7% ? 10% annual returns over the long term, it?s very unlikely in any given year that you?ll actually earn a 7% ? 10% return in that year.
Put simply, in the short term stock returns tend to be all over the place. Don?t let that throw you off. Have faith that in the long term, they?ll even out to somewhere between 7% ? 10% per year.
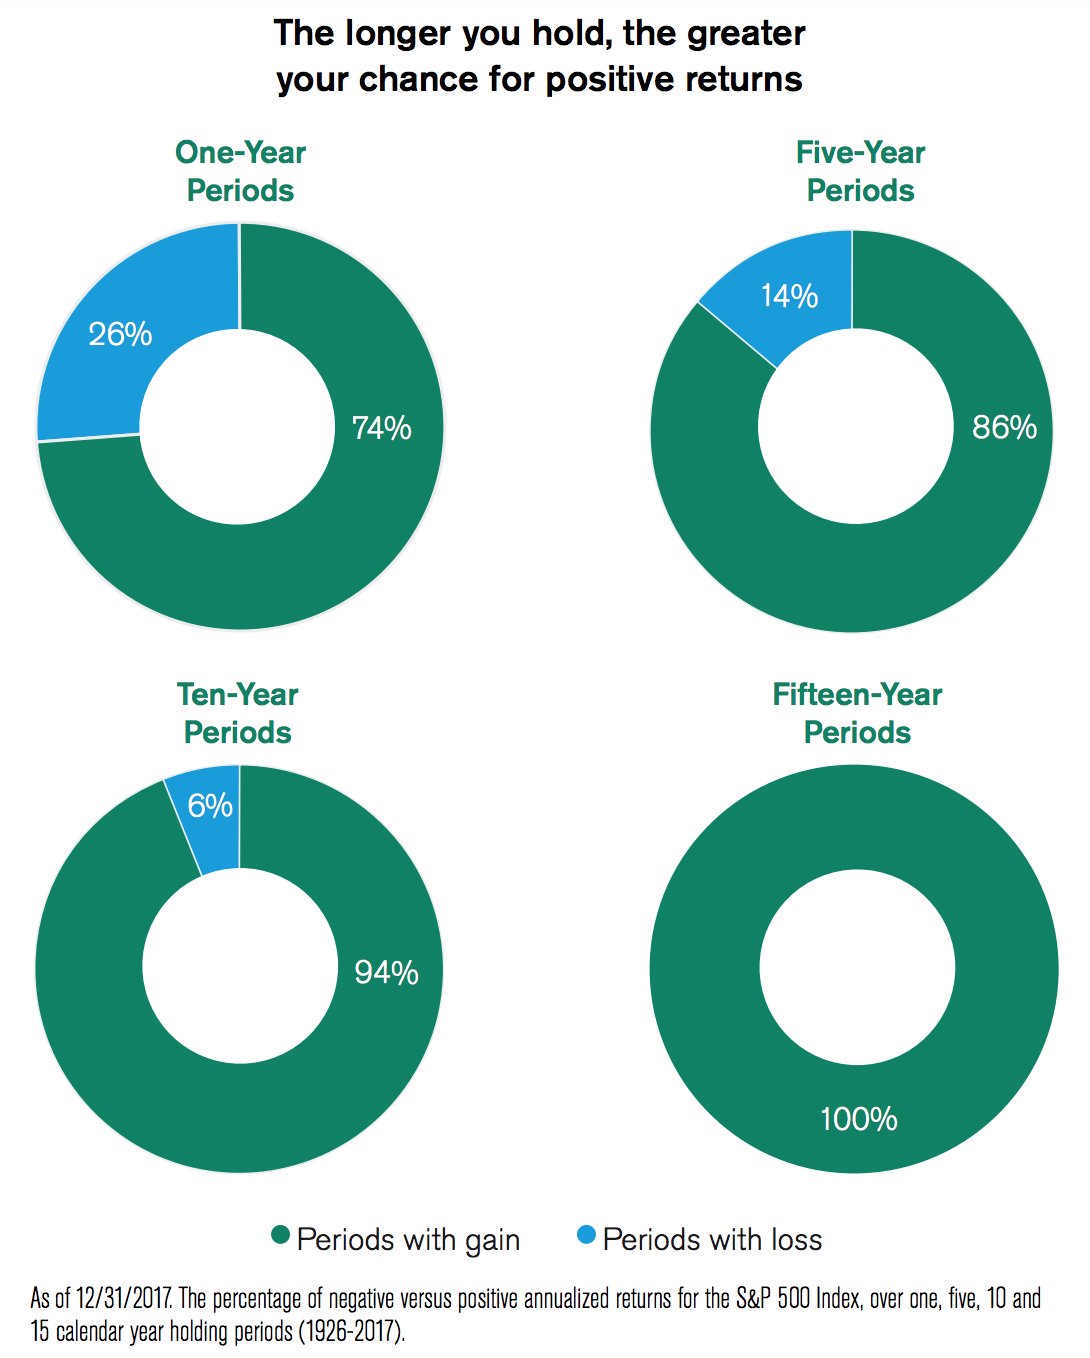
Now, let?s take a look at an interesting chart from Morningstar.
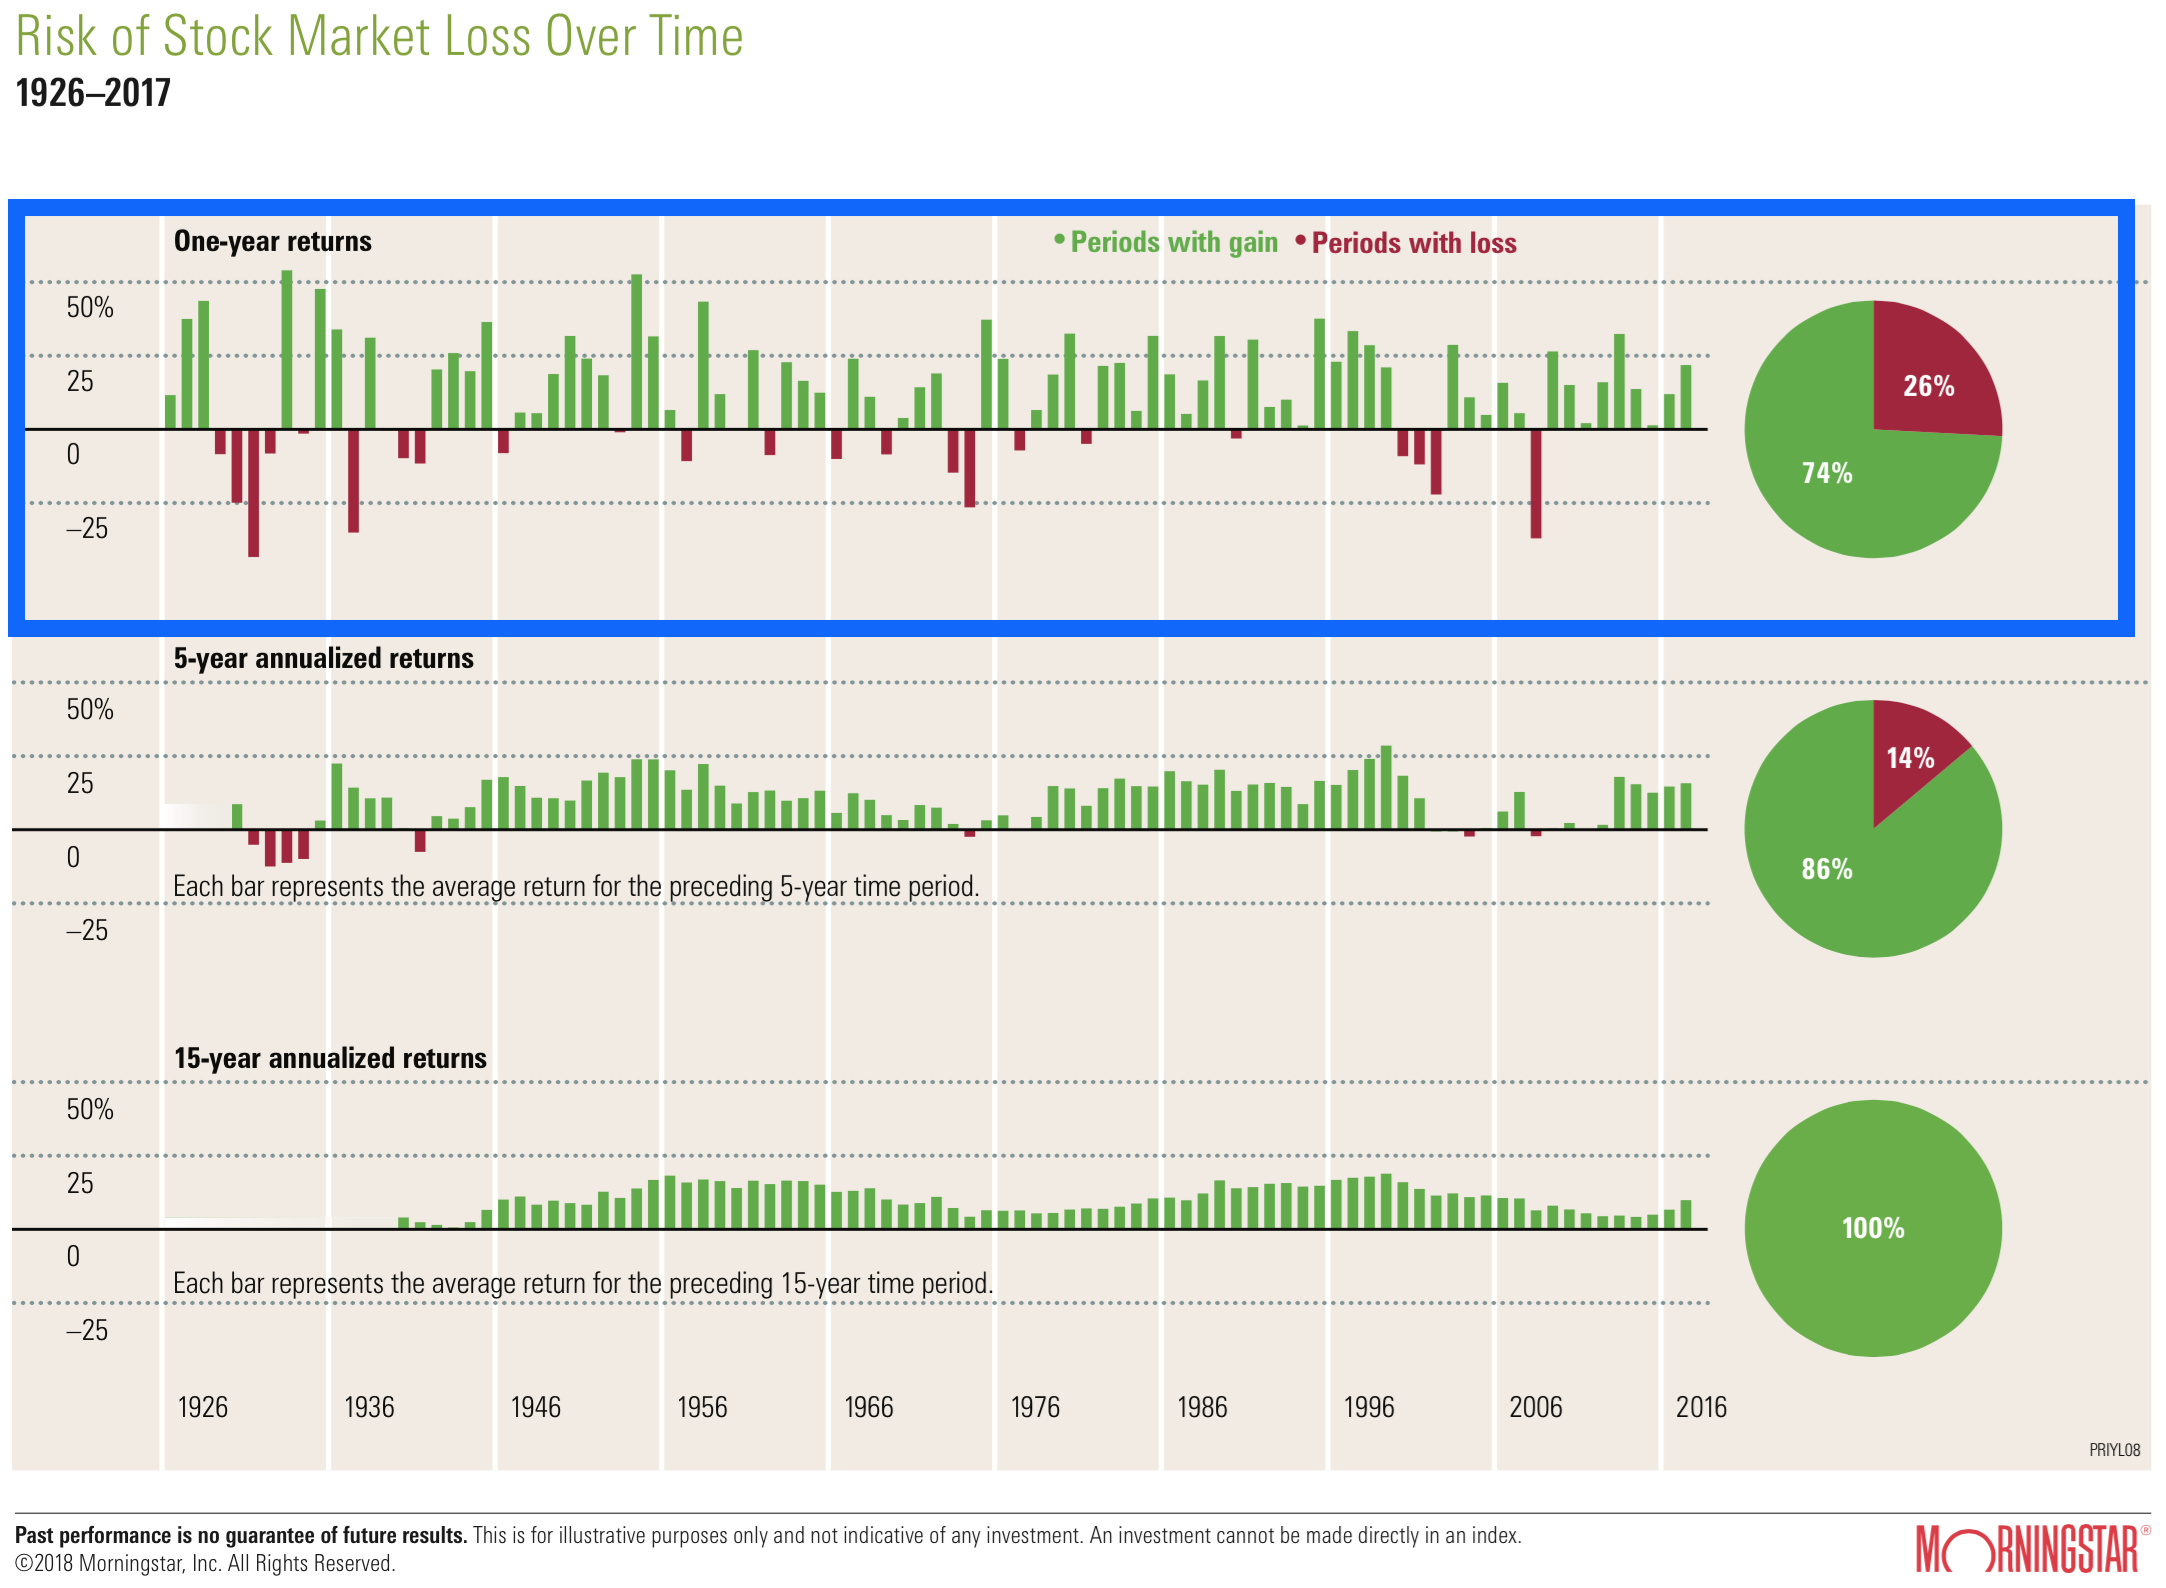
Here we see two important lessons:
Again, we see that returns can vary widely each year. Looking at the top row (framed in blue), we can see some bars are green (a positive gain in stock prices for the year) whereas some bars are red (a negative loss in stock prices for the year). Also, some bars are big (a big gain or loss) and some bars are small (a small gain or loss).
Looking at the top row, we again get the impression that returns are all over the place.
But this brings us to another important point:
For the last 92 years (1926?2017), the stock market has tended to produce positive returns each year.
Looking at the top row, see the pie chart on the right? This shows that in 74% of the last 92 years, the market has produced a gain. It has produced a loss only 26% of the time.
Now, let?s look further down the chart at the bottom two rows (framed in blue).
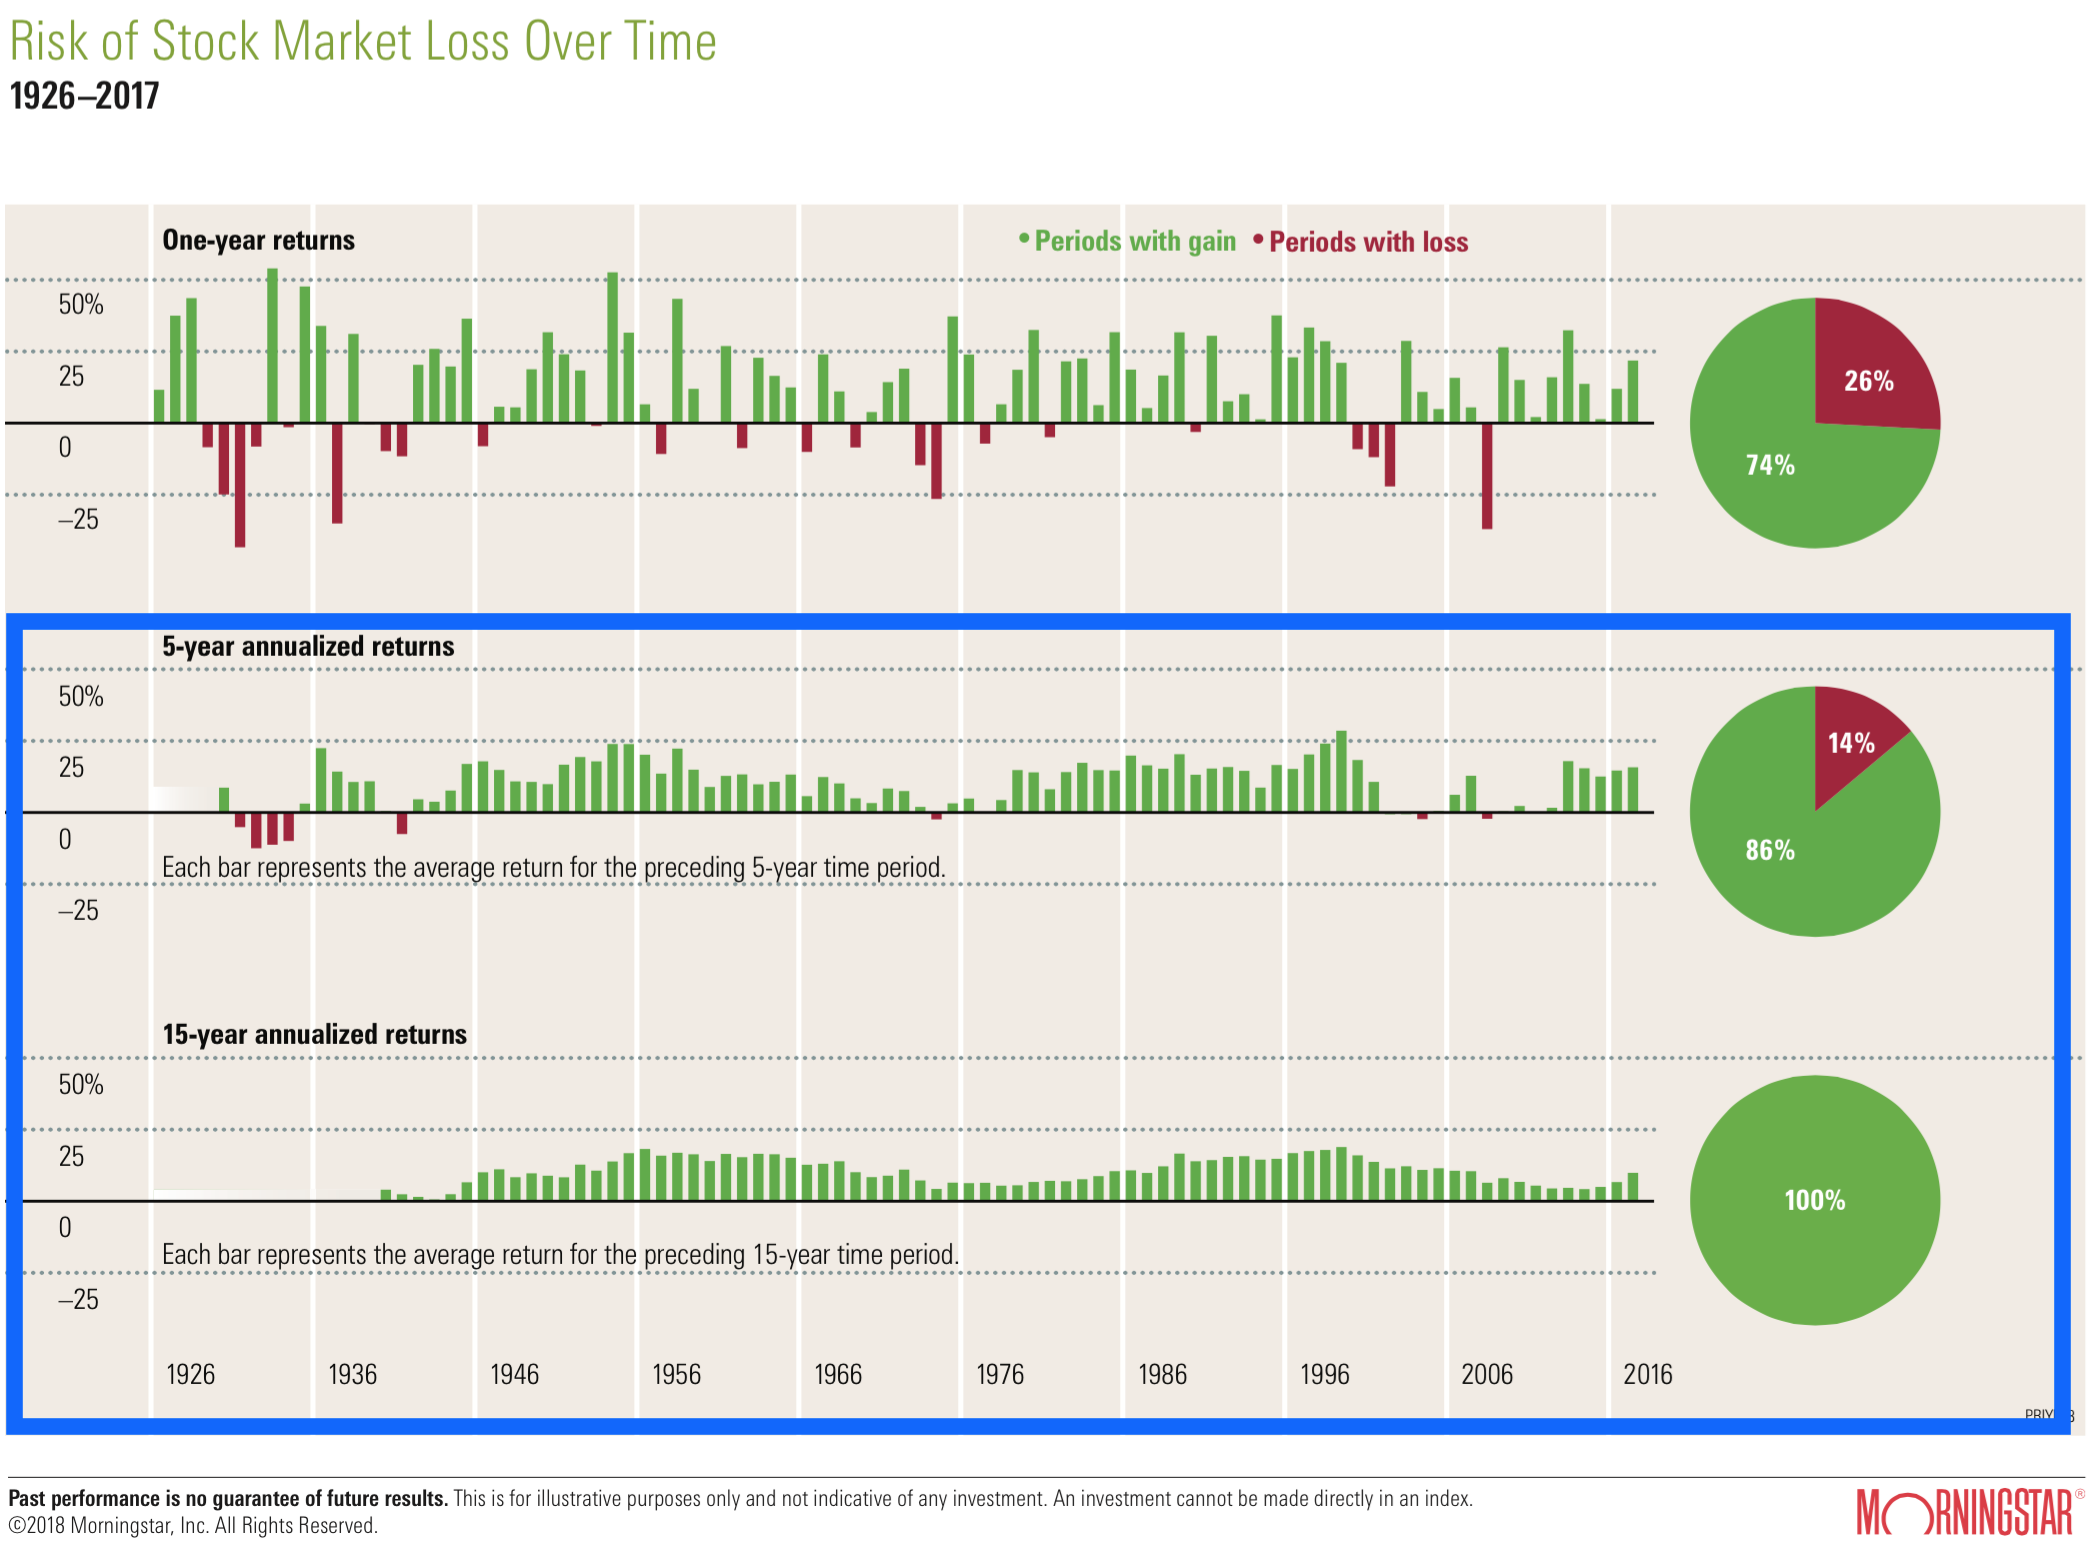
In these rows, instead of looking at yearly returns (like the first row), we?re looking at returns for a chunk of 5 years (middle row) or 15 years (bottom row).
In other words, we?re saying, ?OK, clearly there?s a lot of variation between the returns from one single year to the next. So, let?s zoom out a bit and look at a chunk of 5 years or 15 years ? how do those chunks of time perform??
Here we see that history has again been kind to the stock market investor. When looking at 5-year blocks of time, the stock market has produced a positive gain 86% of the time. And when looking at 15-year blocks of time, the market has produced a positive gain 100% of the time.
Let?s say it another way: if you look at any 15-year period between 1926?2017, the stock market has never lost money.
Vanguard provides another interesting view of stock market returns from 1935?2012:
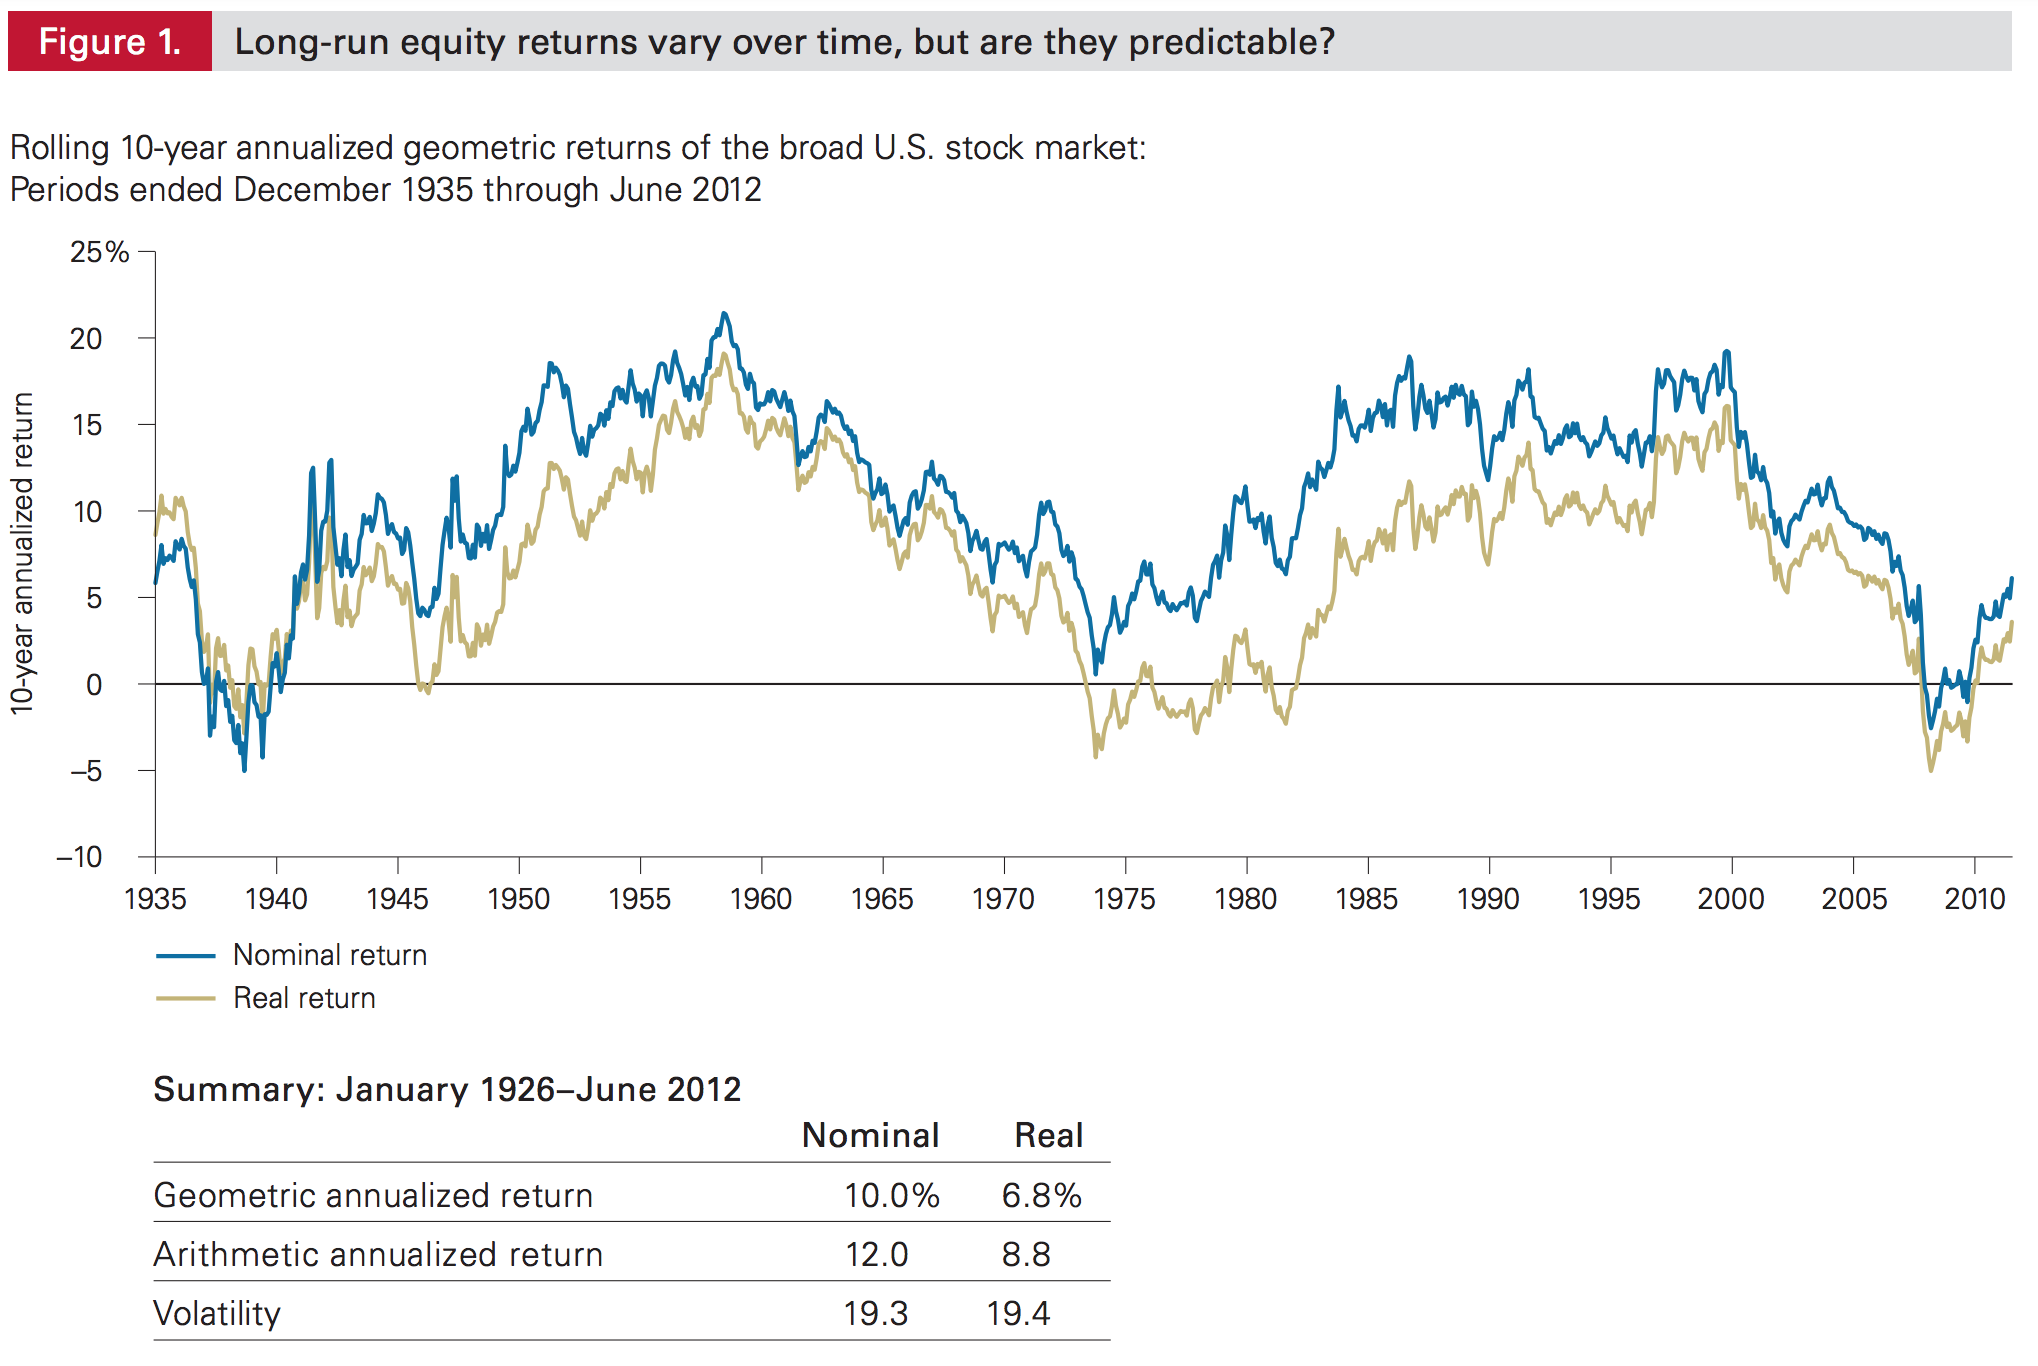
The chart is a little more complicated than it needs to be, but basically you want to focus on the blue line, which represents the average yearly return for the stock market for the previous 10 years.
See how much time the blue line spends above zero vs. below zero? Again, that tells us that the stock market has made money (had a positive gain) over nearly every 10 year period for the last 84 years.
Finally, here?s a crystal clear way to see the power of holding stocks for the long term:
This chart from American Century Investments shows that if you had invested in the S&P 500 during any 10-year period from 1926?2017, you would?ve made money during 94% of those samples. And if you had invested during any 15-year period, you would?ve made money 100% of the time.
This point is absolutely critical:
While the stock market can perform erratically from year to year, over the long term it tends to perform very well.
This is what people miss when they say things like, ?investing in the stock market is just gambling.?
I cringe when I hear people say that.
Sure, if you put all your money on one stock, or you invest everything you have for just one single year, it?s sort of like playing roulette and putting all your money on black. Anything can happen. But if you invest in a solid portfolio of stocks over a long period of time, history shows you have a very high chance of making money.
Now, let?s dig into how that money is actually made. Because more of it comes from dividends than you might expect.
How Much Do Dividends Contribute to Stock Market Returns?
History shows that dividends play a large role in stock market returns over time.
While it varies by decade, over time dividends have contributed about 40% of the total return of the stock market.
What does that mean?
Imagine you invest $10,000 into a portfolio of stocks and leave it there for 10 years. After ten years, you look in your account and see that your money has doubled. You now have $20,000 ? great work!
You decide to dig in and look at your account statements for the last 10 years to figure out how you made so much money. What you discover is that of the $10,000 you earned in the market, exactly $4,000 came from dividends, and the other $6,000 of profit came from your stock?s prices going up.
In that scenario, we?d say that 40% of your total return came from dividends and 60% of your total return came from price appreciation.
Historically, dividends have contributed around 40% of total stock market returns. But this varies greatly through different periods.
Let?s look at this chart from Hartford Funds, which shows how much dividends contributed to total stock market return in each decade.
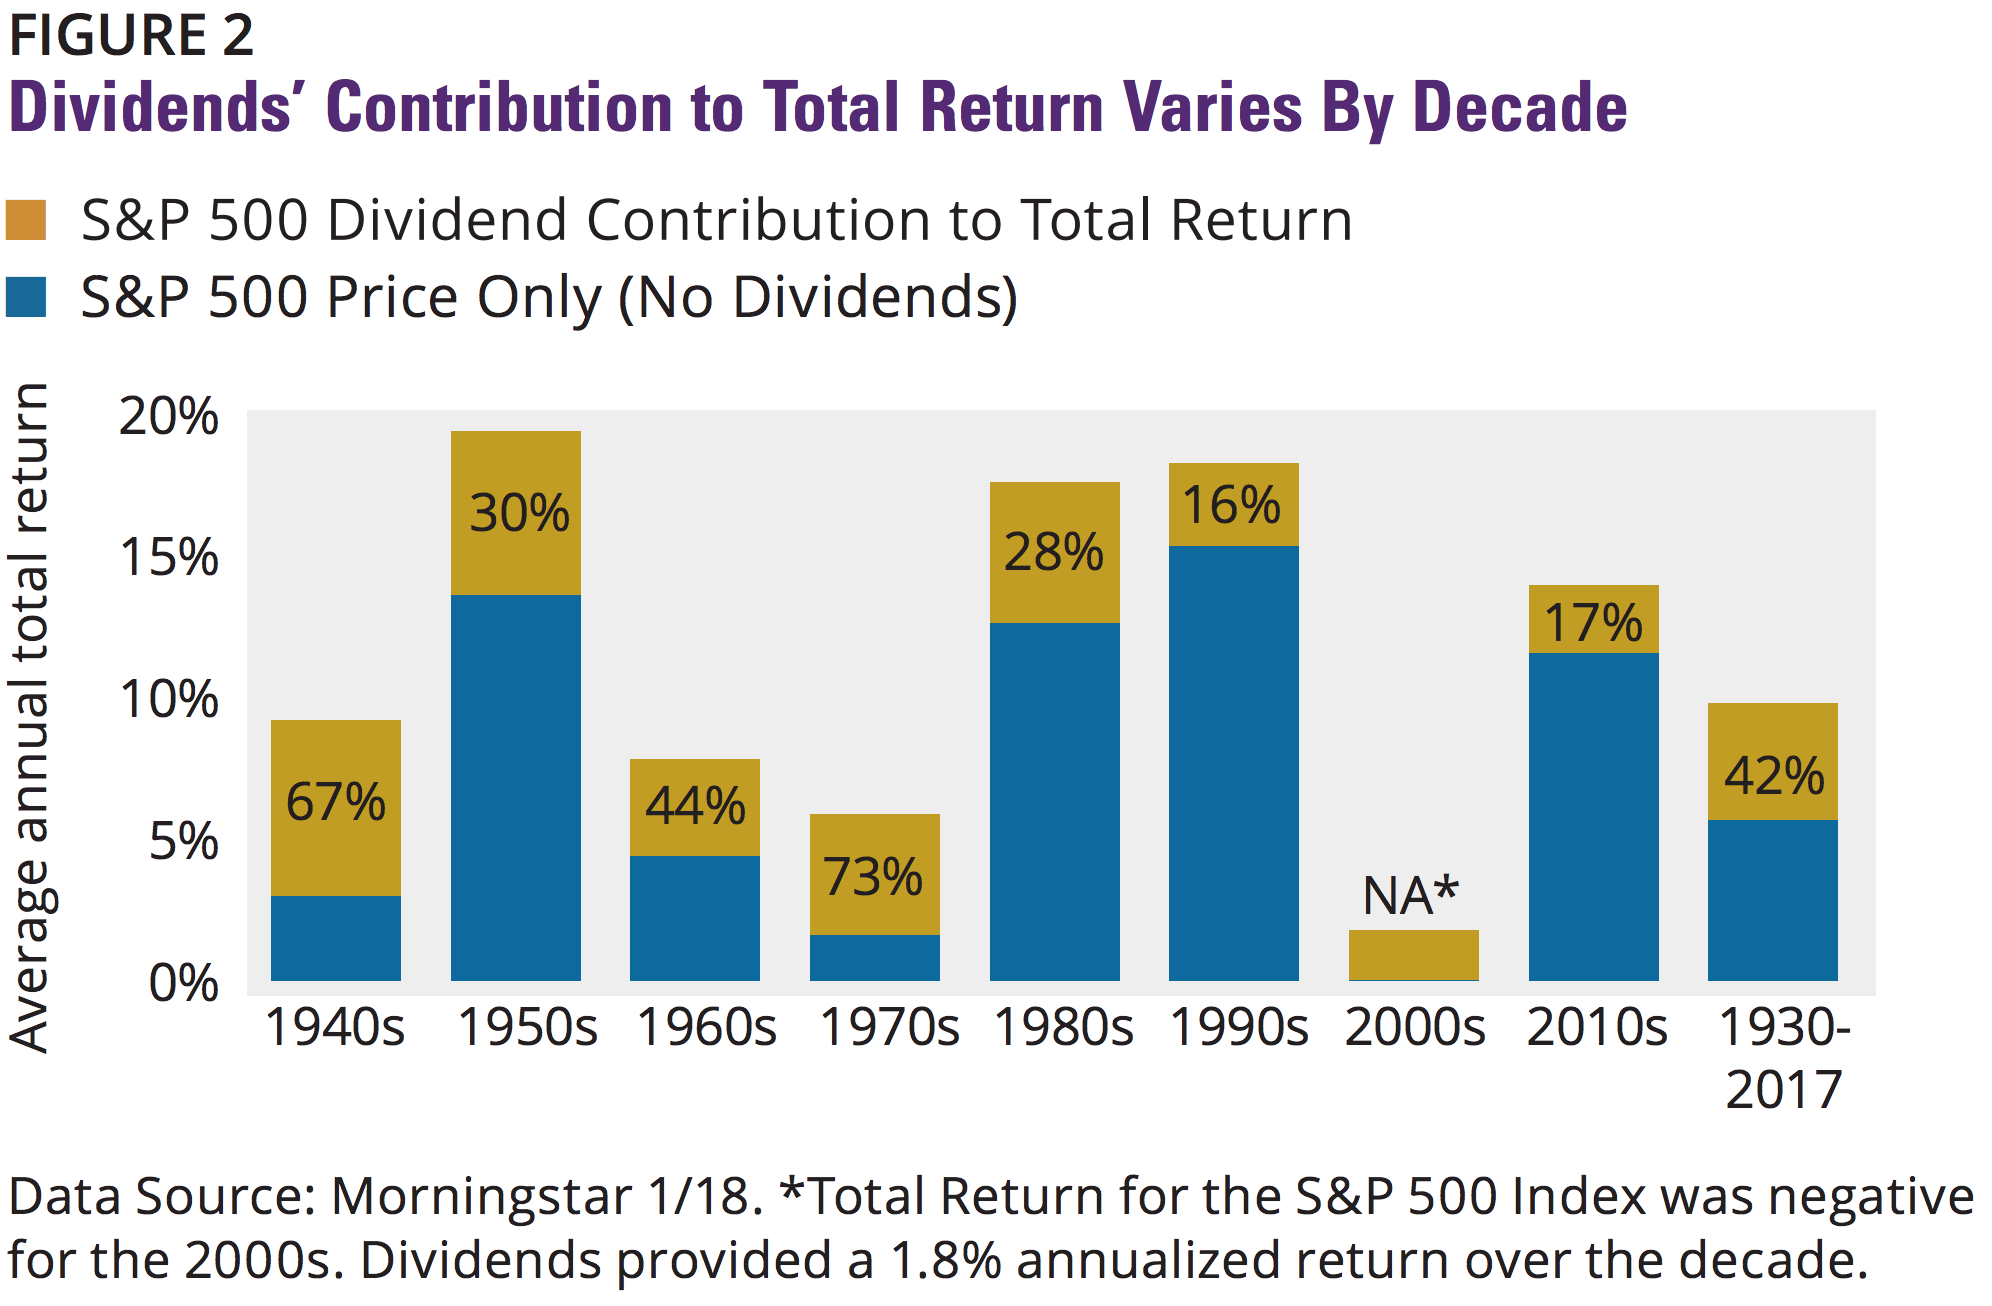
In times when stock prices struggled to gain, dividends contributed more of the total return (for example, look at the 1970s when dividends contributed 73% of the total gain).
On the other hand, in years when stock prices were performing well, dividends were responsible for less of the total return (look at the 2010s, where dividends have contributed only 17% of the total return).
The individual numbers will vary and don?t matter much. What matters is the concept: dividends have historically contributed a significant amount to total stock market returns. So it?s important you keep them in mind when buying stocks.
While Some Investors Are Good at Buying Stocks, Most Are Not
OK, so now we know that over the long term we can expect the stock market to return somewhere between 7% ? 10% per year. And we know that dividends are an important part of that return.
But there?s another critical element we have to consider:
In order to achieve 7% ? 10% stock market returns over the long term, you can?t invest like the ?average? investor.
Why? Because most investors tend to make big mistakes that prevent them from achieving that 7% ? 10% annual return.
J.P. Morgan has a stunning chart that shows just how poorly the average investor actually performs.
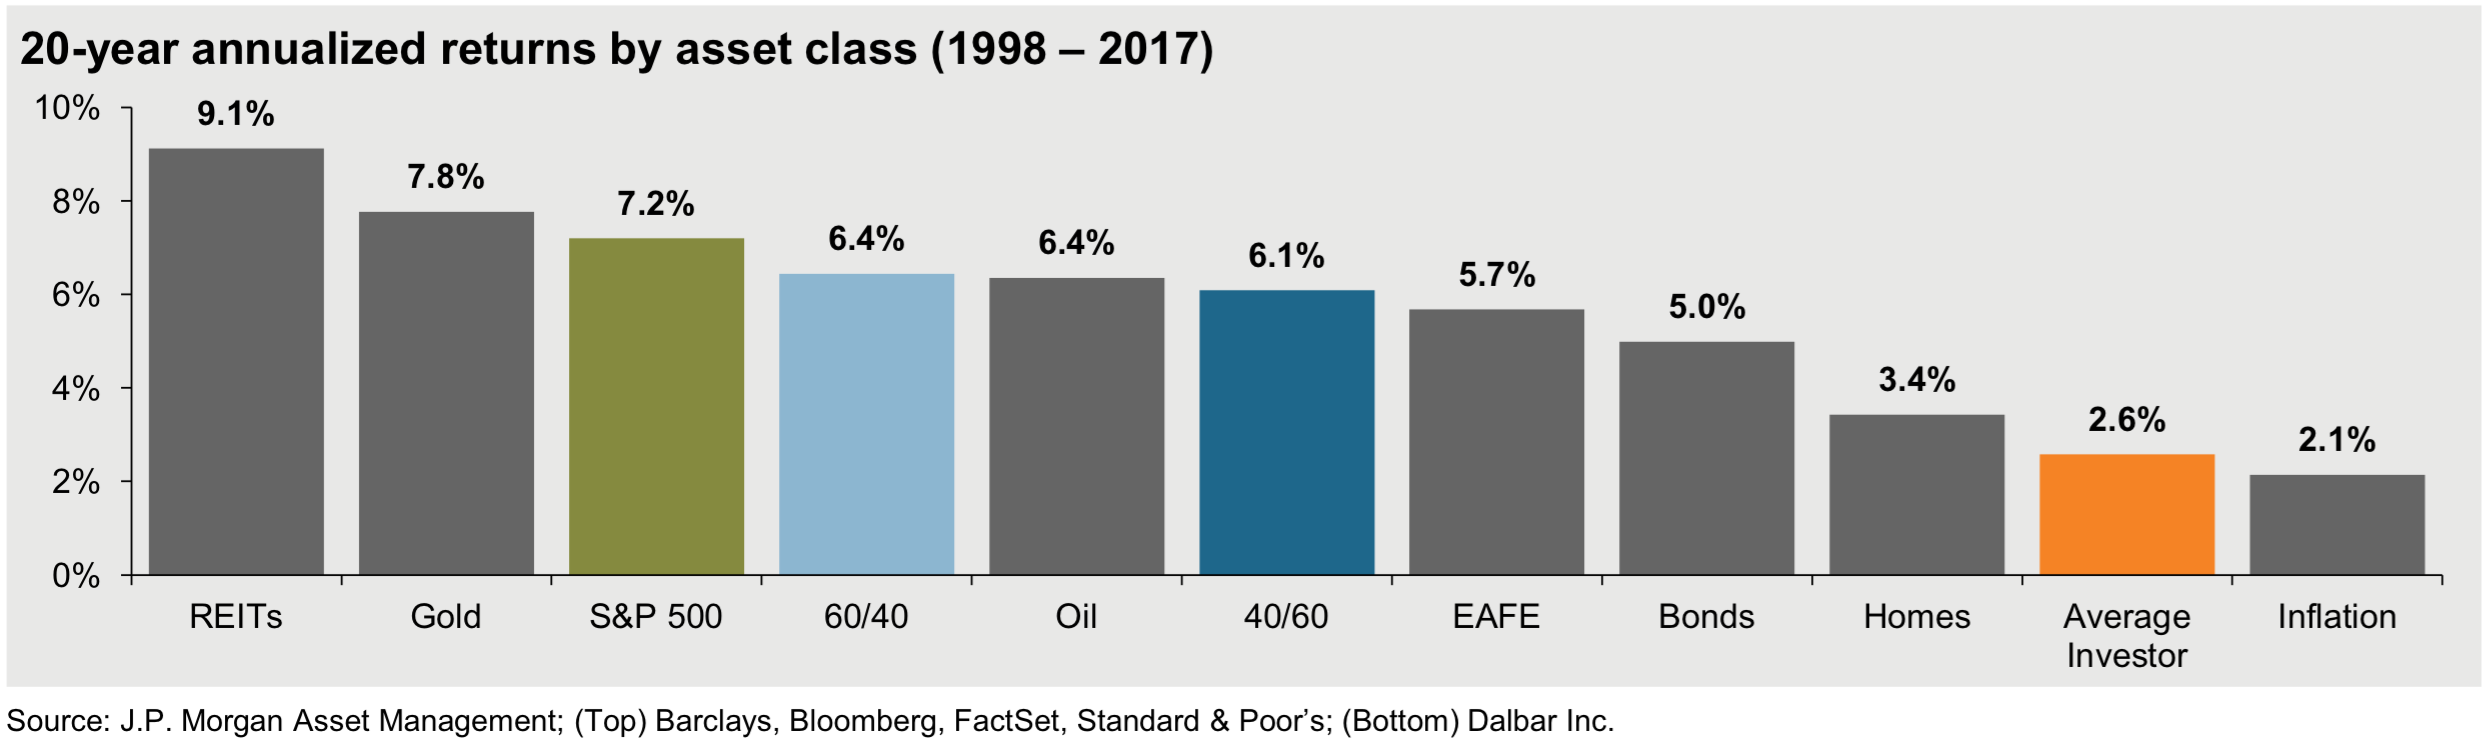
For the last 20 years, the S&P 500 has returned +7.2% per year (right within its typical 7% ? 10% range).
How about the average investor? Look at the little orange bar all the way to the right of the chart. A miserable +2.6% per year ? just barely better than inflation.
Why? The average investor tends to make common mistakes that devastate his returns.
So, remember that the strong 7% ? 10% long-term stock market returns aren?t a guaranteed thing.
On the flip side, the good news is that exceptional investors can actually beat the market over the long term, earning more than 7% ? 10% in annual returns. And every extra percentage point of annual performance will make an enormous difference in your long-term wealth.
Why? The magic of compound interest.
The Power of Compounding Stock Returns Over Long Time Periods
What is this ?power of compounding? that everyone talks about?
If you earn a good steady return on your investments (nothing crazy, just a good return) over a long time period (like 30, 40, 50, 60, or more years), that investment grows way bigger than seems possible.
Let?s look at an example.
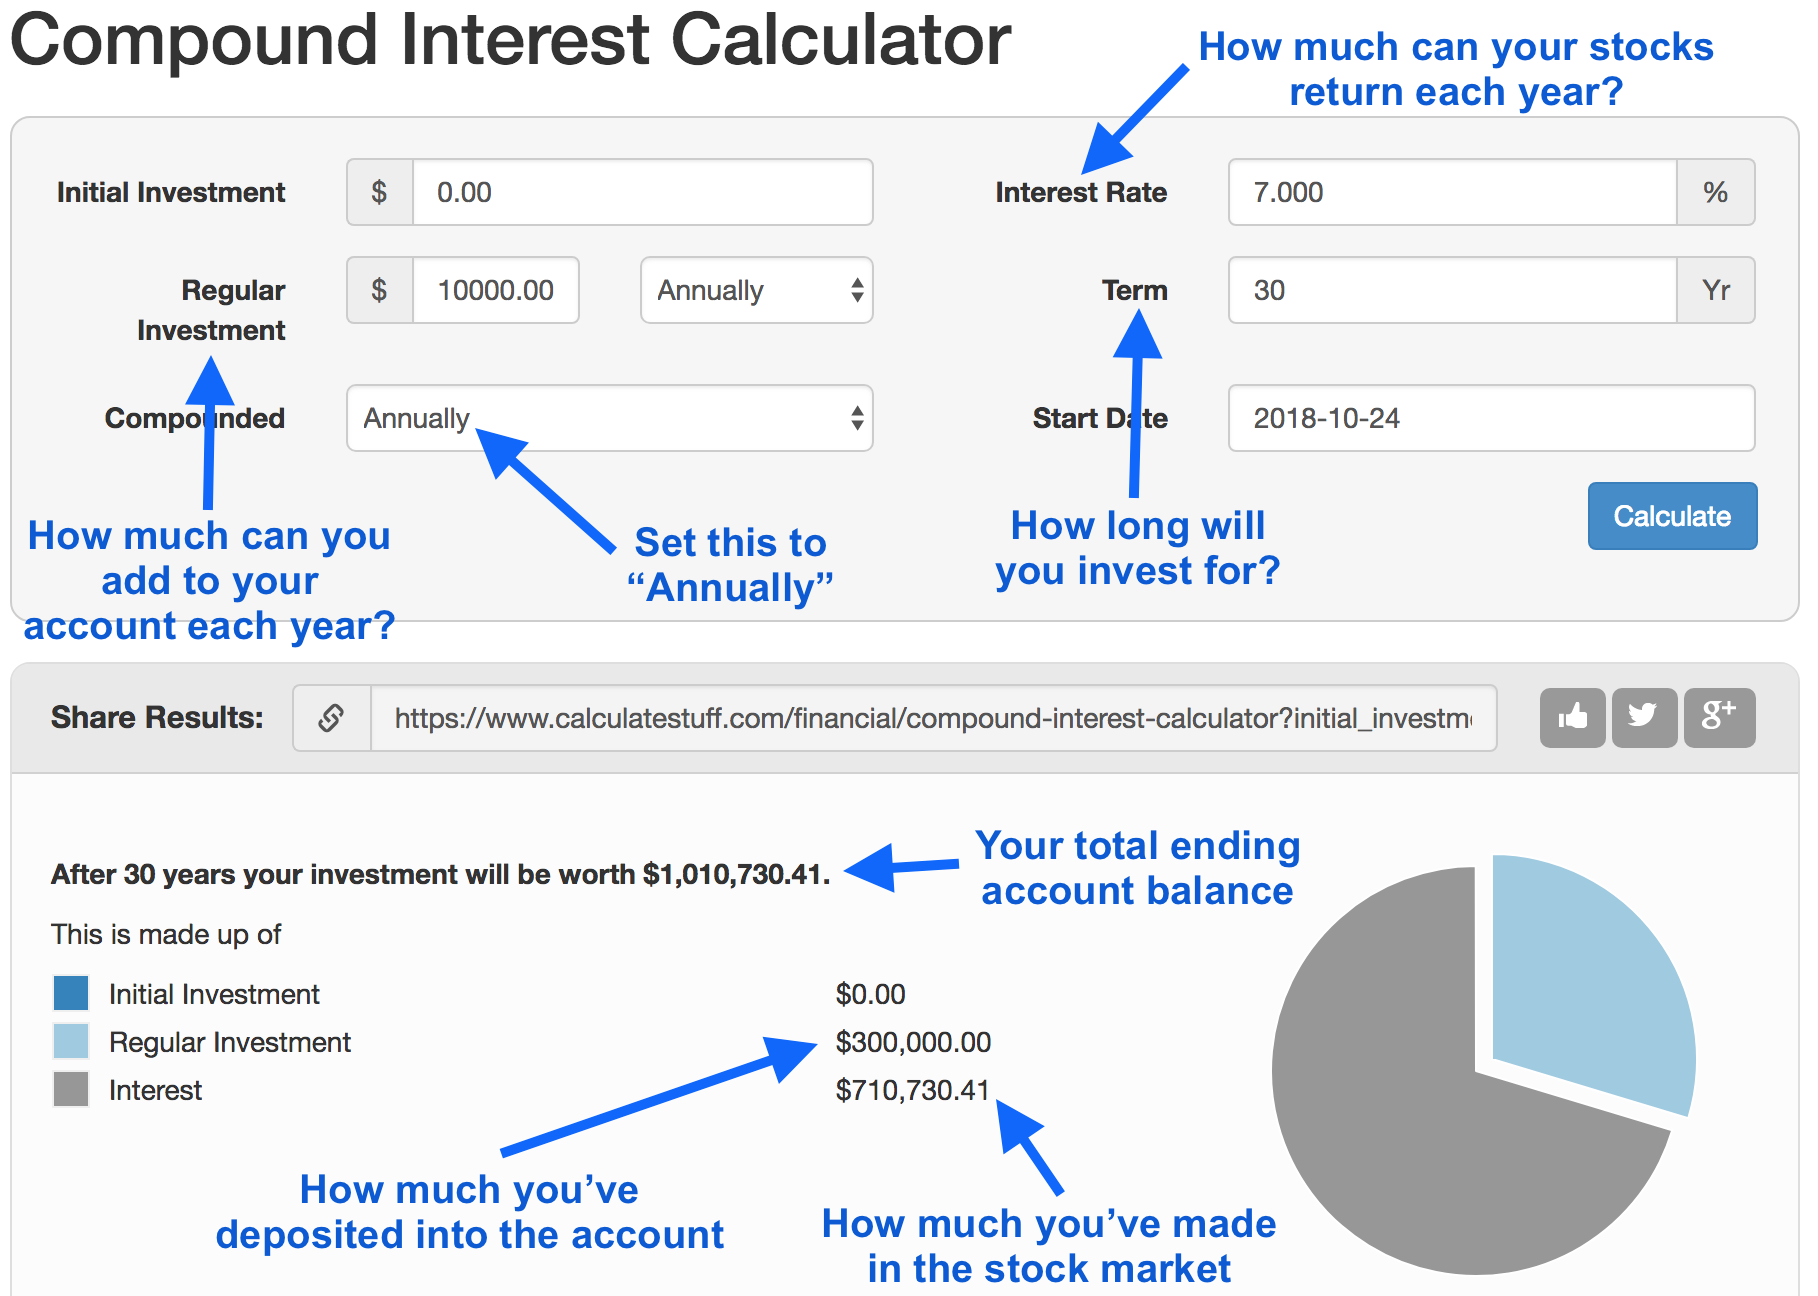
Let?s imagine you invest $10,000 into the stock market every year for 30 years and that you?re able to achieve the bottom end of our typical return range ? an average of just 7% per year.
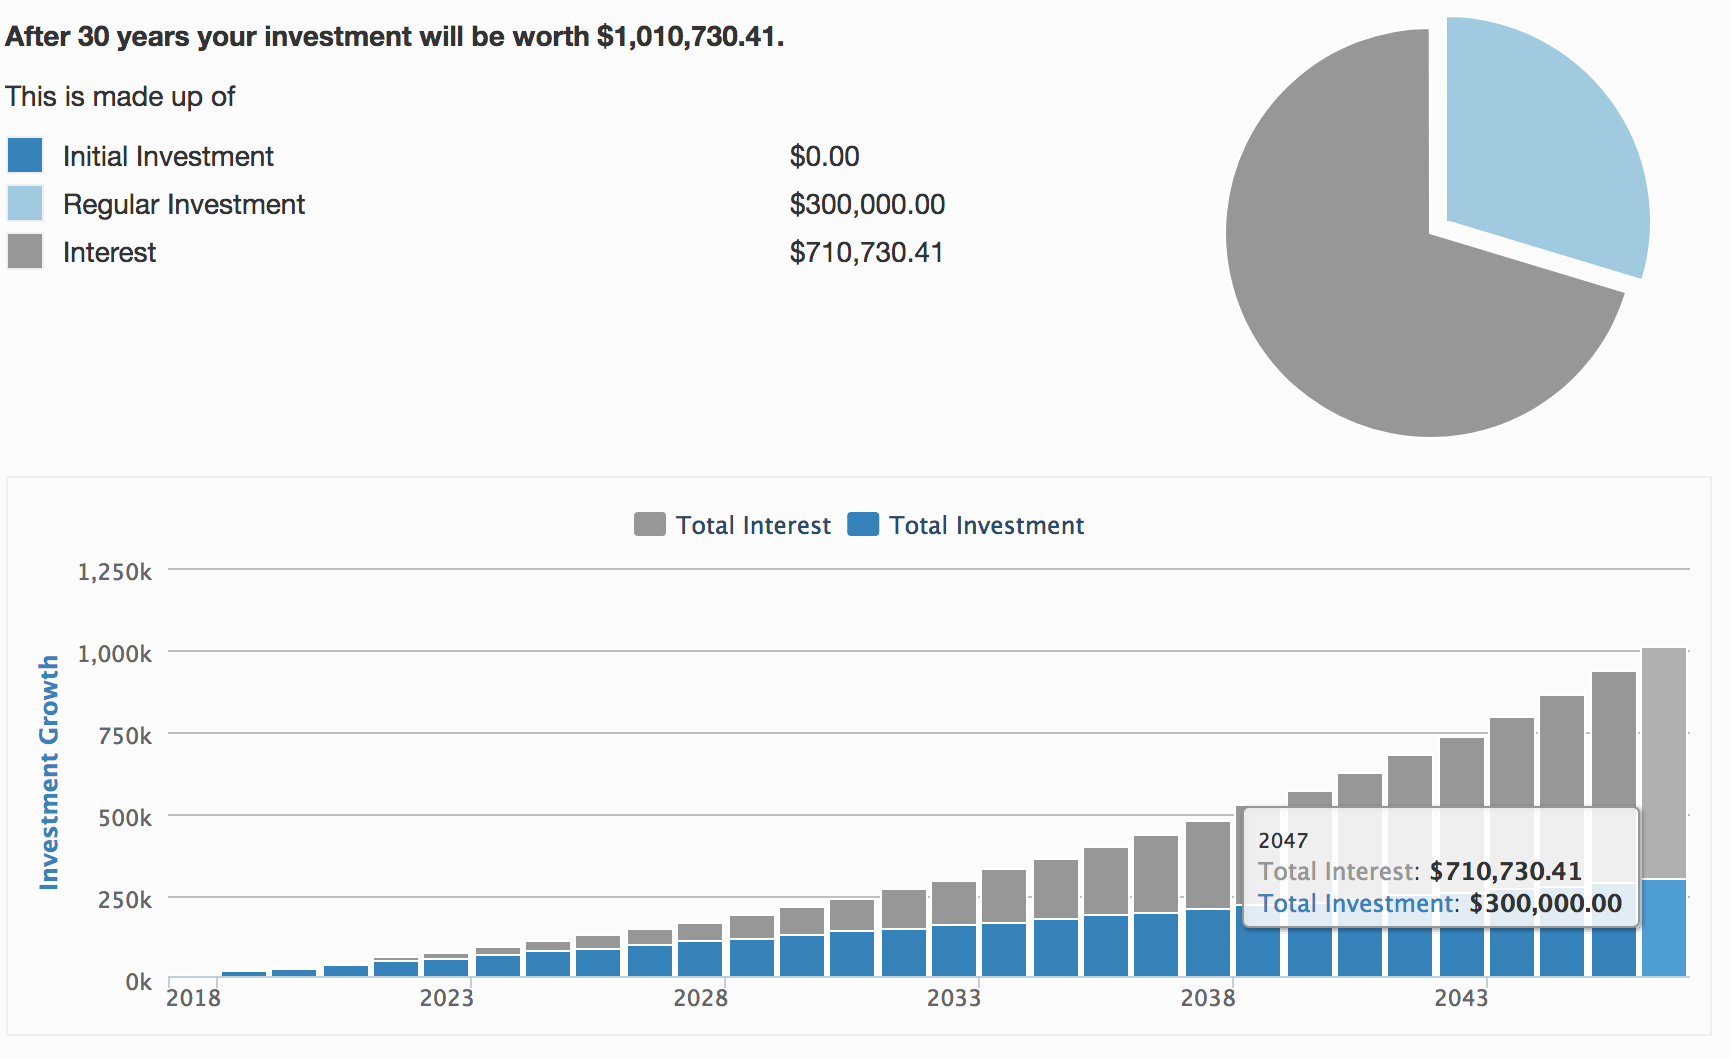
As you can see, over 30 years you will have invested $300,000 into the stock market ($10,000 per year x 30 years) but ended up with $1,010,730. That extra $710,730 came from earning 7% per year on your investments.
Now, let?s run that same exact scenario for 60 years instead of 30 years.
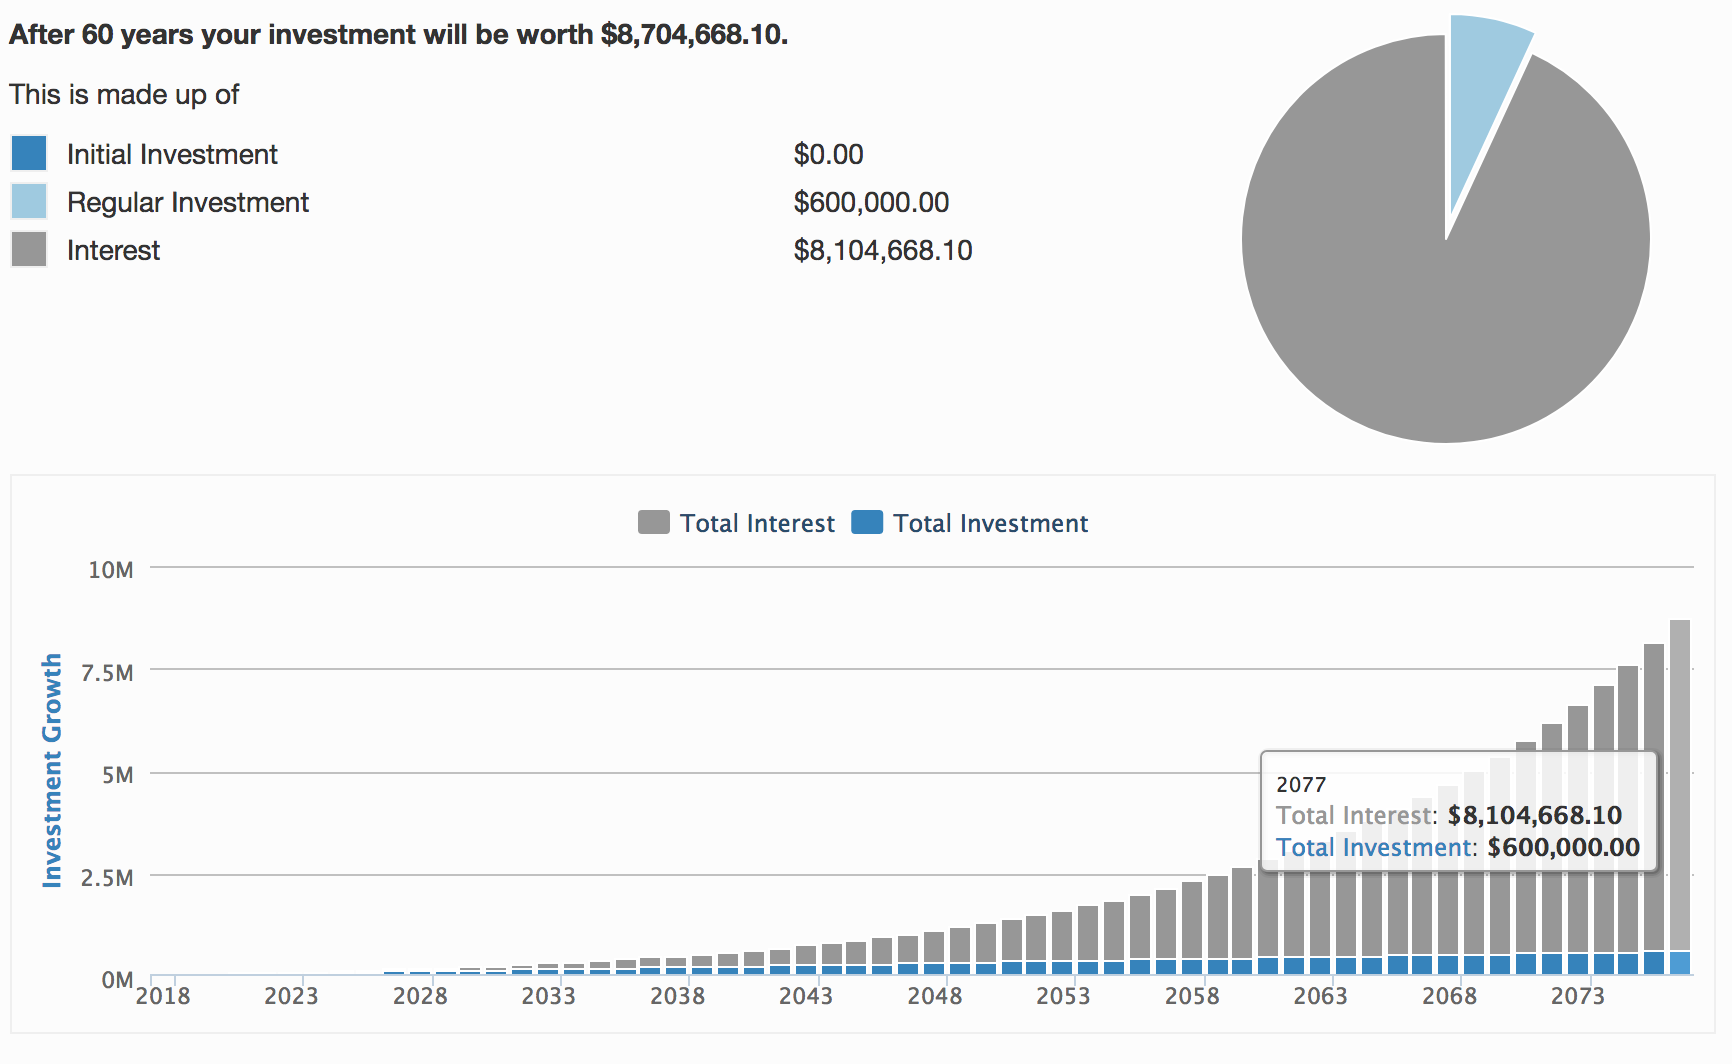
Here, you will have invested $600,000 into the stock market ($10,000 per year x 60 years) but ended up with $8,704,668. That extra $8,104,668 came from earning 7% per year on your investments.
So in the first 30 years, you earned $710,730 in the stock market. But when you went the full 60 years, you earned $8,104,668 in the stock market!
That?s the power of compounding. Your steady 7% return results in a bigger and bigger dollar gain with every year that passes.
Why? Because a 7% return on the $10,000 you invested in the first year is only a $700 return. But a 7% return on your investment in the 60th year is applied against the full $8+ million you?ve earned. It?s a huge number!
For example, here are the first ten years of gains in our example:
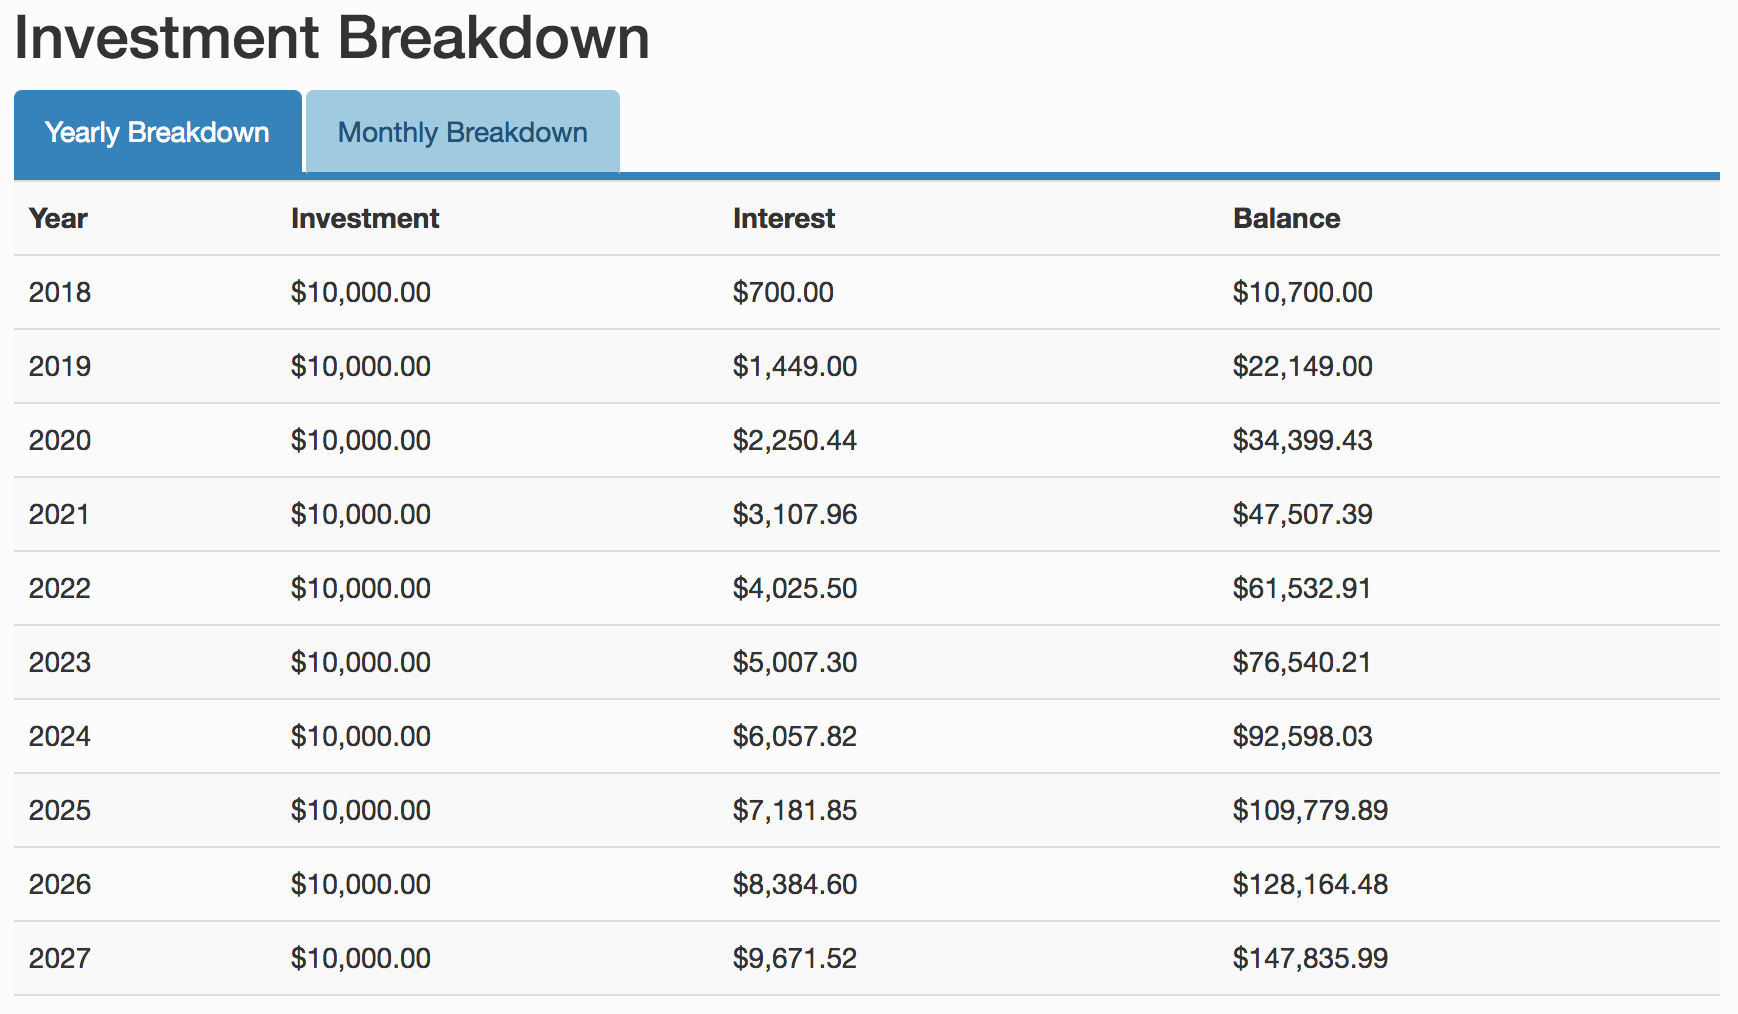
See that in the first year your ?interest? (which is your return from investing in the stock market) is just $700 ($10,000 invested x 7% annual return).
But just 10 years later, the amount of money you earn in the market from that annual 7% gain is now $9.671.52 ? nearly 14x as much profit as the first year!
And in the final year of your 60-year timeline, your 7% gain in the market equals a stunning $569,464 profit in that year alone!
Now, some of that growth in returns is because you keep depositing $10,000 into the market each year. But a lot of the growth comes from your returns in the stock market compounding year after year. This is especially true in the later years where your annual $10,000 deposits are small compared to your total account balance.
Here?s another way to think about it:
You know how sometimes people say if you?re really rich you can just live off the interest of your savings? The idea here is that you could put your $100,000,000 in the bank at a measly 3% interest rate and collect $3,000,000 per year!
It?s the same concept here:
The more you have invested, the more money you will earn when your stocks go up or your dividends pay out.
And yes, the same concept applies to dividend payments. If you earn a 4% dividend yield on a stock, that payment will be a lot more money if your account size is bigger.
Also, this is mathematical proof that ?the rich get richer.?
But it?s also an important lesson:
One of the most powerful ways to grow your wealth is to have more of it.
Because the more you have, the faster it grows. That?s why some of the greatest investors in the world (such as Warren Buffett) are also obsessive savers. Every dollar you save and invest today could be worth $5, $10, $20, or even $50 in the future. All because it will be compounded over time.
OK, so how do you get that much money? There are many ways, but one way is time. Almost any amount of money compounded over long periods of time will eventually grow to an enormous amount.
Another way to look at it is through this classic investing example from J.P. Morgan which is meant to encourage people to save for retirement.
To quote J.P. Morgan (emphasis added):
?The chart below illustrates the power of saving early and compounding. Susan starts saving $5,000 a year at age 25 and stops at 35. Bill starts investing $5,000 annually at age 35 and continues to age 65. Even though Bill invests a total of three times more than Susan, he ends up with less in his account at age 65. By comparison, Chris contributes $5,000 a year consistently from age 25 through age 65 and, by starting to save 10 years earlier than Bill, Chris retired with more than twice the amount of Bill, despite investing only one-third more.?
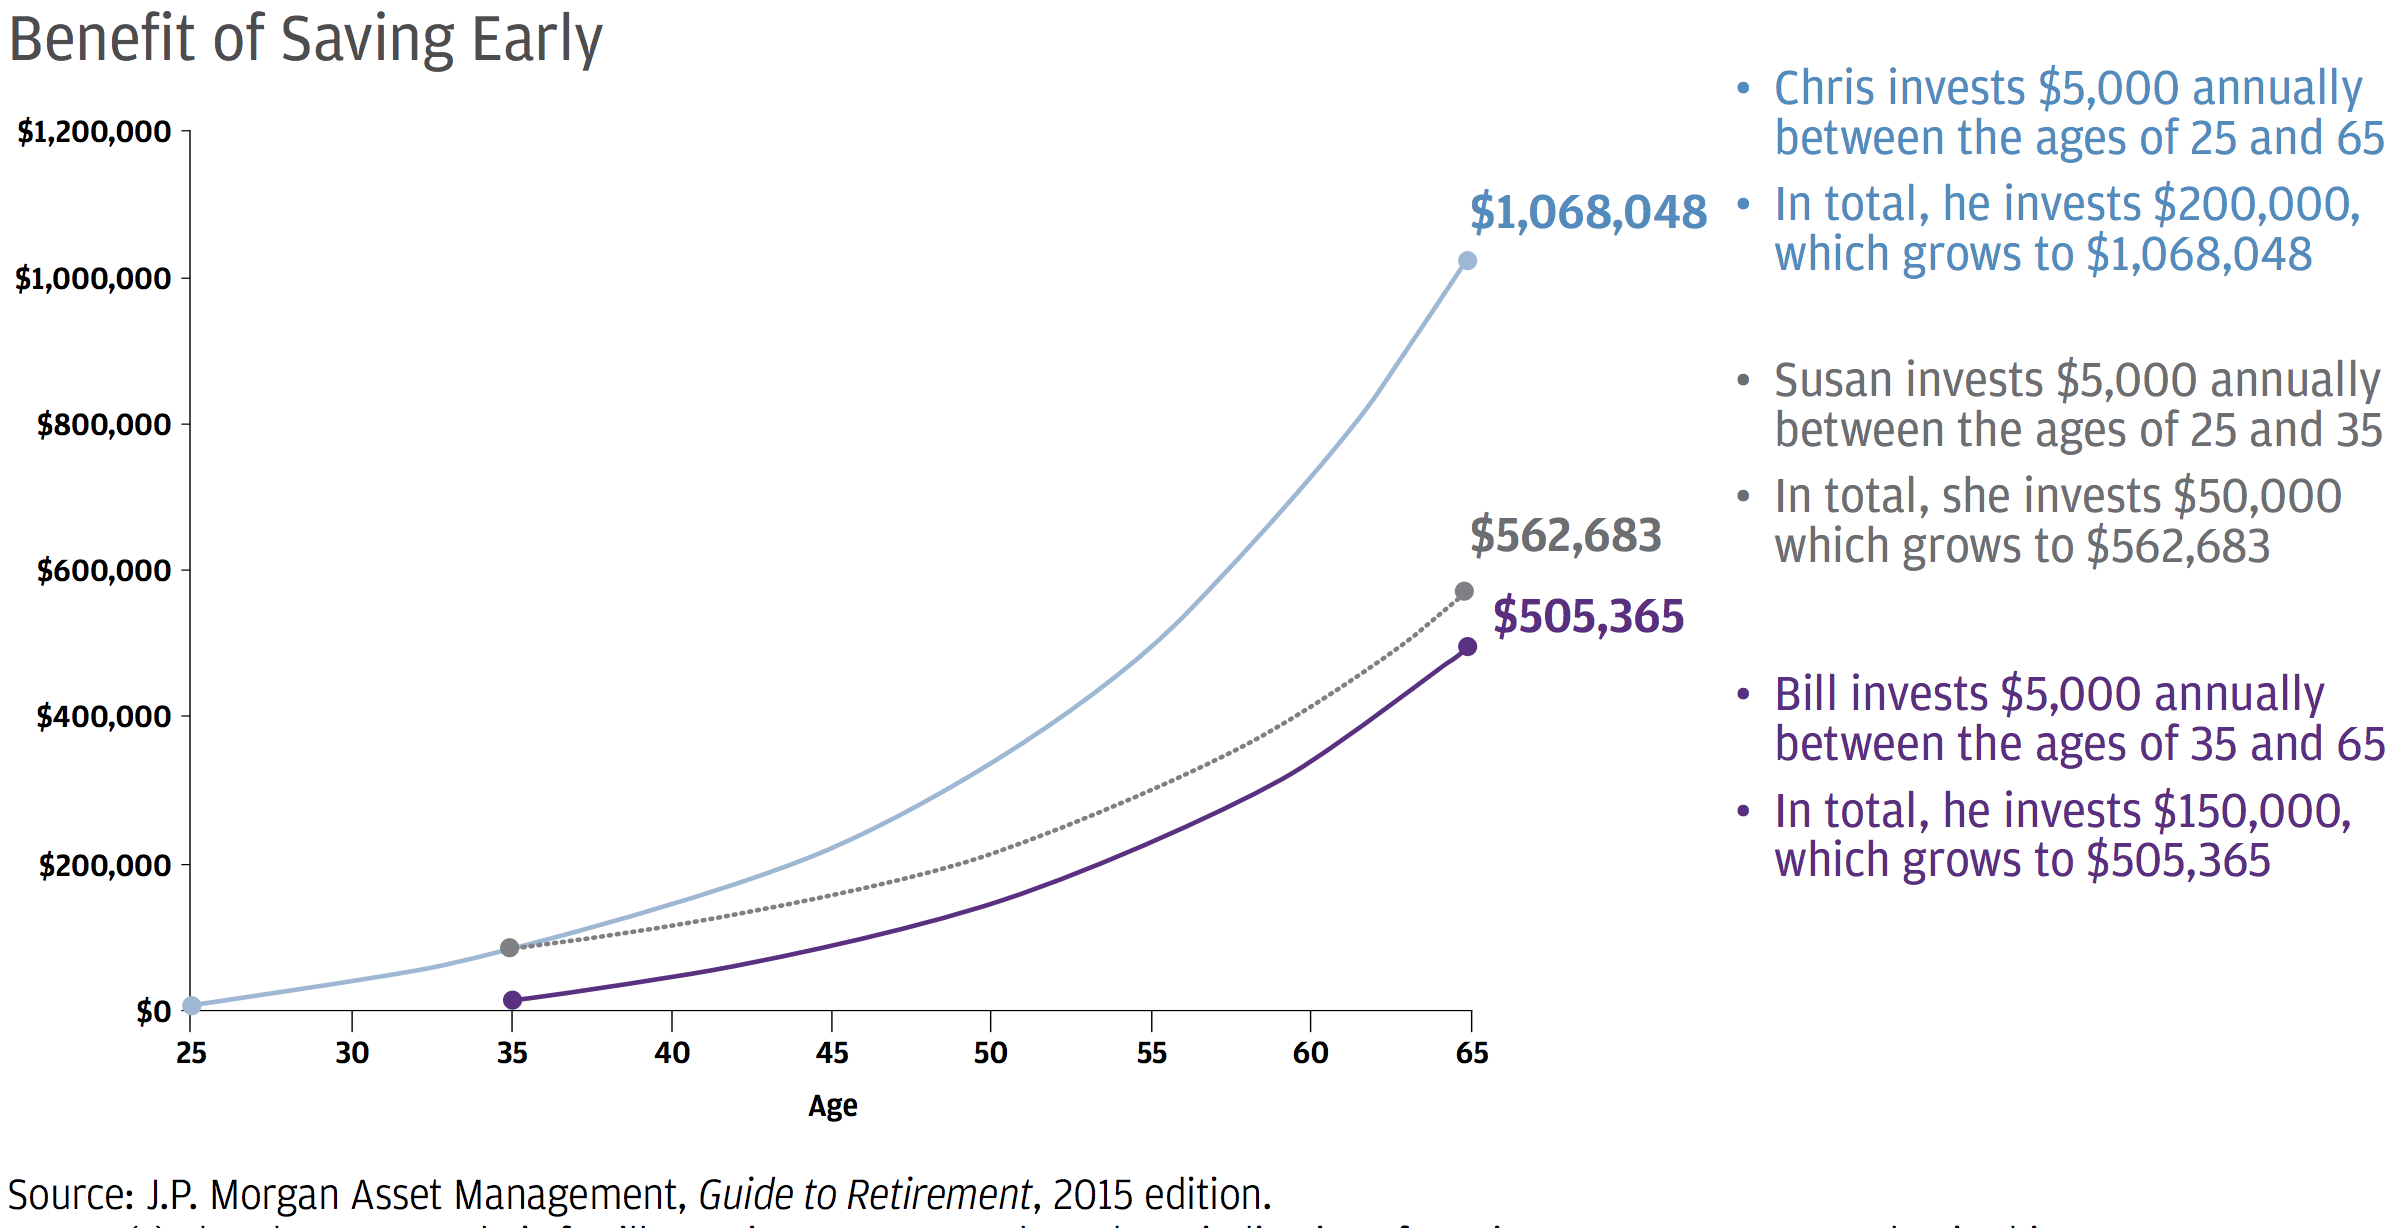
It?s the same concept. Because Susan started 10 years earlier than Bill, she ends up with more money even though he invested three times as much.
The simple lesson is that long periods of time invested in the stock market can do incredible things for your account balance.
But there?s another way to grow your wealth, in addition to being invested for long periods of time: improve your annual returns in the stock market.
The Power of Compounding High Stock Returns
Let?s look back at our first example, where you invest $10,000 into the stock market every year for 30 years at a 7% return per year. In that scenario, we saw you end up with $1,010,730 after 30 years.
Now, what if you achieve on the higher end of stock market returns? Let?s say you earn 10% returns per year instead of 7%.
We?ll keep everything else the same (investing $10,000 per year for 30 years) but at 10% annual returns.
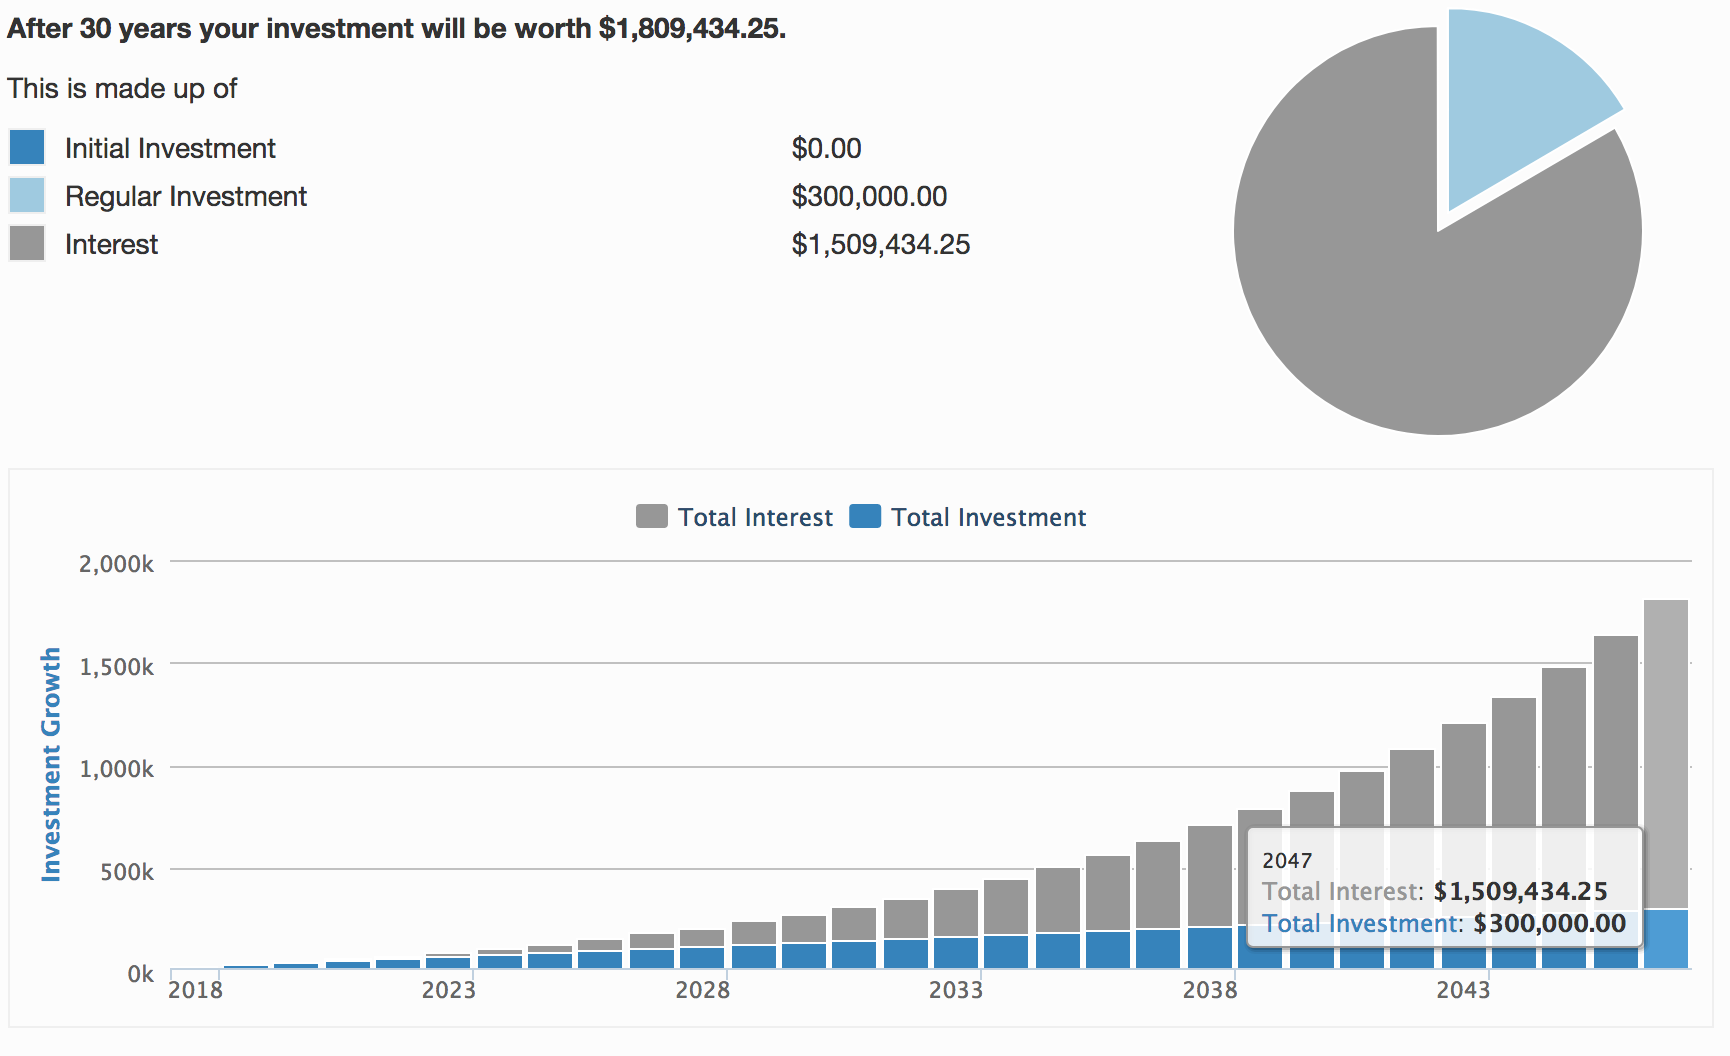
The difference is incredible. After 30 years, you now have $1,809,434 instead of $1,010,730. That little 3% per year improvement in performance results in a difference of nearly $800,000 over 30 years.
Put another way, your three percentage-point improvement in annual returns means you end up with roughly 80% more money after 30 years.
If we run the same scenario for the full 60 years, your previous ending balance of $8,704,668 now becomes an astounding $33,382,980.
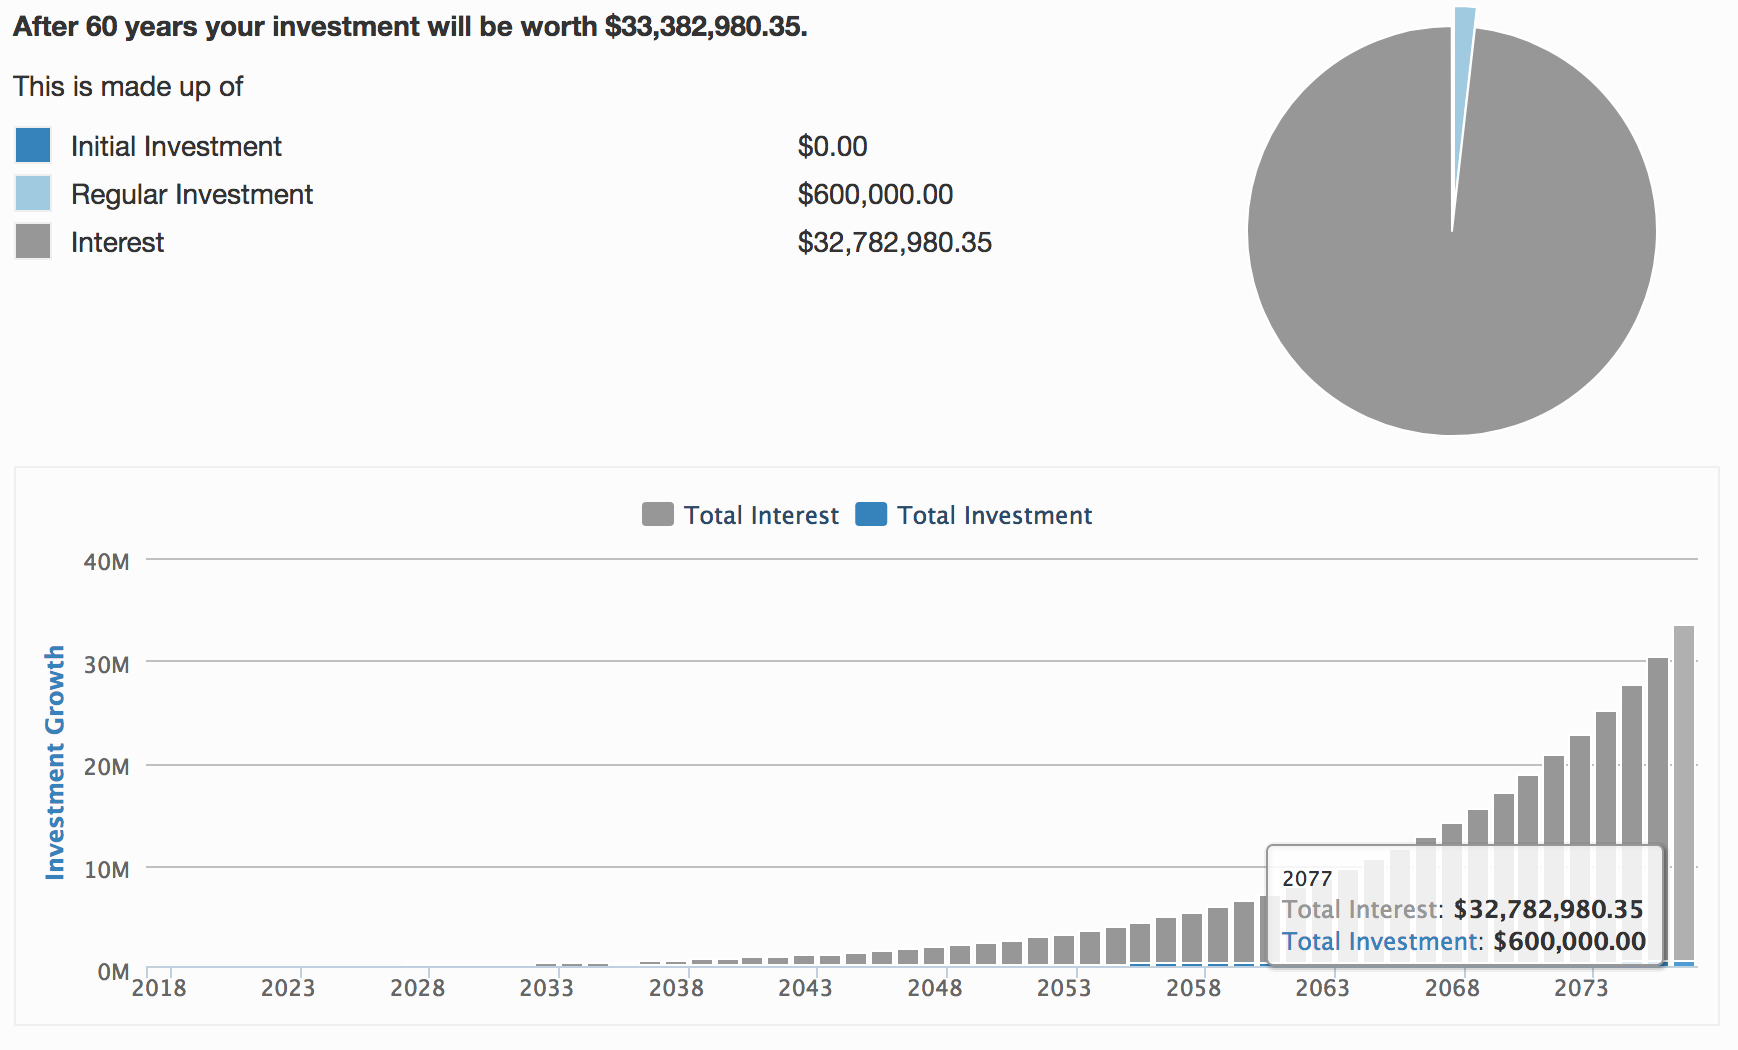
That?s right. A measly three percentage point better return each year for 60 years adds an additional $25 million to your account. Put differently, that little 3% boost resulted in nearly 4x as much money after 60 years.
How is that possible? The power of compounding.
You can see a simplified version of the concept using this compound interest table from The Balance.
Rather than saving $10,000 per year as we assumed, this table looks at a single lump sum of $10,000 invested at different return rates over different periods of time.
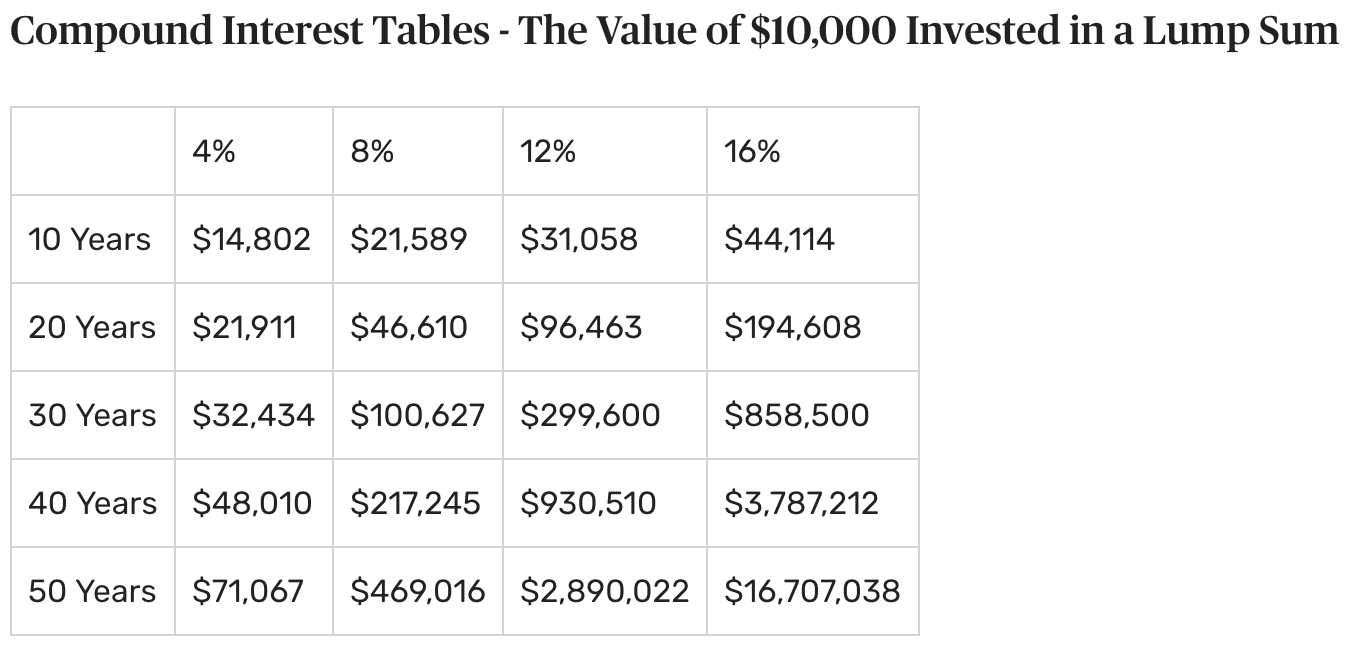
Again, we see the higher the growth rate and the longer the time, the more money you will make.
Little differences in annual performance add up to huge differences in wealth over time.
This is also why minimizing the taxes you pay on your investing profits (or avoiding taxes altogether with a tax-free account) can have an enormous impact on how much your money grows.
Every time you pay taxes on your investing profits, it reduces the amount of money in your account which weakens the magic power of compounding.
If you want to figure out how much you personally could make in the stock market, experiment with the free compound interest calculator over at Calculate Stuff.
Ask yourself these three key questions:
- How much can I set aside to invest each year?
- How well will my stocks perform each year? Within the usual 7% ? 10% range? Above? Below?
- How long will I invest for without pulling money out of the account?
Stocks and Compound Interest ? 5 Big Lessons
Compound interest is truly magical. It?s why Einstein (one of the smartest men to ever live) said:
?Compound interest is the eighth wonder of the world. He who understands it earns it. He who doesn?t pays it.?

When it comes to the power of compound returns in the stock market, there are five very important takeaways:
- The longer you?re invested in the market, the more your money will grow.
- The higher your annual investing returns, the more your money will grow.
- Small improvements in your investment returns can make a HUGE difference in your wealth over time.
- The more you can avoid paying taxes on your investment gains, the more your money will grow.
- Solid stock investment returns compounded over long periods of time create almost magical amounts of wealth.
Do you hear that sound?
That?s your future self begging you to start investing well today.
How Much Can You Profit with Stocks? ? 10 Big Lessons
Wow, we covered a lot there! Let?s step back and sum up the most important takeaways from this lesson.
You asked, ?How much money can I make investing in stocks?? Here are 10 simple lessons to keep in mind:
- Stocks generally return 7?10% per year over long periods of time.
- In any given year, they could do far better or far worse than that.
- Over longer stretches of time (10?15+ years), the market almost always makes money.
- Pay attention to dividend stocks, because roughly 40% of the stock market?s gains tend to come from dividends (although it varies over time).
- Individual investors may do far better or (more commonly) far worse than the market, depending on how good they are at investing and whether they avoid common mistakes.
- The longer you?re invested in the market, the more your money will grow.
- The higher your annual investing returns, the more your money will grow.
- Small improvements in your investing returns can make a huge difference in your wealth over time.
- The more you can avoid paying taxes on your investing gains, the more your money will grow.
- Solid stock investment returns compounded over long periods of time create almost magical amounts of wealth.
Disclaimer: This article is provided for informational or educational purposes only and is not any form of individualized advice. All information is obtained from sources believed to be reliable but cannot be guaranteed for accuracy or completeness. Use this information at your own risk.

