For today?s post, I?ll be taking a few moments to discuss Windows Prefetch. But first, a quick plug for some upcoming training:
I?m currently preparing for an upcoming FOR508 class with Chad Tillbury at SANS Security East 2017. While it?s getting very close, we?re looking forward to an awesome class and finding the next team of lethal forensicators! If you?re attending, please drop me a line ahead of time. If you want to attend, I believe registration is still open! Also during the event, on Wednesday, January 11th, I?ll be giving a SANS@Night talk called Zero In on the Artifacts That Matter. Preparing for that talk was the inspiration for today?s post, as prefetch will certainly get a mention.
Windows Prefetch
I?ve said it before and I?ll say it again ? many artifacts that we love in the DFIR world are actually byproducts of the operating system trying to make life easier and/or more efficient for the user or developers. In my opinion, prefetch also falls within this category.
Prefetch has been around since Windows XP. It was originally designed to help speed up system boot and application launches. The goal of prefetch is to analyze and record the startup behavior of applications upon execution to make future startups more efficient. This data is recorded for up to 10 seconds after the application startup. The recorded application behavior is saved to a trace file ? what we call the prefetch file ? in the path C:WindowsPrefetch.
Prefetch Files
As mentioned above, prefetch files are found in the static directory C:WindowsPrefetch. Prefetch files have a .pf extension and follow a standard naming convention:
<APPLICATION NAME IN ALL CAPS>-<EIGHT CHARACTER HASH OF APPLICATION LOCATION>.pf
Prefetch files contain the following metadata:
- The name of the corresponding executable
- The number of times the executable has been run
- The size of the prefetch file
- The files and directories that were referenced during the application startup (this is what Windows wants to trace)
- Information related to the volume that the executable is on, including the volume path and serial number.
Here?s a sample of some prefetch files from my test host:
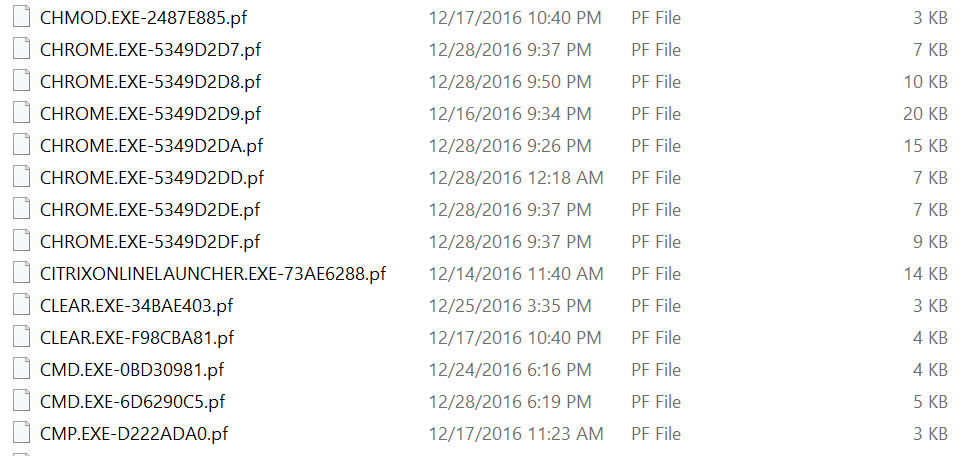 Screenshot Prefetch folder from a Windows 10 Test Host
Note that I?ve got several applications with the same name, but a different location. That is evidence by the somewhat-similar hashes, and in many application?s cases, is likely indicative of a software update or folder structure change.
EDIT: Thanks to Eric Zimmerman for reminding me that prefetch file names are also dependent on command-line arguments and case sensitive, despite the lack of case sensitivity in the trace file. Hexacorn covers the hashing algorithm in detail here, and I?d recommend you check it out if you?re needing to do this level of prefetch analysis.
Parsing the Prefetch File
The structure for Prefetch files is actually quite well-known and there are multiple parsing options available. Here are a few options:
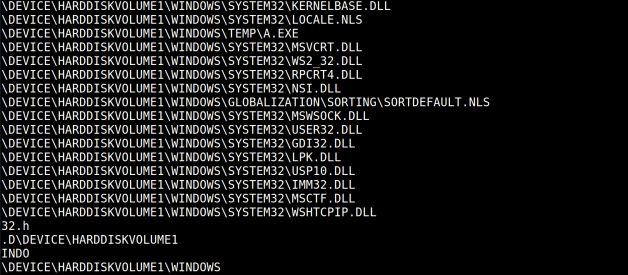
- If worse comes to worse, we can use strings to gain some information about prefetch trace information. Here?s an example of enumerating Unicode strings from a suspicious executable:
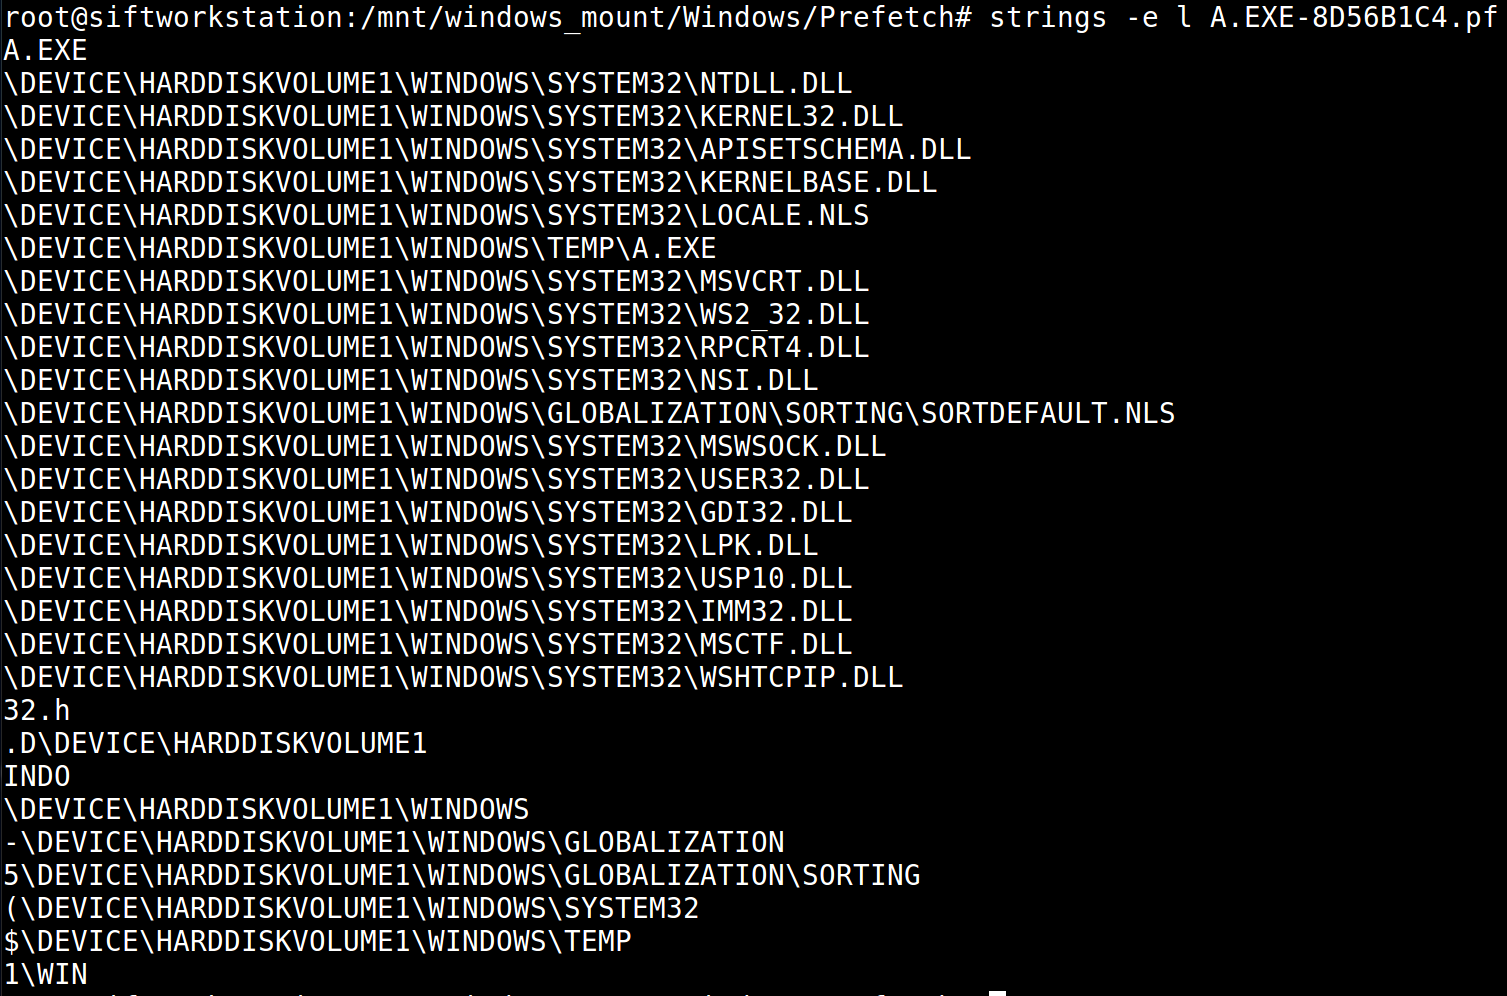 Screenshot of strings from a prefetch file for A.EXE
- Eric Zimmerman maintains his tool PECmd, currently at version 0.7.2.0. It can be downloaded here.
- log2timeline/Plaso contains a prefetch parser, and can put key data from the prefetch files into a timeline format.
- TZWorks also publishes a really helpful and handy prefetch parser pf. You can view more information about it here. Here?s an example of TZWorks? pf tool output:
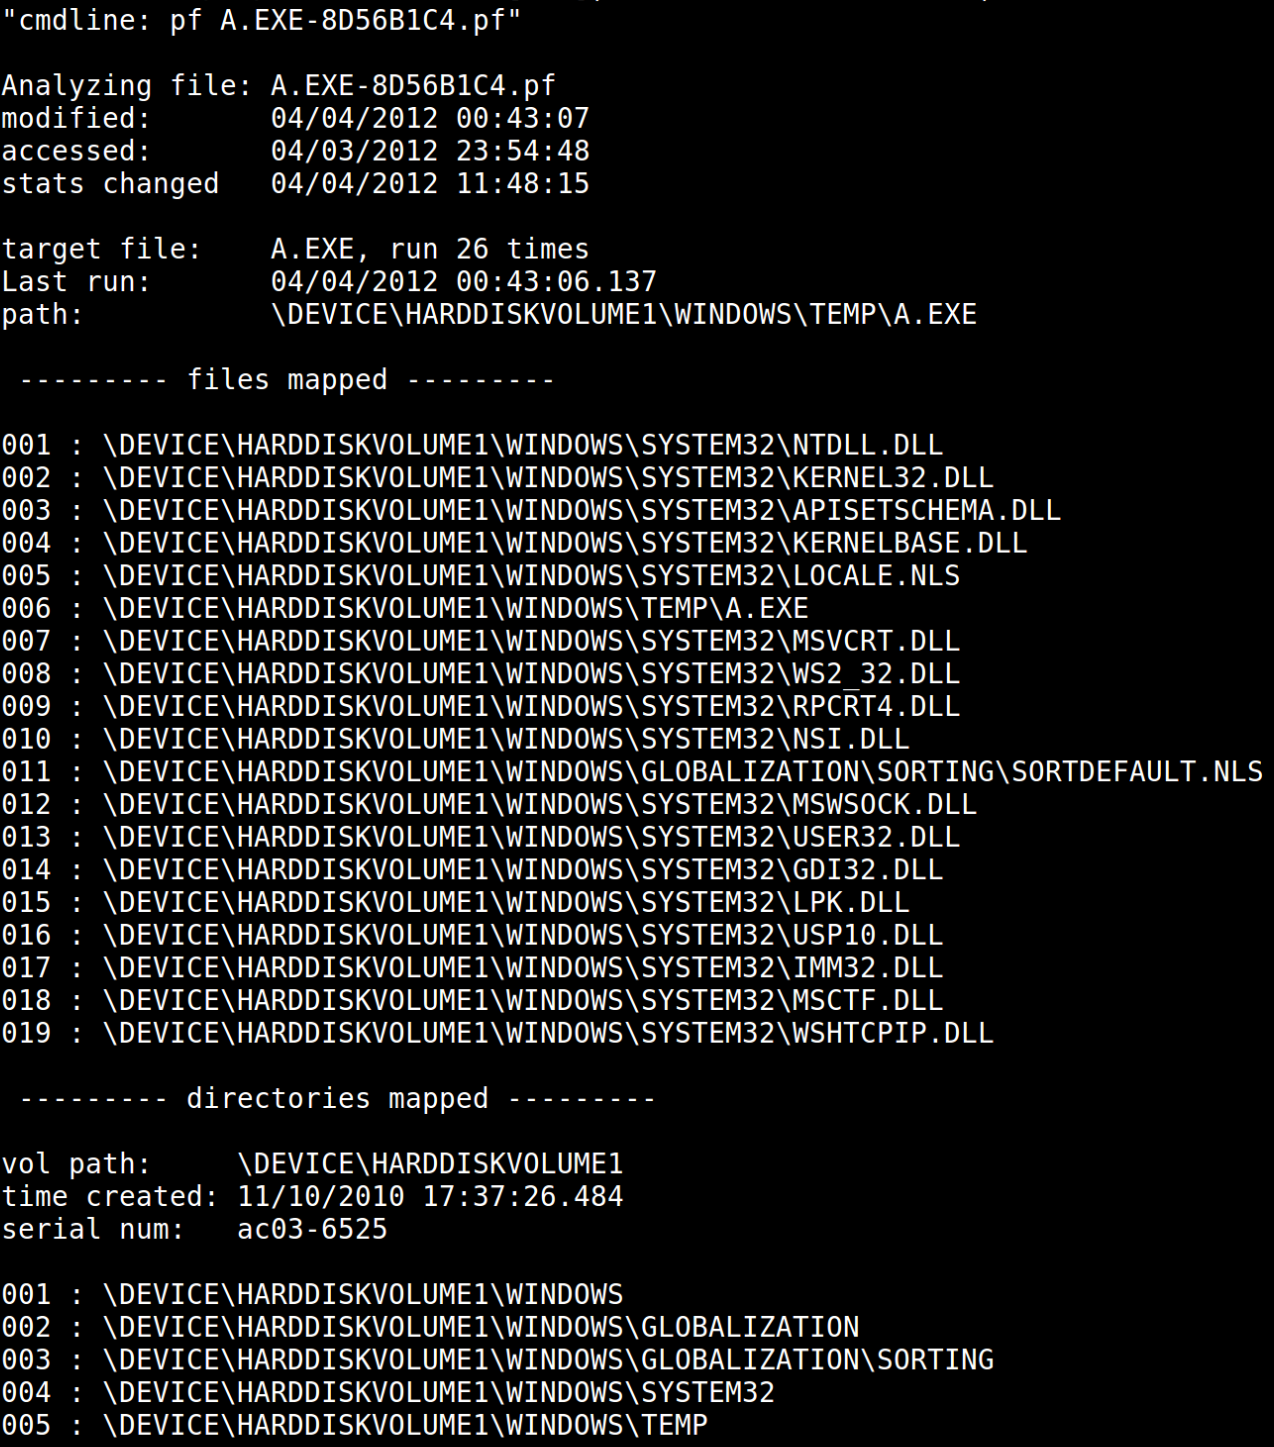 Screenshot of TZWorks? pf output for a prefetch file
I?ll address some of the forensic artifacts within this output in the next section, but notice how we now get contextual information, times executed, and important timestamps.
Another important note about parsing prefetch files is that newer prefetch versions, namely Windows 10, use a new compression format that doesn?t play well with parsers for previous versions. Make sure your tool can handle Windows 10 artifacts ? or go find a new script ? before assuming that files may be corrupted.
How to Use in DFIR
DFIR analysts need to be aware of prefetch because it contains a lot of forensic value. Here are a few ways I?ve used prefetch in the past:
- The run count can be an important tell as to how long malware may have been on a system or how frequently it is/was used. If you have only seen evidence of two malware executions, but prefetch shows dozens, then there is some more digging to be done.
- The timestamps of the prefetch file also tell us volumes. Think about the following: What creates a prefetch file, and what modifies a prefetch file? Turn those actions into timestamps, and we can determine the following: The creation timestamp of a prefetch file is the first time the application was executed, and the last modified time of a prefetch file is the last time it was executed. Let?s look again at the screenshot from above:
Screenshot of TZWorks? pf output for a prefetch file
Notice our last run time (2012?04?04 00:43:06.137) and the modified time: (2012?04?04 00:43:07). Now, we can hope very quickly through Prefetch files, without needing to parse, and find our last execution times.
You can utilize the timestamps in other means as well. For example, consider viewing the creation timestamps of all files from the prefetch folder. If we have any timeframes of interest, or prefetch files for known malware, look for other files with timestamps in a close temporal proximity.
- When analyzing prefetch files, especially ones related to known malware, take a look at the files mapped or loaded. You may find additional indicators.
- Additionally, examine the directories mapped from the prefetch file. You may find evidence of an external drive or previous partition.
- Do you see multiple prefetch files with different hashes at the end of the file? Remember, that hash is derived from the location ? you may have malware in multiple places.
- Lastly, don?t forget that Windows monitors application startup for up to 10 seconds. So, whilst we can rely on our prefetch file timestamps as pretty strong indicators, we must factor in the maximum ten second delay.
Going Beyond the Prefetch
In Windows Vista and beyond, Microsoft has continued to expand upon the prefetch with additional features such as SuperFetch, ReadyBoost, ReadyBoot, and ReadyDrive. I?ll be digging into these features in a later post.
Until tomorrow, Happy Forensicating!

![FINAL FANTASY TACTICS : WotL v2.1.0 Apk + Obb Data + Mod [Unlimited JP & Money] for Android](https://911weknow.com/wp-content/themes/mts_myblog/images/nothumb-myblog-related.png)