
Databases? Not very interesting.
So might an average person working with GIS or data visualizations think. I must admit that databases aren?t the sexiest thing in the world (sorry DBA?s), but if you are claiming (or aiming) to do analytics or visualization with (spatial) data in a more serious manner, you definitely shouldn?t ignore them. I hope this blog post can give you an idea what kind of benefits the efficient use of spatial databases could offer you.
Hype terms come and go in IT and there was a big hype around big data still just a few years ago, but that is now slowly fading away. Well, data is still big and actually it?s bigger than ever. File sizes grow and in ?data science? and geosciences people must deal with data that can easily be in the range of gigabytes. The bigger the data, more attention we need to pay to the way we store and analyze it.
That?s where a database comes in to the picture.
In software development working with databases is a must. But for people in other sub-domains of computer science (like GIS) the benefits of a database might not always be that obvious. Of course people tend to use the tools most familiar to them although it wouldn?t be the most efficient way to achieve goals. But sometimes stepping out of your comfort zone can really bring you big benefits. I have been myself slowly realizing the potential that lies in spatial SQL.
 A week of flights in Brazil. Original file was just a csv with origin and destination coordinates. I loaded the data to PostGIS, created point geometries from the coordinates, then created lines between the points and eventually visualized the data with QGIS Time Manager.
This blog post is mainly for people working with geospatial data, but haven?t touched PostGIS, or maybe haven?t even heard of it. I am not going to go through how to install PostgreSQL/PostGIS, but rather try and give you an overview of what it is and what is it good for.
My workflow and examples are mainly focusing on QGIS + PostGIS combination, but you should note that you can also work with only PostGIS, your own code or with some other GIS clients.
Post? what?
Already during my GIS studies I had heard the phrase ?PostGIS is a spatial extension of Postgres? multiple times. It didn?t mean that I had any idea what that means. I had no clue what is Postgres, let alone a spatial extension.
Let?s try to brake it down as simply as possible.
Some people might hate me for this comparison but I?ll take the risk: if you have never worked with databases, you can think of database tables as massive Excel sheets. But a massive intelligent Excel sheet from where you can in a millisecond find out what value is on the third column on row number 433 285. And instead of writing functions inside the sheet to a single cell, you write them to your SQL command window. So a place to store data and from where you can get it out efficiently.
PostGIS is an open source, freely available spatial database extender for the PostgreSQL Database Management System (a.k.a DBMS). So PostgreSQL (a.k.a. Postgres) is THE database and PostGIS is like an add-on to that database. The latest release version of PostGIS now comes packaged with PostgreSQL.
In a nutshell PostGIS adds spatial functions such as distance, area, union, intersection, and specialty geometry data types to PostgreSQL.Spatial databases store and manipulate spatial objects like any other object in the database.
So in a normal database you store data of different types (numeric, text, timestamps, images?) and when needed you can query (fetch) that to answer questions with your data. The questions can be about ?how many people logged on to your website? or ?how many transactions have been made in an online store?. Spatial functions can instead answer questions like ?how close is the nearest shop?, ?is this point inside this area? or ?what is the size of this country?.
So the data is stored in rows and columns. Because PostGIS is a spatial database, the data also has a geometry column with data in a specific coordinate system defined by spatial reference identifier (SRID). But remember that although you would be using PostGIS mainly for spatial data, it is also possible to store non-spatial data in there, as it still has all the functionalities of a normal PostgreSQL database!
 That?s a database. In IT architecture a database is represented as a cylinder. It?s a place where you can store your data.
The excellent Boundless PostGIS intro, introduces three core concepts that associate spatial data with a database. Combined these provide a flexible structure for optimized performance and analysis.
- Spatial data types such as point, line, and polygon. Familiar to most working with spatial data;
- Multi-dimensional spatial indexing is used for efficient processing of spatial operations;
- Spatial functions, posed in SQL, are for querying of spatial properties and relationships.
SQL, or ?Structured Query Language?, is a means of asking questions of, and updating data in, relational databases. A select query (which you use to ask the questions) is generally a command of the following form
SELECT some_columns FROM some_data_source WHERE some_condition;
PostGIS specific functions are usually in the form of ST_functionName.
You write these commands on the command line after logging in to your database or in your database GUI tool (e.g. pgAdmin or QGIS DB Manager). So yes, SQL requires you to really write something. Right-clicking might be underrated in general, but for someone who doesn?t write any code, SQL is a good first step to write your own commands and maybe later code.
There are also other spatial databases besides PostGIS. SQL Server Spatial, ESRI ArcSDE, Oracle Spatial, and GeoMesa are a few other options for managing and analyzing spatial data. But PostGIS is said to have more functionalities and generally better performance. Also the others mentioned (except GeoMesa) are not open source.
If you are new to this, now you might be confused: so it?s a place to store data and you have to get information out in a complex way by writing some weird stuff on the command line? Wait for it. There are also some real benefits that PostGIS can offer you if you really commit to it.
I asked some ideas for the blog post from Twitter and got a lot of good feedback. From there I got the idea of splitting this in to two parts. In the first part I will look in to the benefits that PostGIS can bring to your daily work. In the second part I will focus more on spatial SQL.
Part 1: A new way of working
PostGIS can enable you to adopt a new way of working. This new way can be more easily reproducible, you can start using version control more easily and it can enable multi-user workflows.
Files often require special software to read and write. SQL is an abstraction for random data access and analysis. Without that abstraction, you will either need a specific software to do the operations or need to write all the access and analysis code yourself.
Doing your analysis in SQL rather than just doing random operations for files with some random tools with random parameters, allows you to share and reproduce your results more easily. You might have that one ?master Shapefile? currently somewhere, where you have made several spatial joins and clip operations to a Shapefile to get that to be like it?s supposed to be. What if that disappears?
Johnnie wrote a good example on Twitter on how he accidentally deleted all of his data, but was able to reproduce them with minimal effort with the SQL scripts he saved to GIT.
People working with software development are probably (or hopefully) familiar with version control. I?m not going to go more deeply in to that in this blog post, but you are able to (and you should) have your SQL scripts in a version control system, like GIT. Think of it as a cookbook that you keep in your bookshelf and constantly update to always find the best recipes for tasty data analysis. Only that you can buy a new copy of this exact cookbook from Amazon again if your house burns down.
A database can also help you to keep your spatial data in better order. None of us is really perfect and probably you will still create tables like temp_1, final_final, but still a database offers better opportunity for you to standardize your data structure than just files (e.g. by standardizing the data types in your tables).
And what about those big datasets? With a spatial database working with large datasets becomes possible. Not only easier, but sometimes it?s almost impossible to work on larger datasets without a database. Have you ever tried to open 2 gb csv file? Or tried to do some geoprocessing for a 800 mb GeoJSON? Did you even know that Shapefiles have a size limit? Of course you can tackle some of these issues by using Geopackage or some other file formats, but in general PostGIS is the optimal tool for handling big (geospatial) data.
 22 million points of ship GPS locations rendered from PostGIS with QGIS. Can you see where the ships are moving on rivers and where they are at open sea?
One very nice feature with databases is that you can more easily automate processes that you normally do manually. For instance by using the PostgreSQL NOTIFY feature, you can update your QGIS maps automatically. Also if you are working with ETL tools (e.g. FME) to automate your work, reading/writing from/to PostGIS tables is much easier than with files.
If you are not like me (I currently do this stuff on my own and for fun), you might have a thing called a team. Also known as co-workers. They might have the need to access the same data as you. Using a database in your workflow enables parallel working completely on a different level than just having files on a shared drive.
One main reason for this is that concurrent users can cause corruption. While it?s possible to write extra code to ensure that multiple writes to the same file do not corrupt the data, by the time you have solved the problem and also solved the associated performance problem, you would?ve written the better part of a database system.
Of course there are both pros and cons in adopting a new workflow. Just like keeping your files in order, at the end of the day, also maintaining a database can be a lot of work. For example updating your PostGIS to a new version can be a real pain, as it was pointed out on Twitter. With great power comes great responsibility.
But let?s talk more about that power part.
Part 2: The magical world of spatial SQL
Spatial SQL can really speed up your processing (when used wisely). Below is a comparison between doing the same process with a Shapefile and QGIS processing and then in PostGIS with ST_GeneratePoints.
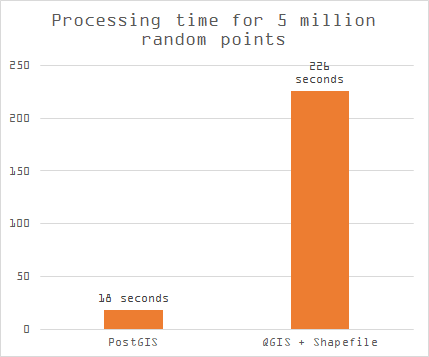 A database related blog post always has to have a barchart comparing processing times. PostGIS = very fast. Barcharts don?t lie.
For this comparison I had postal code data from Finland and the population in each postal code area. I had this both as a Shapefile and a table in my local database. I created random points inside each polygon to represent population. I used the QGIS processing (Random points inside polygon from Vector Processing) for the Shapefile and in PostGIS the SQL was really as simple as this:
SELECT ST_GeneratePoints(geom, he_vakiy) from paavo.paavo
As you can see from the graph earlier, it took PostGIS less than 10 % of the time to do the same analysis compared to QGIS and a Shapefile. If you are a GIS analyst and do processes like this every day, that can save you quite a lot of time in a year.
Besides faster processing, you can enjoy the vast selection of spatial functions PostGIS has to offer. Which functions are most useful to you depend totally on the use case. In addition to the Voronoi analysis and more traditional GIS analysis (buffer, overlay, intersect, clip etc..) you can do more advanced things:
- Routing. With pgRouting and road data you can find optimal routes and do different network analytics;
- Polygon skeletonization. This function enables you to build the medial axis of a polygon on the fly;
- Geometry subdivision. Dividing your geometries for further processing can significantly speed up your processes;
- Clustering. Find clusters and patterns from your data. With the AI hype at peak, the k-means might be even more interesting for some than before?
What do you need stuff like polygon skeletonization for? Might be a valid question for most, but that one time when your spatial analysis needs it, you will be extremely delighted that someone has done the hard work (=math) for you. Combining different spatial functions together and using the Postgres built-in functions with them will allow you to do advanced spatial analysis in your database.
Complicated and interesting questions (spatial joins, aggregations, etc) that are expressible in one line of SQL in the database require a lot of computational power and that is something that PostGIS offers you. Answering the same questions with your own code, might take hundreds of lines of specialized code to answer when programming against files.
PostGIS for dataviz
In many of the visualizations I have in my portfolio, PostGIS has played some kind of a role in the visualization process. In my workflow most often I pre-process the data and then do the actual visualization in QGIS.
Let?s see an example of one of those processes.
 Train voronoi lines. Oddly satisfying.
Animation about trains and voronois above give a playful example of power of PostGIS. I had a few million train GPS points in my local database and I had already created animations with the points just moving. But I wanted to test out how an animation with Voronoi lines would look like.
First because I had several GPS points for each train per minute, I wanted to group them so that I?d have one representative point for each minute per train. I had first created a table manually for the resulting points. I wrote the following query
INSERT INTO trains.voronoipoints SELECT ‘2018?01?15 09:00:00’ AS t, geom FROM (SELECT St_centroid(St_collect(geom)) AS geom, trainno FROM (SELECT geom, trainno FROM trains.week WHERE time > ‘2018?01?15 09:00:00’ AND time < ‘2018?01?15 09:01:00’) AS a GROUP BY trainno) AS b
If we brake down the query in pieces we can see the following pieces of the puzzle:
- You can see some of the normal elements of a SQL query (INSERT INTO, SELECT, AS, FROM, WHERE, AND, GROUP BY)
- geom, trainno and time are column names in my week table in the schema called trains
- The subquery a returns all GPS points which have been tracked within the requested timeframe.
- Because I select all GPS points tracked inside one minute, I might get several points for each train. I only wanted one, so that the voronoi lines would look more sensible. That?s why I use ST_Collect to group the points together and to create a multipoint geometry from them. ST_Centroid replaces the multipoint geometry with a single point located at the centroid (subquery b) and the data is grouped by train numbers.
To do the same thing multiple times, I had a simple Python script to loop over the same query for a few hundred times where I had the start and end times as parameters. After successfully finding one representative point for each minute, I just ran the following command (in 11.5 seconds):
SELECT t, ST_VoronoiLines(geom) from trains.voronoipoints
Then I added the result to QGIS and visualized it with Time Manager. This might be a bit hacky way to achieve the result and a more experienced SQL user might?ve done it completely with a single SQL command, but I?m still pretty happy with the result. Although it might be pointless.
Eventually pretty simple, but the result looks like higher level math (and it is!), as all the hard work is done by PostGIS. Also because I was able to make the Voronoi analysis for only one point per train, the processing time was only seconds for hundreds of thousands of points.
Often the processing time of your queries grows exponentially as the data amounts grow. This is why you have to be smart with your queries.
 Hey look! I made a SQL meme!
As a rule of thumb, the more data a query has to fetch and more operations the database has to do (ordering, grouping etc), it becomes slower and thus less efficient. An efficient SQL query only fetches the rows and columns it really needs. SQL can work like a logical puzzle, where you really have to think thoroughly what you want to achieve.
I must also note that tweaking the performance of your queries is a slippery slope and you can get lost in the world of endless optimization. Finding the balance between an ?optimal query? and an optimal query is really important. Especially if you are not building an application for a million users, a few milliseconds here or there won?t probably rock your boat.
How to get started?
I dare to say that learning SQL is even more beneficial for an average GIS user than learning JavaScript, Python or R. SQL syntax has had only minor changes over the years and SQL skills are very well transferable.
I have found that the learning curve in SQL isn?t really steep to do the basics, but it might take you some time to really see the benefits that it can bring to your spatial analysis. But I encourage to be patient and try more complicated analytics and aim for faster processing. Eventually you will see the difference.
First when you are learning SQL basics you will learn how to query data from a single table using basic data selection techniques such as selecting columns, sorting result set, and filtering rows. Then, you will learn about the advanced queries such as joining multiple tables, using set operations, and constructing a subquery. Finally, you will learn how to manage database tables such as creating new a table or modifying an existing table?s structure.
But there also also tools to help you out!
QGIS has a great tool called DB Manager. It offers a similar GUI for your database, but in a much more compressed way and inside QGIS. You can modify and add tables, add indexes and do a lot of the basic operations in a right-clickable manner.
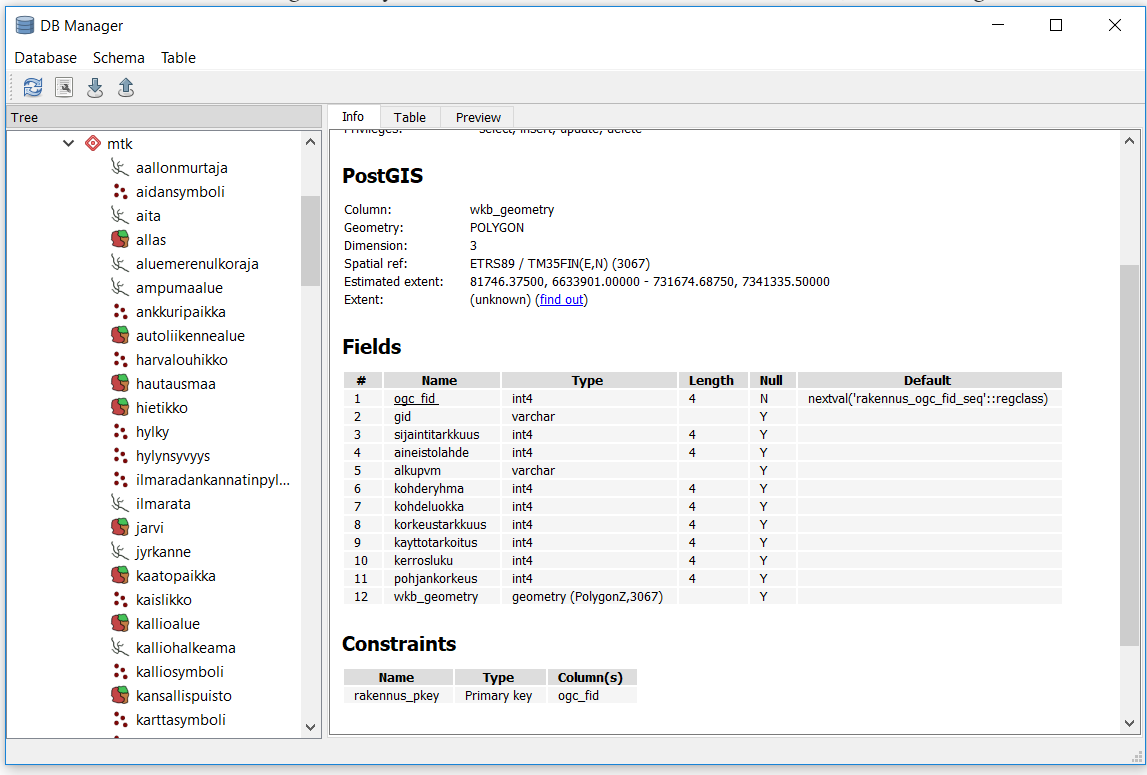 A screenshot from QGIS DB Manager.
You should also check pgAdmin, which is the most popular administration and development platform for PostgreSQL. There are multiple ways to get your data in to PostGIS (e.g. ogr2ogr, shp2pgsql). In general I encourage to try out different tools and methods of working with the data.
I have done a few small experiments in combining Python and PostGIS. Working with Python (or R) and PostGIS together can really take your data processing and automation to the next level. Just combining basic scripting capabilities of Python and connecting to PostGIS using psycopg2 are good ways to get started.
Do you feel like you want to get started with PostGIS?
- Just download the installers and install PostGIS on your local machine. Follow the instructions in the tutorials;
- Load some data in there. Start with a single Shapefile using QGIS DB Manager or chech for example this tutorial on how to get Natural Earth data to PostGIS;
- Start playing around with SQL. Start with the basics (selecting, filtering and modifying the data) and slowly you will see what kind of benefits it could bring in to your workflow.
Conclusions
If your way of working is currently inefficient, just changing your tools won?t make your outcome any better or the process less painful. You need to change the way you think about data management. There are numerous ways to use databases inefficiently. Trust me, I have seen them and even tried a few.
Also changing things just for the sake of change, doesn?t make sense. If your daily work is just plotting a few dots on a map every now and then, you can very do that with Shapefiles and csv files also in the future. Might even be more efficient that way.
BUT.
If you do want to do some serious spatial analytics, automate your processes or in any way move your way of working with spatal data to the next level, I can strongly recommend to get familiar with PostGIS and especially spatial SQL. Learning SQL can also be fun. Seriously.
Last but definitely not least. As Tom pointed out: using PostGIS gives you geohipster cred!
 I had New York bikeshare data with start and end points. With GraphHopper I calculated the optimal routes between the origin and the destination, I loaded thousands of resulting gpx files to PostGIS with ogr2ogr. In PostGIS I created lines from the points and visualized the data with QGIS.
One thing that I mentioned only briefly was that PostGIS is open source and freely available. This means that people working with small or no budget (like me) have no barrier of entry. Commercial spatial databases can be hugely expensive. Big thanks goes to all of the active developers working on the project!
Thanks for reading! Check my website for more information about me or throw me a comment on Twitter.
Want to learn more? Sources for this blog post and further PostGIS reading
RTFD. The PostGIS documentation is really good.
PostGIS guru Paul Ramsey has several presentations on the topic from different point of view on his site
Great materials from Boundless on the introduction to PostGIS.
Anita Graser has written a terrific series of blog posts about handling movement data in PostGIS.
Check out the PostGIS books from Regina Obe
I used this Boston GIS tutorial when I first installed PostGIS locally
Extra for people doing dataviz: an interesting experiment about storing colors as 3D points in PostGIS
– ? ? ? ? ? ? ? ? ? ?
?On a side note, I recently started working at Gispo, a small Finnish IT company where among other things help our customers to use open geospatial data and open source geospatial solutions (including PostGIS consulting!). You can find more about me via Twitter or mywebsite.

