Evaluating a Machine Learning model can be quite tricky. Usually, we split the data set into training and testing sets and use the training set to train the model and testing set to test the model. We then evaluate the model performance based on an error metric to determine the accuracy of the model. This method however, is not very reliable as the accuracy obtained for one test set can be very different to the accuracy obtained for a different test set. K-fold Cross Validation(CV) provides a solution to this problem by dividing the data into folds and ensuring that each fold is used as a testing set at some point. This article will explain in simple terms what K-Fold CV is and how to use the sklearn library to perform K-Fold CV.
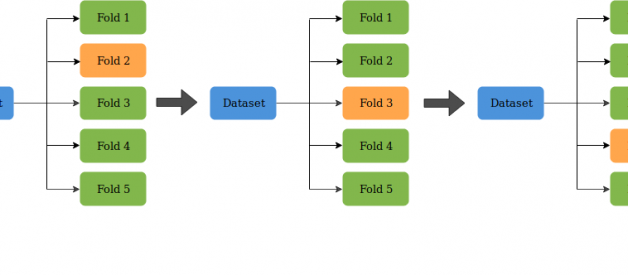
K-Fold CV is where a given data set is split into a K number of sections/folds where each fold is used as a testing set at some point. Lets take the scenario of 5-Fold cross validation(K=5). Here, the data set is split into 5 folds. In the first iteration, the first fold is used to test the model and the rest are used to train the model. In the second iteration, 2nd fold is used as the testing set while the rest serve as the training set. This process is repeated until each fold of the 5 folds have been used as the testing set.
 5-Fold Cross Validation
Evaluating a ML model using K-Fold CV
Lets evaluate a simple regression model using K-Fold CV. In this example, we will be performing 10-Fold cross validation using the RBF kernel of the SVR model(refer to this article to get started with model development using ML).
- Importing libraries
First, lets import the libraries needed to perform K-Fold CV on a simple ML model.
import pandasfrom sklearn.model_selection import KFoldfrom sklearn.preprocessing import MinMaxScalerfrom sklearn.svm import SVRimport numpy as np
Lets see what we have imported,
pandas ? Allows easy manipulation of data structures.
numpy ? Allows scientific computing.
sklearn ? A machine learning library for python.
2. Reading the data set
Now, lets read the data set we will be using, to a pandas data frame.
dataset = pandas.read_csv(‘housing.csv’)
We will be using the Boston House price data set which has 506 records, for this example.
3. Pre-processing
We will now specify the features and the output variable of our data set.
X = dataset.iloc[:, [0, 12]]y = dataset.iloc[:, 13]
The above code indicates that all the rows of column index 0-12 are considered as features and the column with the index 13 to be the dependent variable A.K.A the output. Now, lets apply the MinMax scaling pre-processing technique to normalize the data set.
scaler = MinMaxScaler(feature_range=(0, 1))X = scaler.fit_transform(X)
This technique re-scales the data between a specified range(in this case, between 0?1), to ensure that certain features do not affect the final prediction more than the other features.
4. K-Fold CV
Now, lets get down to business.
scores = best_svr = SVR(kernel=’rbf’)cv = KFold(n_splits=10, random_state=42, shuffle=False)for train_index, test_index in cv.split(X): print(“Train Index: “, train_index, “n”) print(“Test Index: “, test_index) X_train, X_test, y_train, y_test = X[train_index], X[test_index], y[train_index], y[test_index] best_svr.fit(X_train, y_train) scores.append(best_svr.score(X_test, y_test))
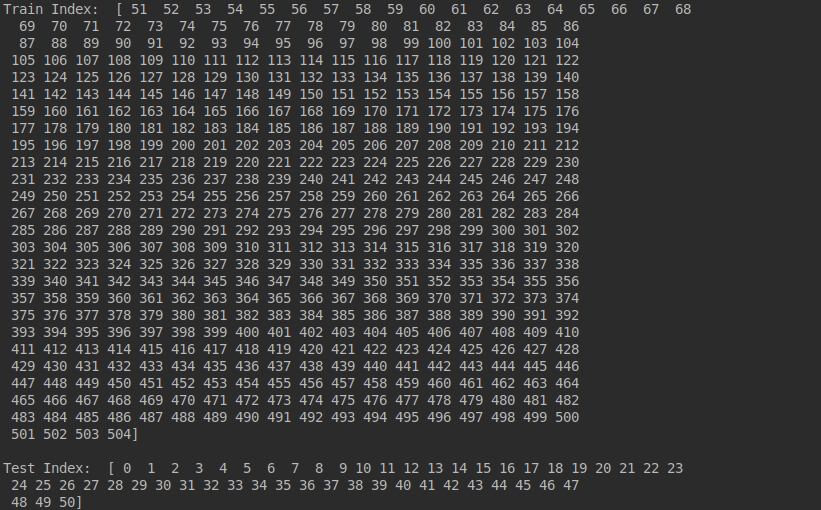
We are using the RBF kernel of the SVR model, implemented using the sklearn library (the default parameter values are used as the purpose of this article is to show how K-Fold cross validation works), for the evaluation purpose of this example. First, we indicate the number of folds we want our data set to be split into. Here, we have used 10-Fold CV (n_splits=10), where the data will be split into 10 folds. We are printing out the indexes of the training and the testing sets in each iteration to clearly see the process of K-Fold CV where the training and testing set changes in each iteration.
 Training and testing set in the first iteration of 10-Fold CV
Next, we specify the training and testing sets to be used in each iteration. For this, we use the indexes(train_index, test_index) specified in the K-Fold CV process. Then, we train the model in each iteration using the train_index of each iteration of the K-Fold process and append the error metric value to a list(scores ).
best_svr.fit(X_train, y_train) scores.append(best_svr.score(X_test, y_test))
The error metric computed using the best_svr.score() function is the r2 score. Each iteration of F-Fold CV provides an r2 score. We append each score to a list and get the mean value in order to determine the overall accuracy of the model.
print(np.mean(scores))
Instead of this somewhat tedious method, you can use either,
cross_val_score(best_svr, X, y, cv=10)
or,
cross_val_predict(best_svr, X, y, cv=10)
to do the same task of 10-Fold cross validation. The first method will give you a list of r2 scores and the second will give you a list of predictions.
I hope this article gave you a basic understanding about K-Fold Cross Validation. Until next time?Adios!
References


