How to use log transformation and how to interpret the coefficients of a regression model with log-transformed variables
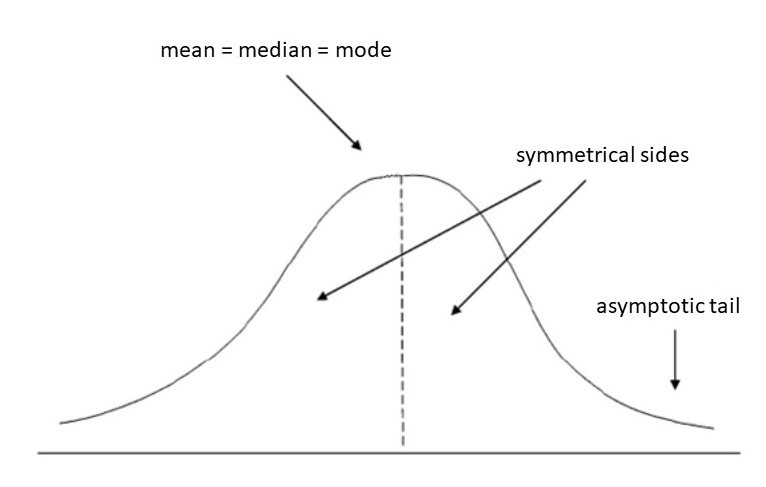
Before we get into log transformation, let?s quickly talk about normal distribution. Normal distribution is a probability and statistical concept widely used in scientific studies for its many benefits. Just to name a few of these benefits? normal distribution is simple. Its mean, median and mode have the same value and it can be defined with just two parameters: mean and variance. It also has important mathematical implications such as the Central Limit Theorem.
 Normal Distribution ? Source
Unfortunately, our real-life datasets do not always follow the normal distribution. They are often so skewed making the results of our statistical analyses invalid. That?s where Log Transformation comes in.
What is Logarithm?
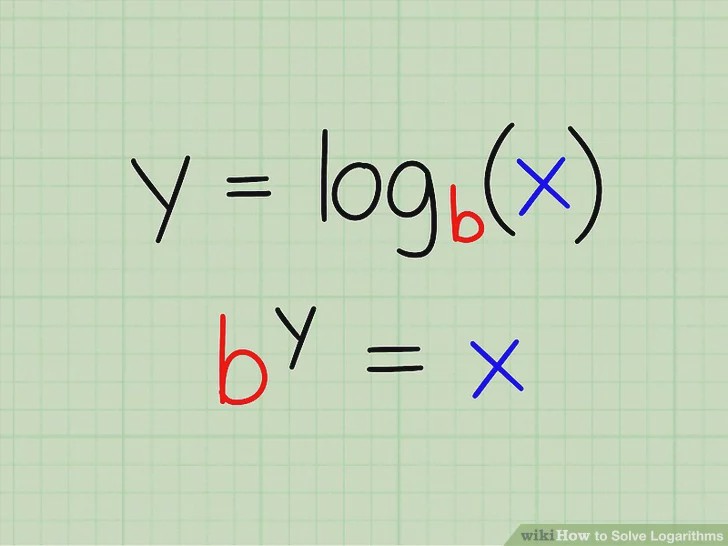
Logarithms are essential tools in statistical modeling and statistical analysis. A logarithm can be defined with respect to a base (b) where the base b-logarithm of X is equal to y because X equals to the b to the power of y (log(X) =y because X = b ?). You can take any positive number as the base of the logarithm but the most commonly used bases are ?
- Base 2 ? the base 2 logarithm of 8 is 3, because 2 = 8
- Base 10 ? the base 10 logarithm of 100 is 2, because 10 = 100
- Natural Log ? the base of the natural log is the mathematical constant ?e? or Euler?s number which is equal to 2.718282. So, the natural log of 7.389 is 2, because e = 7.389.
 Logarithm Formula ? Source
What is Log Transformation?
Log transformation is a data transformation method in which it replaces each variable x with a log(x). The choice of the logarithm base is usually left up to the analyst and it would depend on the purposes of statistical modeling. In this article, we will focus on the natural log transformation. The nature log is denoted as ln.
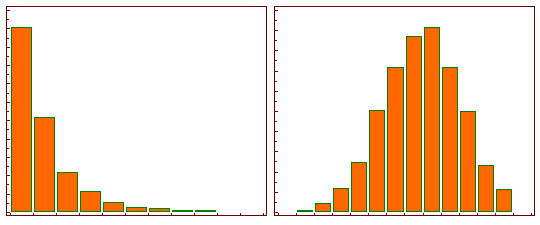
When our original continuous data do not follow the bell curve, we can log transform this data to make it as ?normal? as possible so that the statistical analysis results from this data become more valid. In other words, the log transformation reduces or removes the skewness of our original data. The important caveat here is that the original data has to follow or approximately follow a log-normal distribution. Otherwise, the log transformation won?t work.
 The Effect of Log Transformation? Source
How to apply Log Transformation in Python?
Applying log transformation in Python is very simple. First, you have to install and import NumPy, the fundamental package for scientific computing with Python. After that, you just have to apply the natural log transformation function of NumPy (numpy.log or np.log) to the values you want to log transform. Check out the following codes –
import numpy as npx = [1, 2, 3, 4, 5]y = np.log(x)y![]()
How to Interpret Log Transformed Coefficients?
As you can see, log transformation is very easy to apply and quite beneficial for statistical modeling. However, log transformation also adds some complexity to our regression model especially when it comes to interpreting the model?s coefficients. What do I mean by this? Well, for a model with variables that are not log-transformed, the interpretation of its coefficients is fairly simple. Let?s look at the following equation.
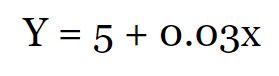
The intercept in this equation is 5. It means that when the independent variable (x) is 0, the dependent variable (Y) is 5. The coefficient of x is 0.03, meaning that the dependent variable (Y) would increase by 0.03 for every 1 unit increase in the independent variable (x). Simple right? But when the dependent or independent variables are log-transformed, the interpretation of the coefficients is not as straightforward. There are three ways to look at this –
Log ? Level Regression
A log-level regression is a model where the target variable is log-transformed but the predictor variables are not. To interpret the coefficients of a log-level regression, we must first exponentiate the coefficients of the independent variables with a base of e. Let?s take a look at the following calculation to see how the change in the independent variable changes the dependent variable.
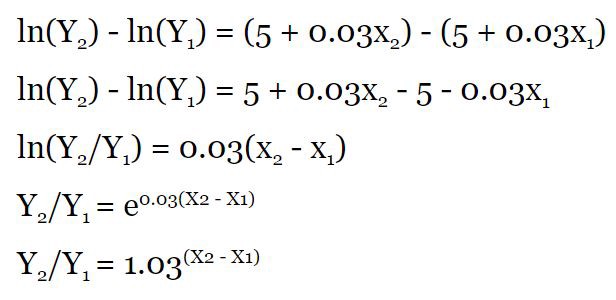
So, based on this equation, we can conclude that for every one-unit increase in our independent variable (x), the dependent variable (Y) will increase by 3% (1.03 = 1.03). The important thing here is that this increase must be a fixed value. If we increase x by 10-units, the change in Y would equal to 34% (1.03? = 1.34).
Level -Log Regression
A level-log regression is a model where one or more independent variables are log-transformed but the dependent variable remains original. Before analyzing what its coefficient means, let?s dive into the calculation below ?
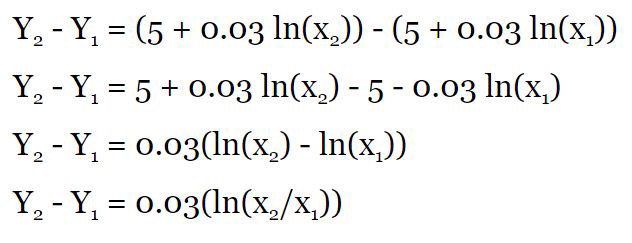
According to this equation, we can assume that for a fixed percentage change in the value of our independent variable (x), our dependent variable (Y) will be changed by 0.03 * natural log of x percentage change. For instance, if x increases by 10%, Y would increase by 0.3% ( 0.03 * ln(1.1) = 0.003). If x increases by 50%, Y would increase by 1.2% ( 0.03 * ln(1.5) = 0.012). As long as the percentage change in x is fixed, Y will also change by a fixed percentage.
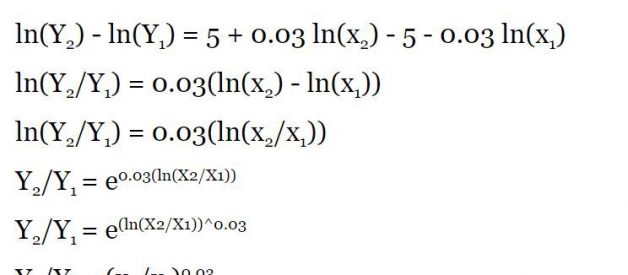
Log-Log
A log-log regression is a model where the target variable and at least one predictor variable are log-transformed. Similar to the log-level regression, we will remove the logarithm from the left side of the equation and exponentiate the right side with a base of e. Let?s take a look ?
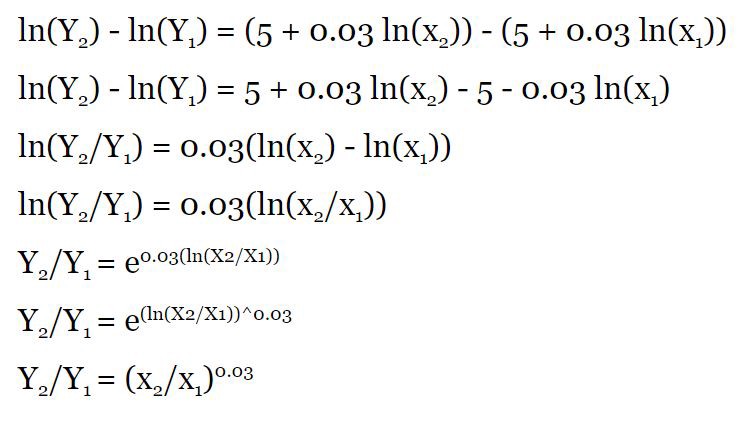
This equation tells us that for a fixed percentage changed in our independent variable (x), our dependent variable (Y) would change by x percentage change to the power of 0.03. If x changes by 10%, y would change by 0.3% (1.1?? = 1.003). If x changes by 20%, y would change by 0.5% (1.2?? = 1.005).
Conclusions
So ? Log Transformation is pretty awesome. It makes our skewed original data more normal. It improves linearity between our dependent and independent variables. It boosts validity of our statistical analyses. But we have to be cautious when it comes to interpreting the coefficients of log-transformed variables. I hope this article gives you an overview of how to interpret them.
References
- https://www.ncbi.nlm.nih.gov/pmc/articles/PMC4120293/
- https://people.duke.edu/~rnau/411log.htm
- https://stats.idre.ucla.edu/other/mult-pkg/faq/general/faqhow-do-i-interpret-a-regression-model-when-some-variables-are-log-transformed/

