Uber?s technology may look simple but when A user requests a ride from the app, and a driver arrives to take them to their destination.
But Behind the scenes, however, a giant infrastructure consisting of thousands of services and terabytes of data supports each and every trip on the platform.
Like most web-based services, the Uber backend system started out as a ?monolithic? software architecture with a bunch of app servers and a single database
If you are looking for System Design of UBER, here is a video I made
For more System design videos please subscribe my channel: Tech Dummies
The system was mainly written in Python and used SQLAlchemy as the ORM-layer to the database. The original architecture was fine for running a relatively modest number of trips in a few cities.
After 2014 the architecture has evolved into a Service-oriented architecture with about 100s of services
Uber?s backend is now not just designed to handle taxies, instead, it can handle taxi, food delivery and cargo also
The backend is primarily serving mobile phone traffic. uber app talks to the backend over mobile data.
Uber?s Dispatch system acts like a real-time market platform that matches drivers with riders using mobile phones.
So we need two services
- Supply service
- Demand service
going forward I will be using supply for cabs and demand for riders while explaining
Supply service:
? The Supply Service tracks cars using geolocation (lat and lang) Every cab which is active keep on sending lat-long to the server every 5 sec once
? The state machines of all of the supply also kept in memory
? To track vehicles there are many attributes to model: number of seats, type of vehicle, the presence of a car seat for children, can a wheelchair be fit, and so on.
? Allocation needs to be tracked. A vehicle, for example, may have three seats but two of those are occupied.
Demand service
? The Demand Service tracks the GPS location of the user when requested
? It tracks requirements of the orders like Does a rider require small car/big car or pool etc
? demand requirements must be matched against supply inventory.
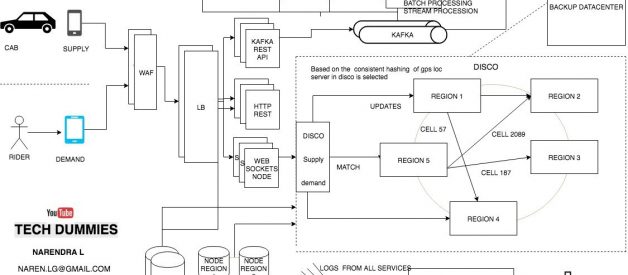
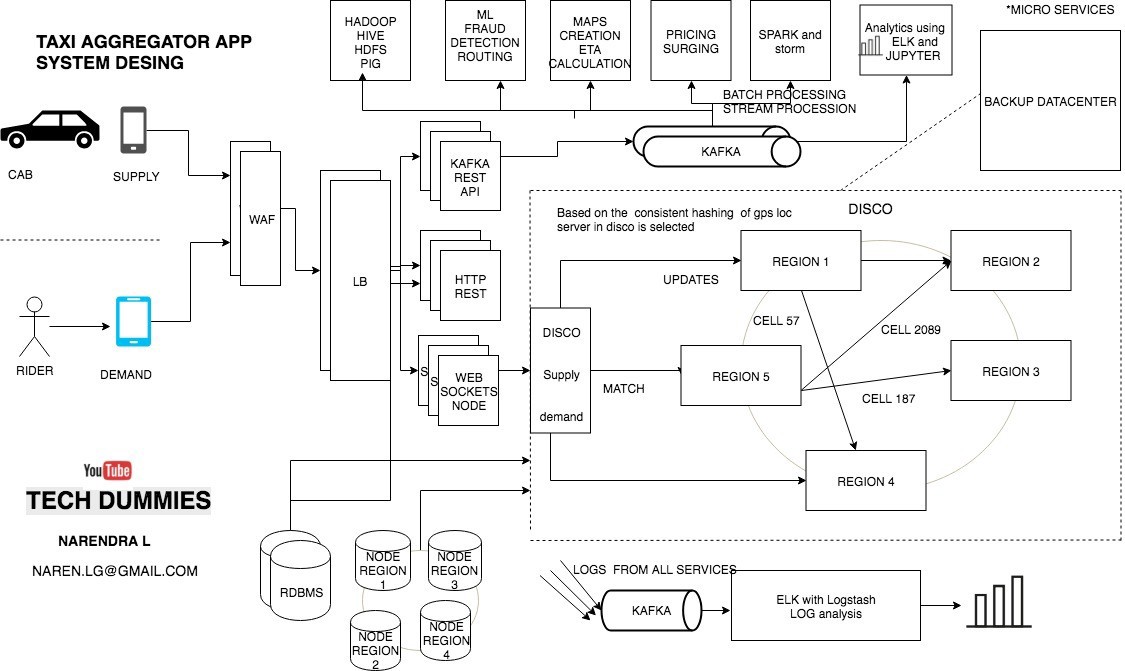
Now we have supply and demand. all we need a service which matches they demand to a supply and that service in UBER is called as DISCO
DISCO ? DISPATCH optimization
This service runs on hundreds of processes.
Core requirements of the dispatch system
- reduce extra driving.
- reduce waiting time
- lowest overall ETA
How does the Dispatch system work?? How riders are matched to drivers ??
GPS/ location data is what drive dispatch system, that means we have to model our maps and location data
- The earth is a sphere. It?s hard to do summarization and approximation based purely on longitude and latitude. So Uber divides the earth into tiny cells using the Google S2 library. Each cell has a unique cell ID.
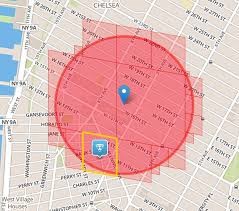
- S2 can give the coverage for a shape. If you want to draw a circle with a 1km radius centered on London, S2 can tell what cells are needed to completely cover the shape
- Since each cell has an ID the ID is used as a sharding key. When a location comes in from supply the cell ID for the location is determined. Using the cell ID as a shard key the location of the supply is updated. It is then sent out to a few replicas.
- To match riders to drivers or just display cars on a map, DISCO sends a request to geo by supply
- the system filters all cabs by rider?s GPS location data to get nearby cabs that meet riders requirements Using the cell IDs from the circle area all the relevant shards are contacted to return supply data.
- Then the list and requirements are sent to routing / ETA to compute the ETA of how nearby they are not geographically, but by the road system.
- Sort by ETA then sends it back to supply system to offer it to a driver.
How To Scale Dispatch System?
There are many ways you can build, but @ uber
- Dispatch is built using node.js the advantage with using node is the asynchronous and event-based framework. also, it enables you to send and receive messages over WebSockets
- so anytime client can send the message to server or server can send and whenever it wants to.
- Now how to distribute dispatch computation on the same machine and to multiple machines?
- The solution to scaling is Node js with ringpop, it is faster RPC protocol with gossip using SWIM protocol along with a consistent hash ring.
- Ringpop is a library that brings cooperation and coordination to distributed applications. It maintains a consistent hash ring on top of a membership protocol and provides request forwarding as a routing convenience. It can be used to shard your application in a way that?s scalable and fault tolerant
- SWIM is used gossip/to know what node does what and who takes which geo?s computation?s responsibility.
- so with gossip it’s easy to add and remove nodes and hence scaling is easy
- Gossip protocol SWIM also combines health checks with membership changes as part of the same protocol.
How supply sends messages and saved?
Apache Kafka is used as the data hub
supply or cabs uses Kafka?s APIS to send there accurate GPS locations to the datacenter.
Once the GPS locations are loaded to Kafka they are slowly persisted to the respective worker notes main memory and also to the DB when the trip is happening.
How do Maps and routing work?
Before Uber launches operations in a new area, we define and onboard a new region to our map technology stack. Inside this map region, we define subregions labeled with grades A, B, AB, and C, as follows:
Grade A: A subregion of Uber Territory covering urban centers and commute areas that makeup approximately 90 percent of all expected Uber traffic. With that in mind, it is of critical importance to ensure the highest map quality of grade A map regions.
Grade B: A subregion of Uber Territory covering rural and suburban areas that might be less populated or less traveled by Uber customers.
Grade AB: A union of grade A and B subregions.
Grade C: A set of highway corridors connecting various Uber Territories.
GeoSpatial design:
The earth is a sphere. It?s hard to do summarization and approximation based purely on longitude and latitude.
So Uber divides the earth into tiny cells using the Google S2 library. Each cell has a unique cell ID.
When DISCO needs to find the supply near a location, a circle?s worth of coverage is calculated centered on where the rider is located.
The read load is scaled through the use of replicas. If more read capacity is needed the replica factor can be increased.
How uber builds the Map?
- Trace coverage: A comparative coverage metric, trace coverage identifies missing road segments or incorrect road geometry. The computation uses two inputs: map data under testing and historic GPS traces of all Uber rides taken over a certain period of time. We overlay those GPS traces onto the map, comparing and matching them with road segments. If we find GPS traces where no road is shown, we can infer that our map is missing a road segment and take steps to fix the deficiency.
- Preferred access (pick-up) point accuracy: Pick-up points are an extremely important metric to the rider experience, especially at large venues such as airports and stadiums. For this metric, we compute the distance of an address or place?s location, as shown by the map pin in Figure 4, below, from all actual pick-up and drop-off points used by drivers. We then set the closest actual location to be the preferred access point for the said location pin. When a rider requests the location indicated by the map pin, the map guides the driver to the preferred access point. We continually compute this metric with the latest actual pick-up and drop-off locations to ensure the freshness and accuracy of the suggested preferred access points.
How ETAs are calculated?
that means disco should track the cabs available to ride the riders.
but IT shouldn?t just handle currently available supply, i.e. cabs which are ready to ride customer but also tracks the cars about to finish a ride.
for example:
- a cab which is about to finish near the demand(rider) is better than allocating the cab which is far away from the demand.
- Sometimes revising a route of an ongoing trip because some cab near to demand came online.
when uber started every cities data was separated by creating separated tables/DB this was not easy
now all the cities computation happens in the same system, since the workers the DBnodes are distributed by regions the demand request will be sent to the nearest datacenter.
Routing and Calculating ETA is important component in uber as it directly impacts ride matching and earnings.
so it uses historical travel times to calculate ETAs
you can use AI simulated algorithms or simple Dijkstra’s also to find the best route
Also you can use Driver?s app?s GPS location data to easily predict traffic condition at any given road as there are so many uber cars on the road which is sending GPS locations every 4 seconds
The whole road network is modeled as a graph. Nodes represent intersections, and edges represent road segments. The edge weights represent a metric of interest: often either the road segment distance or the time take it takes to travel through it. Concepts such as one-way streets, turn restrictions, turn costs, and speed limits are modeled in the graph as well.
One simple example you can try at home is the Dijkstra?s search algorithm, which has become the foundation for most modern routing algorithms today.
OSRM is based on contraction hierarchies. Systems based on contraction hierarchies achieve fast performance ? taking just a few milliseconds to compute a route ? by preprocessing the routing graph.
Databases:
A lot of different databases are used. The oldest systems were written in Postgres.
Redis is used a lot. Some are behind Twemproxy. Some are behind a custom clustering system.
MySQL: Built on these requirements
- linearly add capacity by adding more servers (Horizontally scalable )
- write availability with buffering using Redis
- Triggers should work when there is a change in theinstance
- No downtime for any operation (expanding storage, backup, adding indexes, adding data, and so forth).
You can use, Google?s Bigtable like any schema-less database
Trip data Storage in Schemaless
Uber is building their own distributed column store that?s orchestrating a bunch of MySQL instances called schemaless
Schemaless is key-value store which allows you to save any JSON data without strict schema validation in a schemaless fashion (hence the name).
It has append-only sharded MySQL with buffered writes to support failing MySQL masters and a publish-subscribe feature for data change notification which we call triggers.
Schemaless supports global indexes over the data.
Trip data is generated at different points in time, from pickup drop-off to billing, and these various pieces of info arrive asynchronously as the people involved in the trip give their feedback, or background processes execute.
A trip is driven by a partner, taken by a rider, and has a timestamp for its beginning and end. This info constitutes the base trip, and from this we calculate the cost of the trip (the fare), which is what the rider is billed. After the trip ends, we might have to adjust the fare, where we either credit or debit the rider. We might also add notes to it, given feedback from the rider or driver (shown with asterisks in the diagram above). Or, we might have to attempt to bill multiple credit cards, in case the first is expired or denied.
Some of the Dispatch services are keeping state in Riak.
Geospatial data and trips DB
The design goal is to handle a million GPS points writes per second
Read is even more as for every rider we need to show at least 10 nearby cabs
using Geo hash and Google s2 library all the GPS locations can be queried
Now let’s talk about ANALYTICS
Log collection and analysis
Every micro-services or service logging services are configured to push logs to a distributed Kafka cluster and then using log stash we can apply filters on the messages and redirect them to different sources,
for example, Elastic search to do some log analysis using Kibana/Graphana
- Track HTTP APIs
- To manage profile
- To collect feedback and ratings
- Promotion and coupons etc
- FRAUD DETECTION
- Payment fraud
- Incentive abuse
- Compromised accounts
Load balance:
Layer 7, Layer 4 and Layer 3 Load Balancer
- Layer 7 in application load balancing
- layer 4 is based on IP + ump/ TCP or DNS based load balance
- Layer 3 is based on only IP address
Post-trip actions:
once the trip is completed we need to do these actions by scheduling
? Collect ratings.
? Send emails.
? Update databases.
? Schedule payments.
PRICE AND SURGE:
The price is increased when there are more demand and less supply with the help of prediction algorithms.
According to UBER surge helps to meed supply and demand. by increasing the price more cabs will be on the road when the demand is more.
How To Handle Total Datacenter Failure?
- It doesn?t happen very often, but there could be an unexpected cascading failure or an upstream network provider could fail.
- Uber maintains a backup data center and the switches are in place to route everything over to the backup datacenter.
- The problem is the data for in-process trips may not be in the backup datacenter. Rather than replicate data they use driver phones as a source of trip data.
- What happens is the Dispatch system periodically sends an encrypted State Digest down to driver phones. Now let?s say there?s a datacenter failover. The next time the driver phone sends a location update to the Dispatch system the Dispatch system will detect that it doesn?t know about this trip and ask them for the State Digest. The Dispatch system then updates itself from the State Digest and the trip keeps on going like nothing happened.

