
Understand the Fundamentals of Statistics for Becoming a Data Scientist
Feel free to follow me on Medium 🙂
Statistics is a form of mathematical analysis that uses quantified models and representations for a given set of experimental data or real-life studies. The main advantage of statistics is that information is presented in an easy way. Recently, I reviewed the whole statistics materials and organized the 8 basic statistics concepts for becoming a data scientist!
- Understand Type of Analytics
- Probability
- Central Tendency
- Variability
- Relationship Between Variables
- Probability Distribution
- Hypothesis Testing and Statistical Significance
- Regression

Understand Type of Analytics
Descriptive Analytics tell we what happened in the past and help a business understand how it is performing by providing context to help stakeholders interpret information.
Diagnostic Analytics takes descriptive data a step further and helps you understand why something happened in the past.
Predictive Analytics predicts what is most likely to happen in the future and provides companies with actionable insights based on the information.
Prescriptive Analytics provides recommendations regarding actions that will take advantage of the predictions and guide the possible actions toward a solution.
Probability
Probability is the measure of the likelihood that an event will occur in a Random Experiment.
Complement: P(A)+P(A?) =1
Intersection: P(A?B)=P(A)P(B)
Union: P(A?B)=P(A)+P(B)?P(A?B)
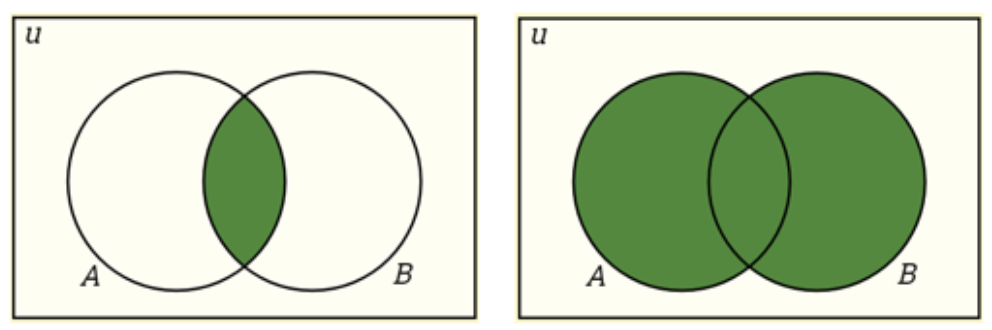 Intersection and Union
Conditional Probability: P(A|B) is a measure of the probability of one event occurring with some relationship to one or more other events. P(A|B)=P(A?B)/P(B), when P(B)>0.
Independent Events: Two events are independent if the occurrence of one does not affect the probability of occurrence of the other. P(A?B)=P(A)P(B) where P(A) != 0 and P(B) != 0 , P(A|B)=P(A), P(B|A)=P(B)
Mutually Exclusive Events: Two events are mutually exclusive if they cannot both occur at the same time. P(A?B)=0 and P(A?B)=P(A)+P(B).
Bayes? Theorem describes the probability of an event based on prior knowledge of conditions that might be related to the event.
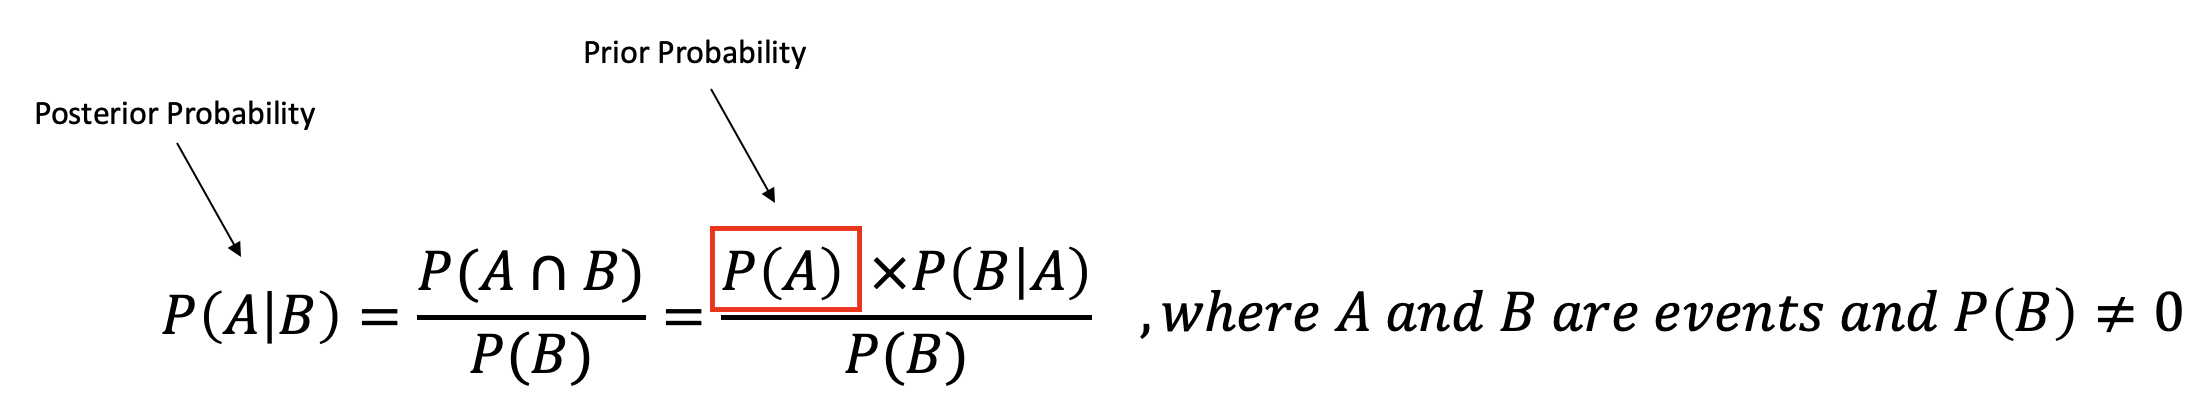 Bayes? Theorem
Central Tendency
Mean: The average of the dataset.
Median: The middle value of an ordered dataset.
Mode: The most frequently value in the dataset. If the data have multiple values that occurred the most frequently, we have a multimodal distribution.
Skewness: A measure of symmetry.
Kurtosis: A measure of whether the data are heavy-tailed or light-tailed relative to a normal distribution
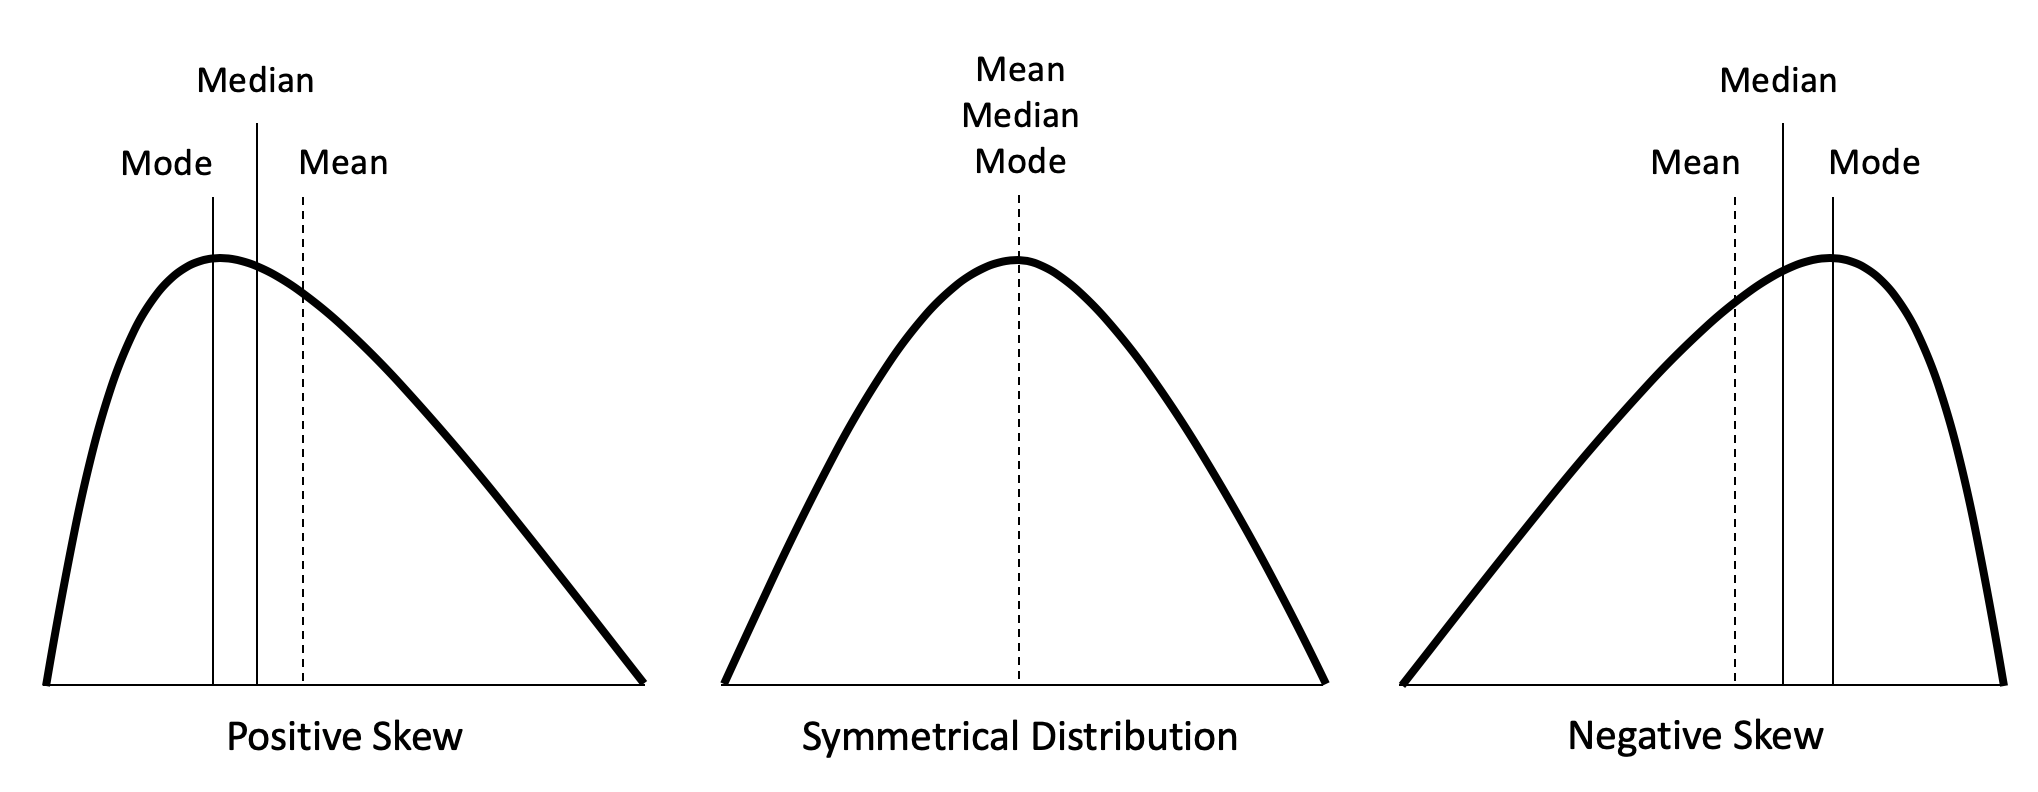
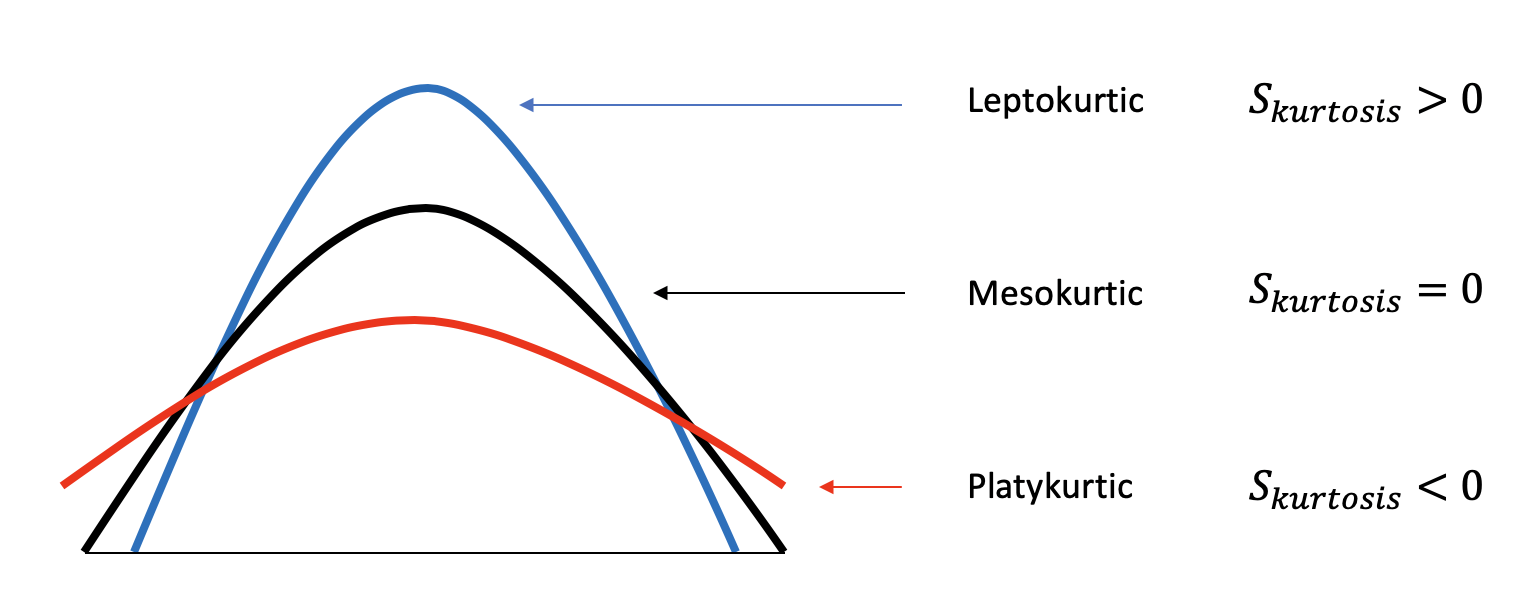 Skewness and Kurtosis
Variability
Range: The difference between the highest and lowest value in the dataset.
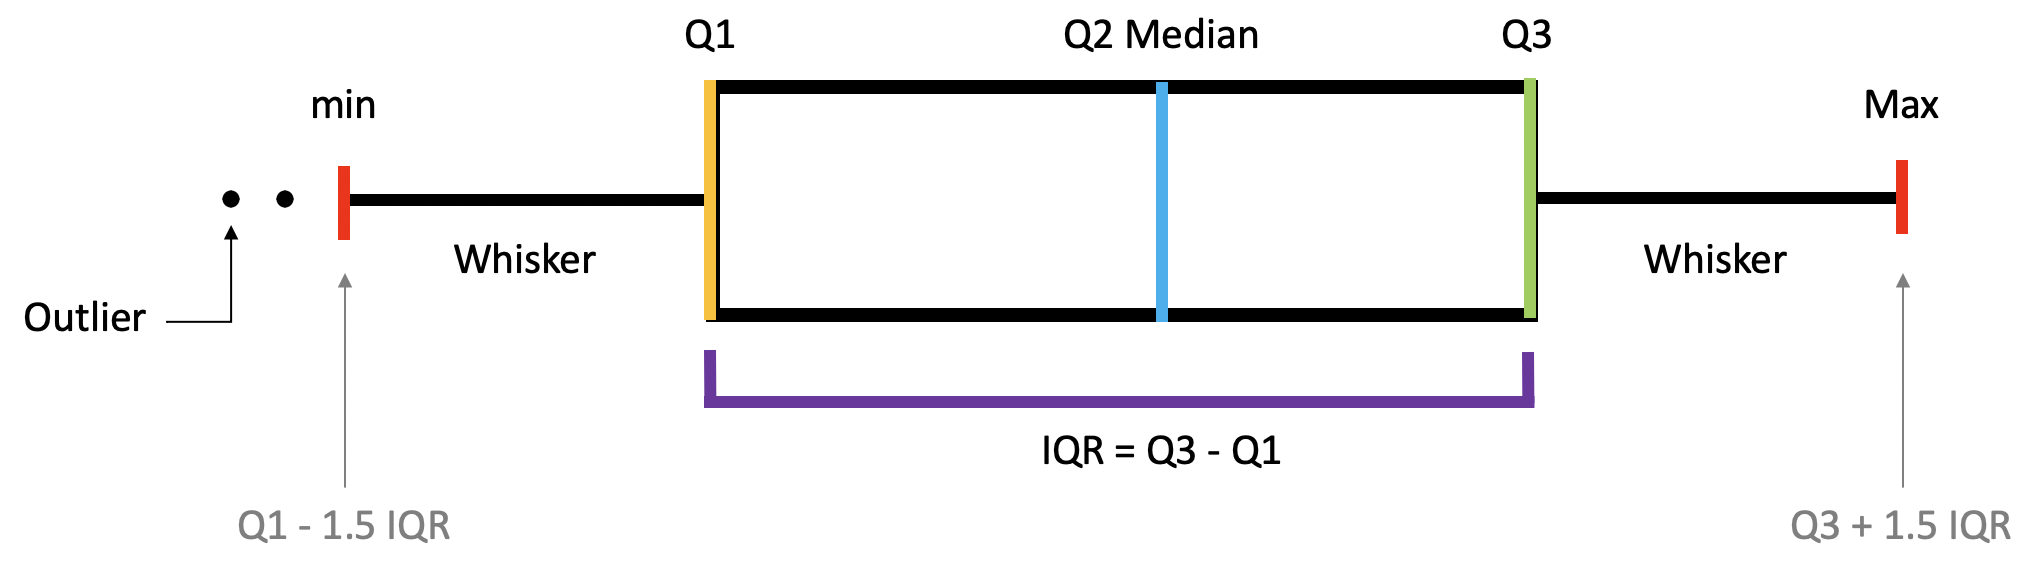
Percentiles, Quartiles and Interquartile Range (IQR)
- Percentiles ? A measure that indicates the value below which a given percentage of observations in a group of observations falls.
- Quantiles ? Values that divide the number of data points into four more or less equal parts, or quarters.
- Interquartile Range(IQR) ? A measure of statistical dispersion and variability based on dividing a data set into quartiles. IQR = Q3?Q1
 Percentiles, Quartiles and Interquartile Range (IQR)
Variance: The average squared difference of the values from the mean to measure how spread out a set of data is relative to mean.
Standard Deviation: The standard difference between each data point and the mean and the square root of variance.
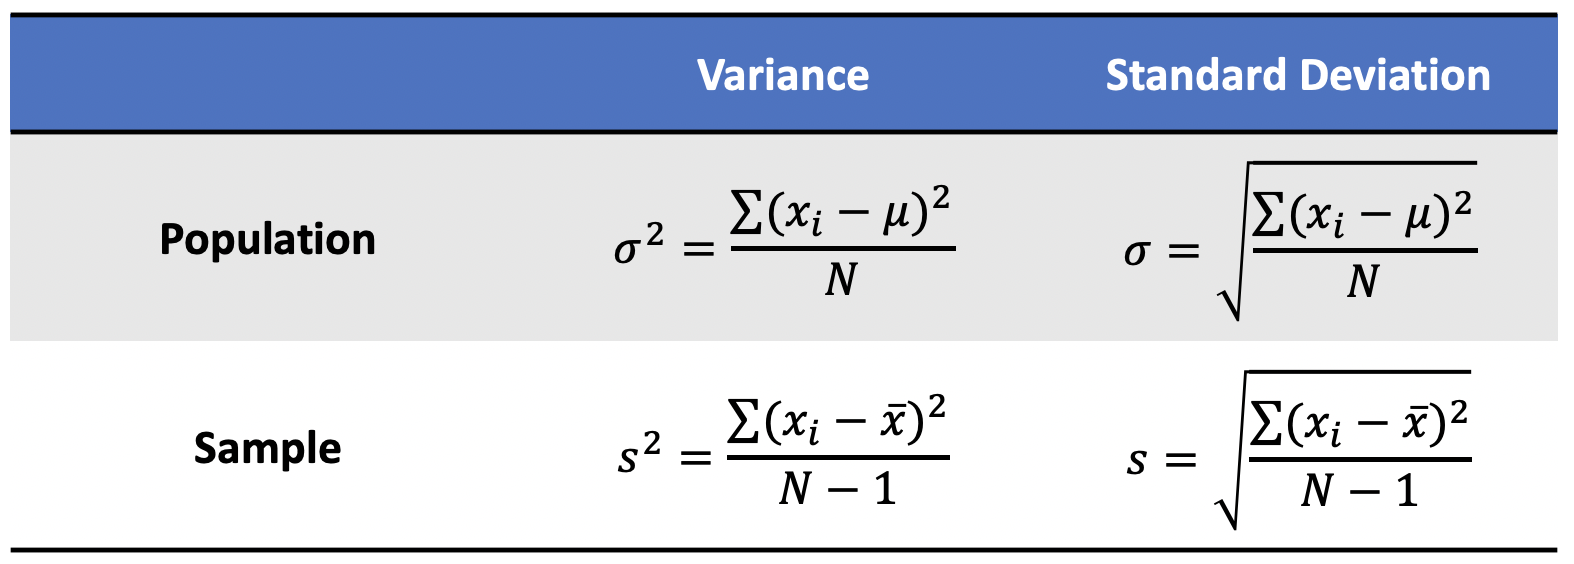 Population and Sample Variance and Standard Deviation
Standard Error(SE): An estimate of the standard deviation of the sampling distribution.
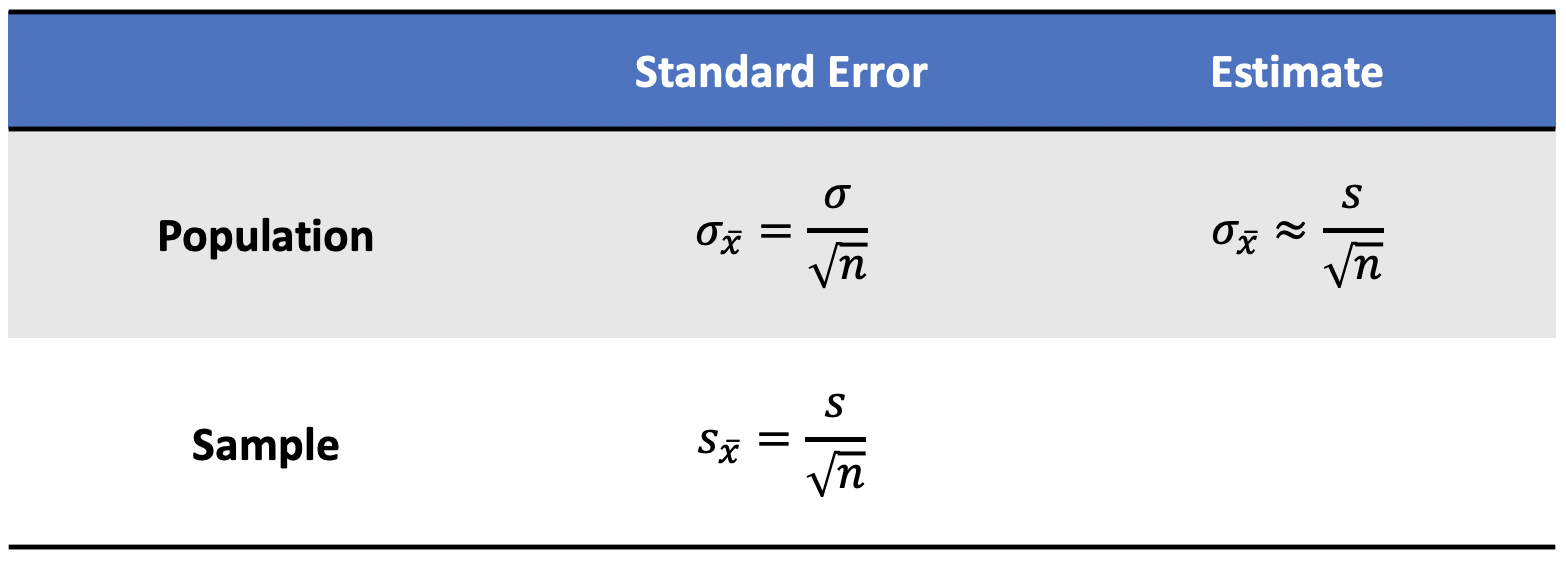 Population and Sample Standard Error
Relationship Between Variables
Causality: Relationship between two events where one event is affected by the other.
Covariance: A quantitative measure of the joint variability between two or more variables.
Correlation: Measure the relationship between two variables and ranges from -1 to 1, the normalized version of covariance.
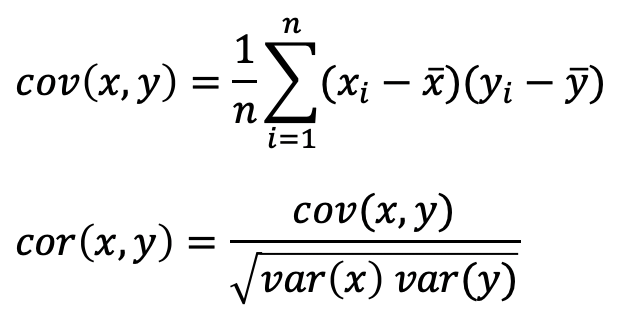
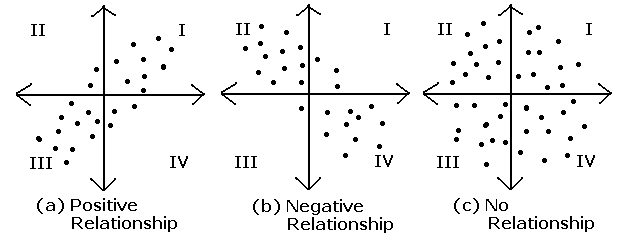 Covariance and Correlation
Probability Distribution
Probability Distribution Functions
Probability Mass Function(PMF): A function that gives the probability that a discrete random variable is exactly equal to some value.
Probability Density Function(PDF): A function for continuous data where the value at any given sample can be interpreted as providing a relative likelihood that the value of the random variable would equal that sample.
Cumulative Density Function(CDF): A function that gives the probability that a random variable is less than or equal to a certain value.
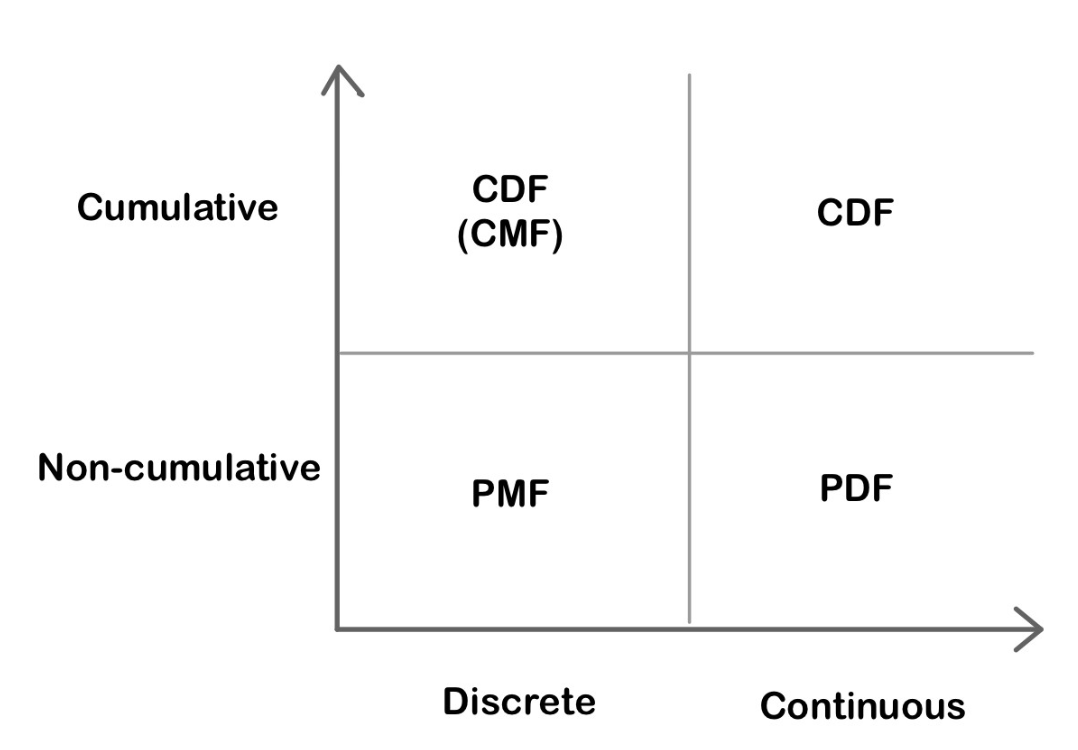 Comparison between PMF, PDF and CDF
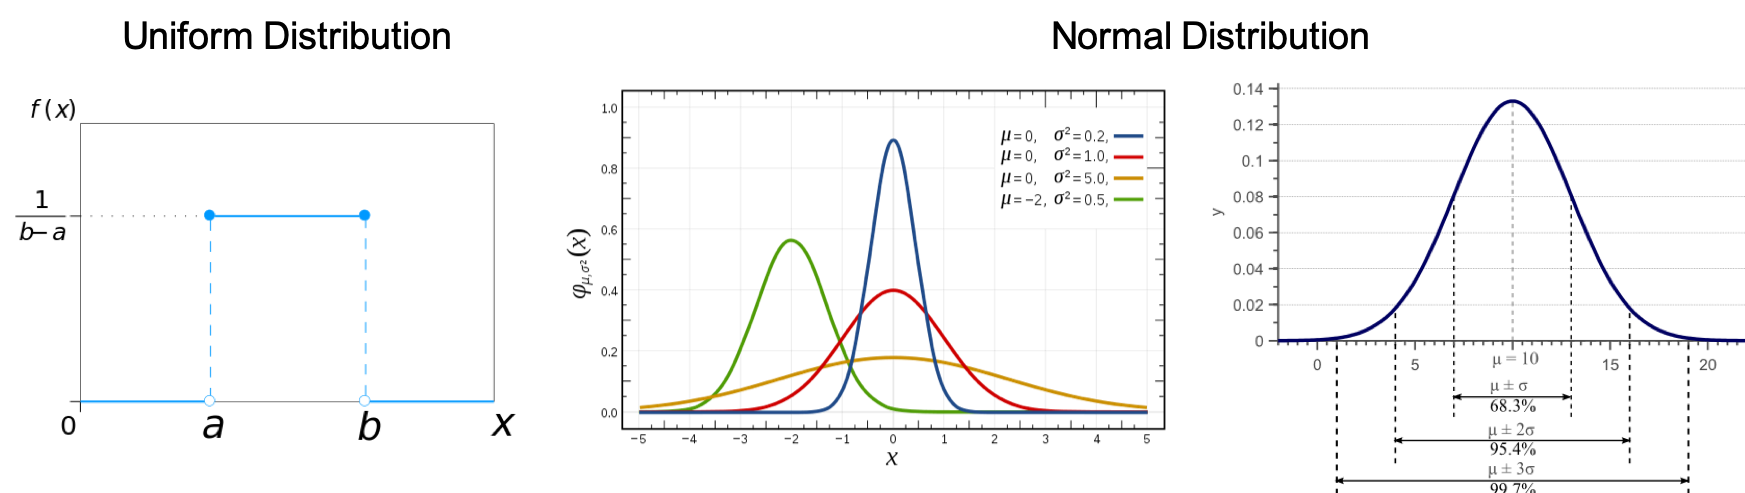
Continuous Probability Distribution
Uniform Distribution: Also called a rectangular distribution, is a probability distribution where all outcomes are equally likely.
Normal/Gaussian Distribution: The curve of the distribution is bell-shaped and symmetrical and is related to the Central Limit Theorem that the sampling distribution of the sample means approaches a normal distribution as the sample size gets larger.
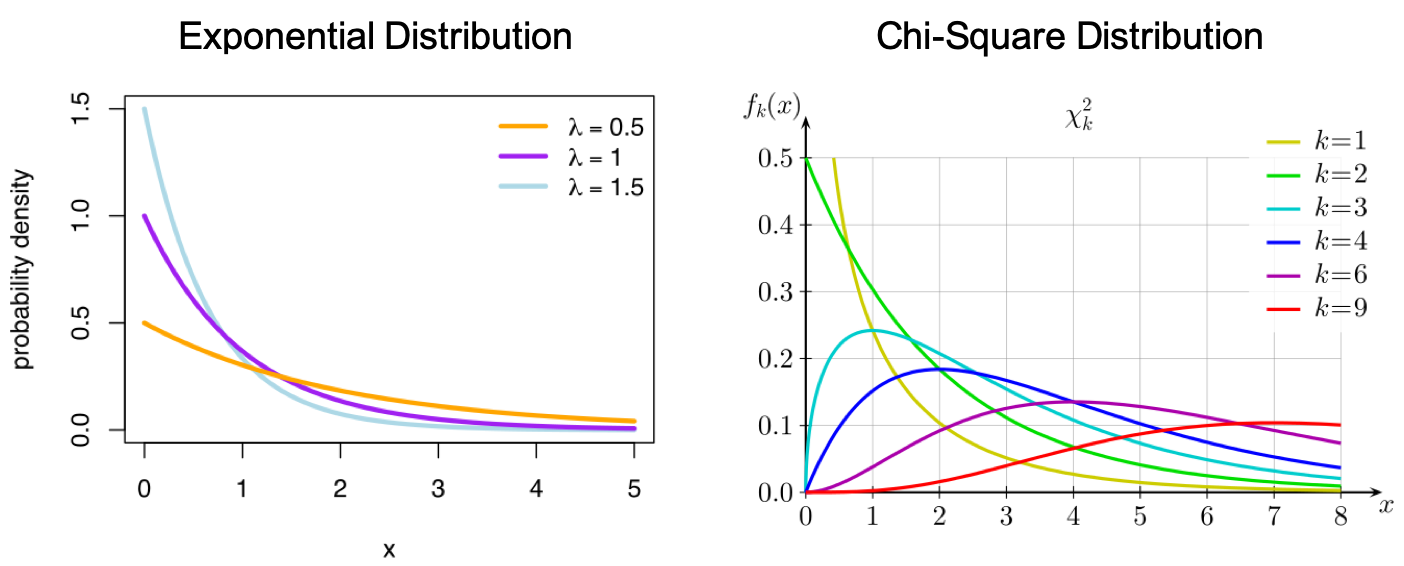
Exponential Distribution: A probability distribution of the time between the events in a Poisson point process.
Chi-Square Distribution: The distribution of the sum of squared standard normal deviates.
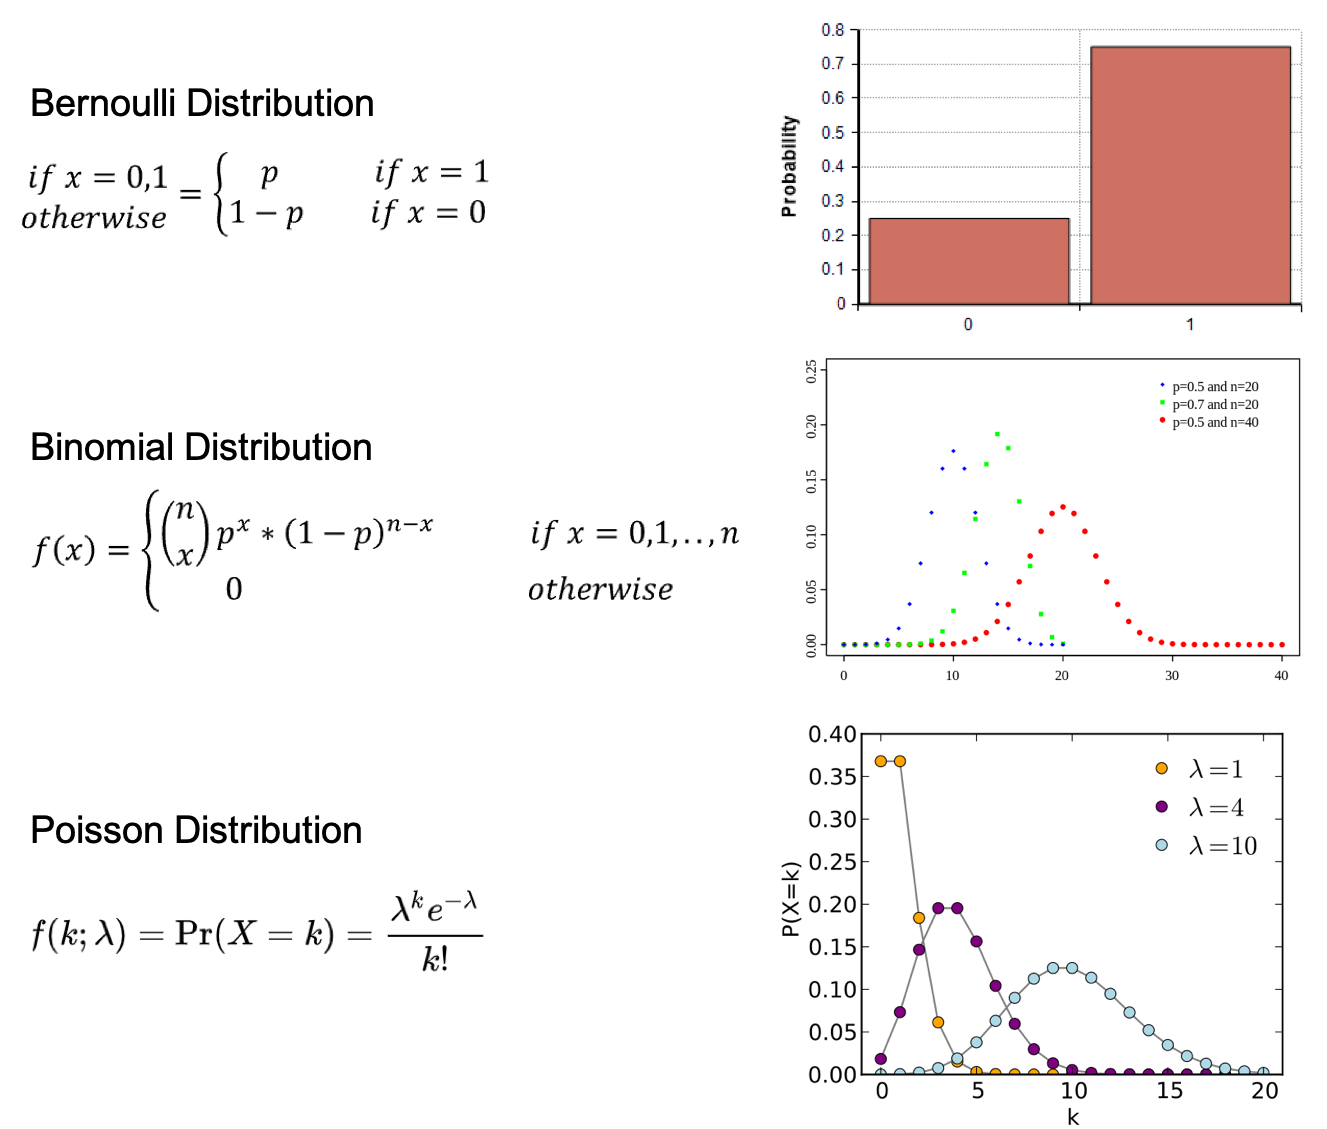
Discrete Probability Distribution
Bernoulli Distribution: The distribution of a random variable which takes a single trial and only 2 possible outcomes, namely 1(success) with probability p, and 0(failure) with probability (1-p).
Binomial Distribution: The distribution of the number of successes in a sequence of n independent experiments, and each with only 2 possible outcomes, namely 1(success) with probability p, and 0(failure) with probability (1-p).
Poisson Distribution: The distribution that expresses the probability of a given number of events k occurring in a fixed interval of time if these events occur with a known constant average rate ? and independently of the time.
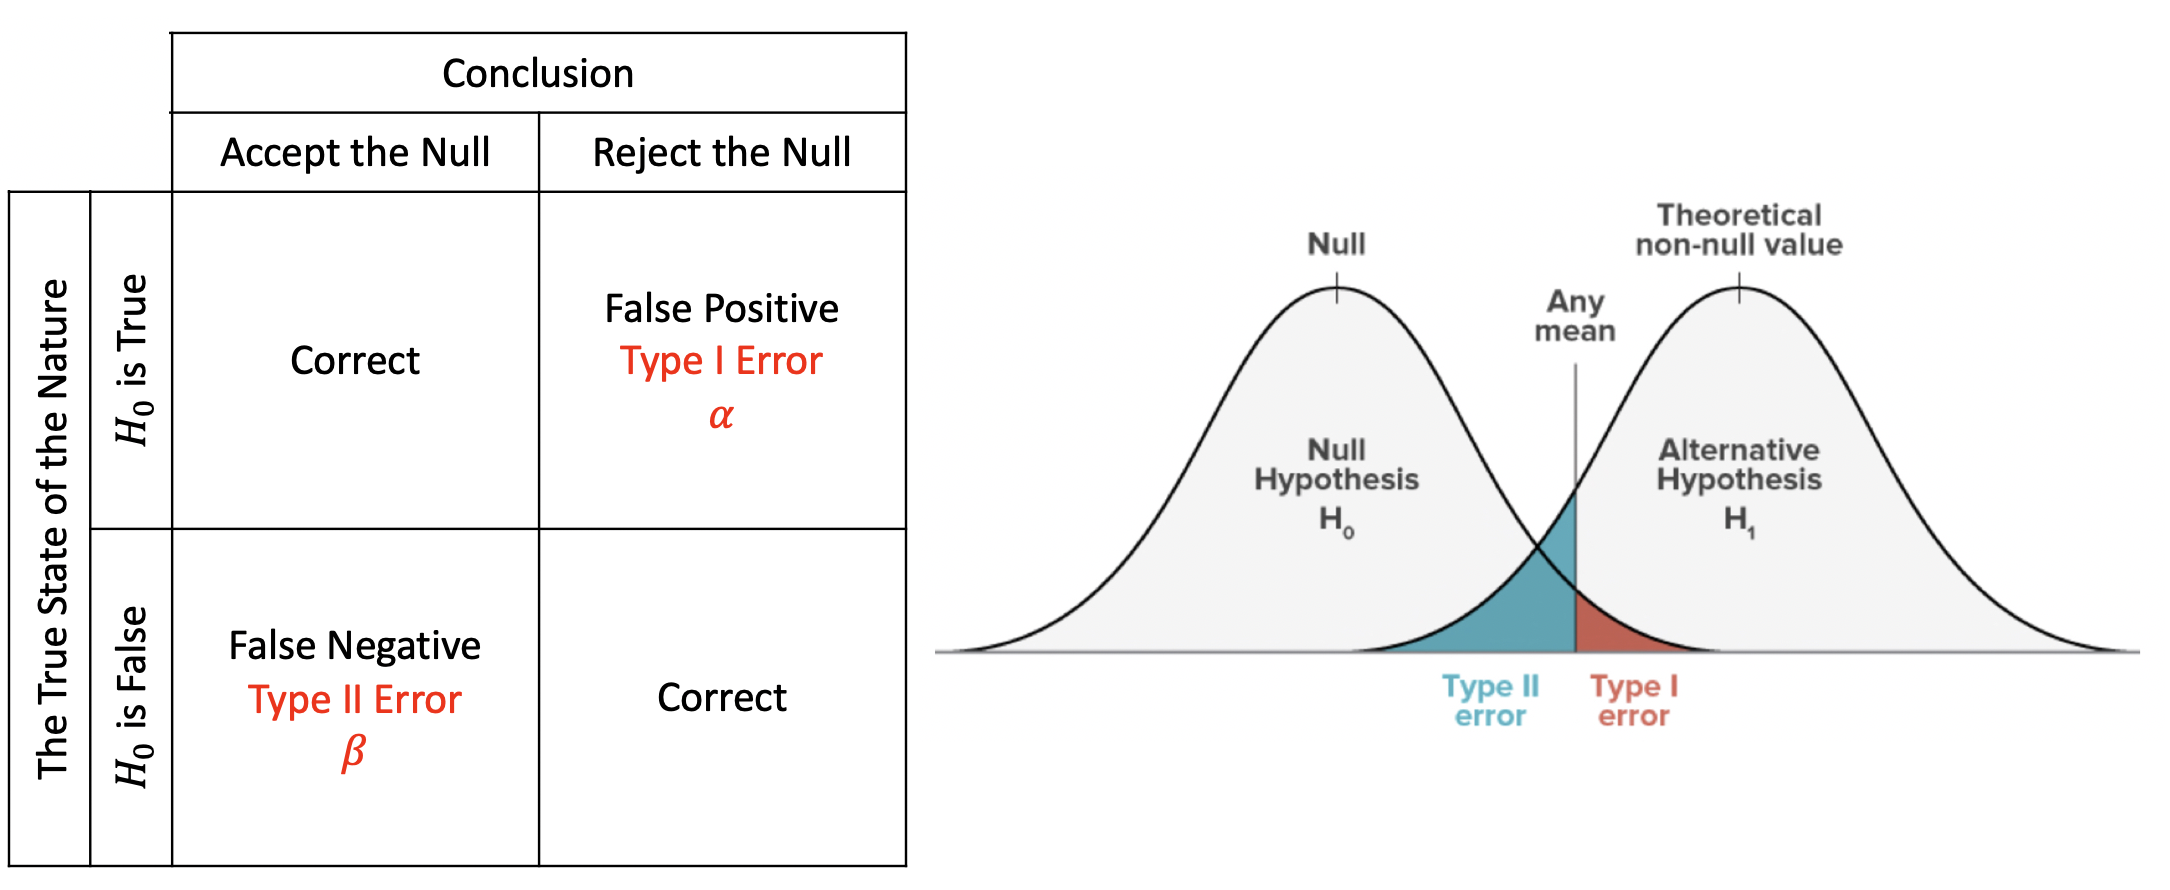
Hypothesis Testing and Statistical Significance
Null and Alternative Hypothesis
Null Hypothesis: A general statement that there is no relationship between two measured phenomena or no association among groups. Alternative Hypothesis: Be contrary to the null hypothesis.
In statistical hypothesis testing, a type I error is the rejection of a true null hypothesis, while a type II error is the non-rejection of a false null hypothesis.
Interpretation
P-value: The probability of the test statistic being at least as extreme as the one observed given that the null hypothesis is true. When p-value > ?, we fail to reject the null hypothesis, while p-value ? ?, we reject the null hypothesis and we can conclude that we have the significant result.
Critical Value: A point on the scale of the test statistic beyond which we reject the null hypothesis, and, is derived from the level of significance ? of the test. It depends upon a test statistic, which is specific to the type of test, and the significance level, ?, which defines the sensitivity of the test.
Significance Level and Rejection Region: The rejection region is actually depended on the significance level. The significance level is denoted by ? and is the probability of rejecting the null hypothesis if it is true.
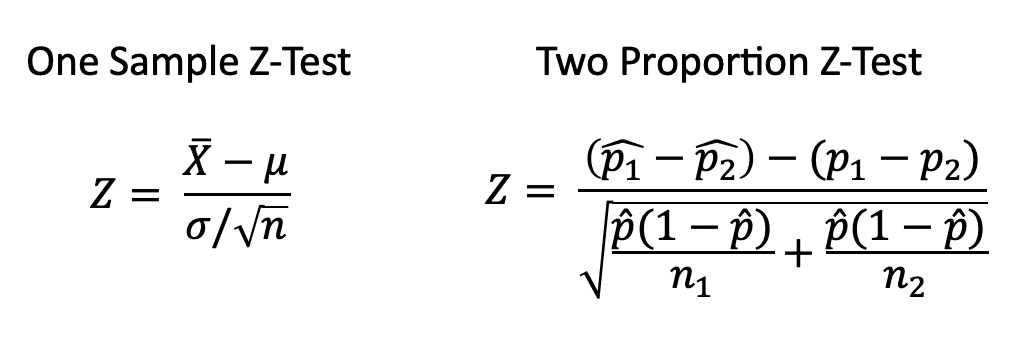
Z-Test
A Z-test is any statistical test for which the distribution of the test statistic under the null hypothesis can be approximated by a normal distribution and tests the mean of a distribution in which we already know the population variance. Therefore, many statistical tests can be conveniently performed as approximate Z-tests if the sample size is large or the population variance is known.
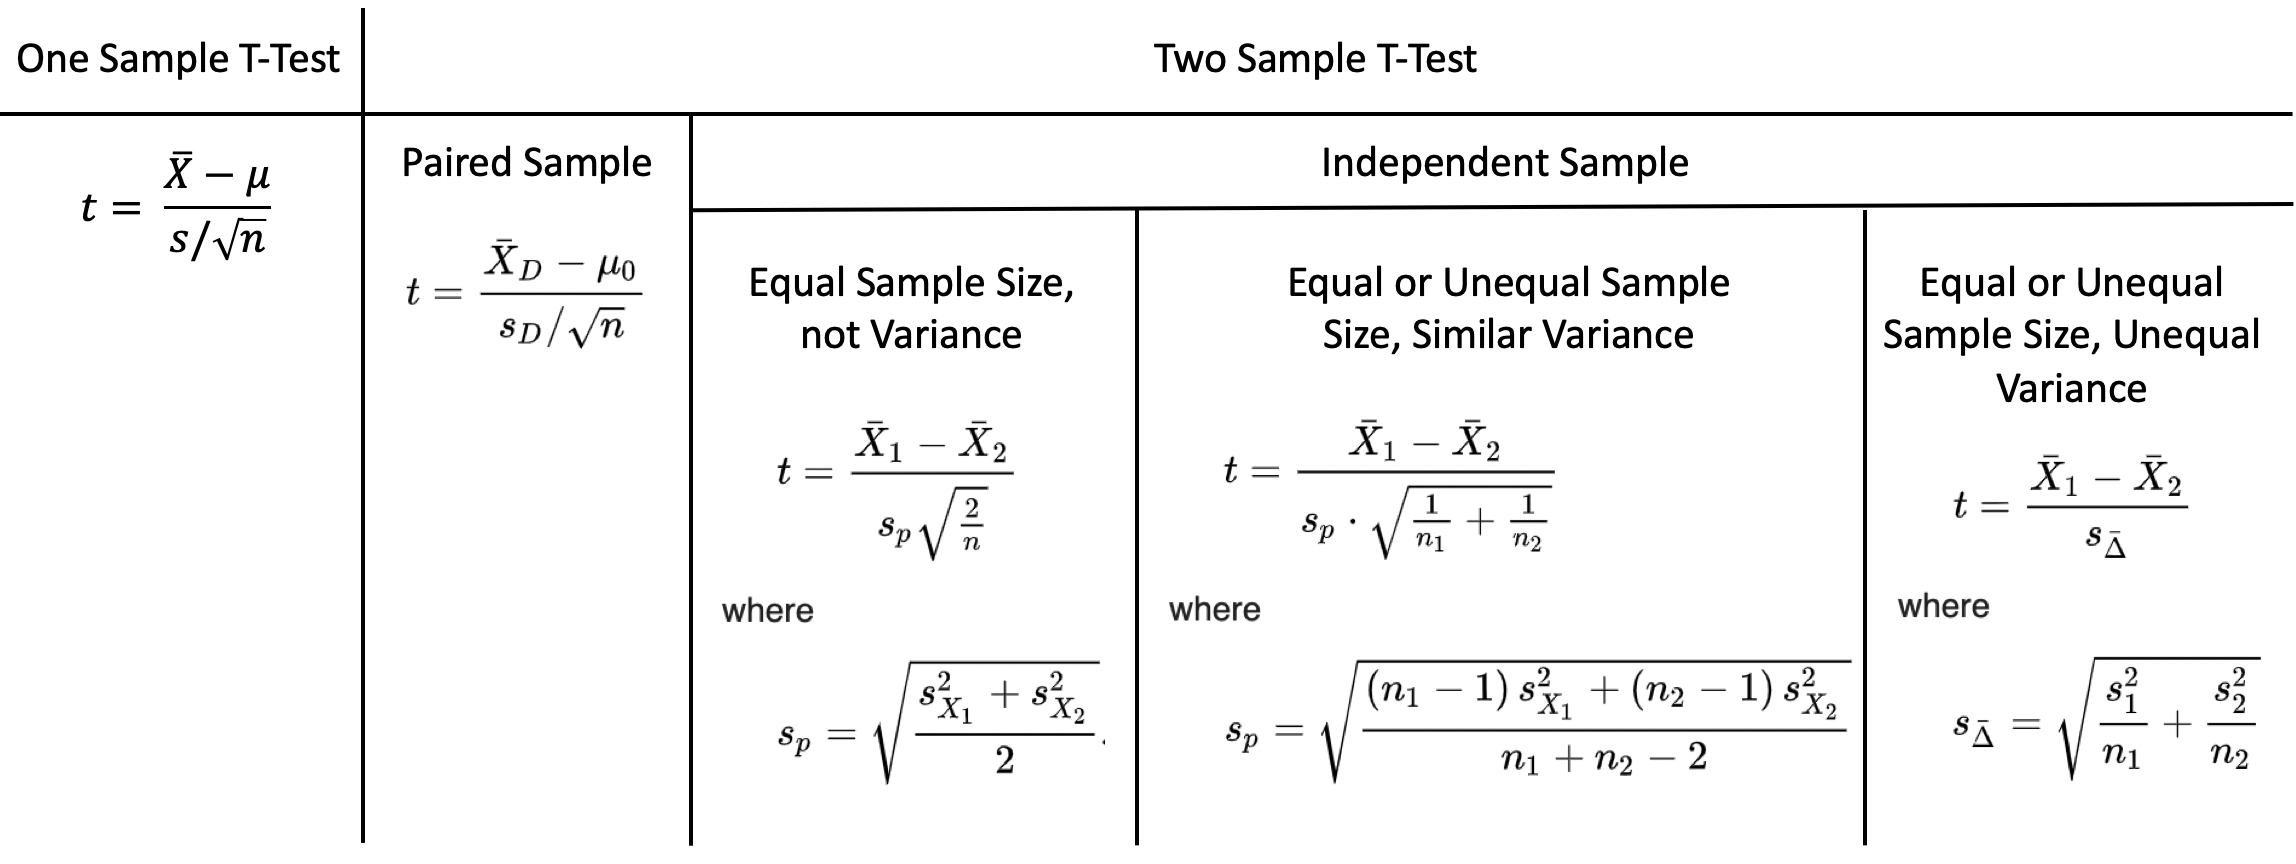
T-Test
A T-test is the statistical test if the population variance is unknown and the sample size is not large (n < 30).
Paired sample means that we collect data twice from the same group, person, item or thing. Independent sample implies that the two samples must have come from two completely different populations.
ANOVA(Analysis of Variance)
ANOVA is the way to find out if experiment results are significant. One-way ANOVA compare two means from tow independent group using only one independent variable. Two-way ANOVA is the extension of one-way ANOVA using two independent variables to calculate main effect and interaction effect.
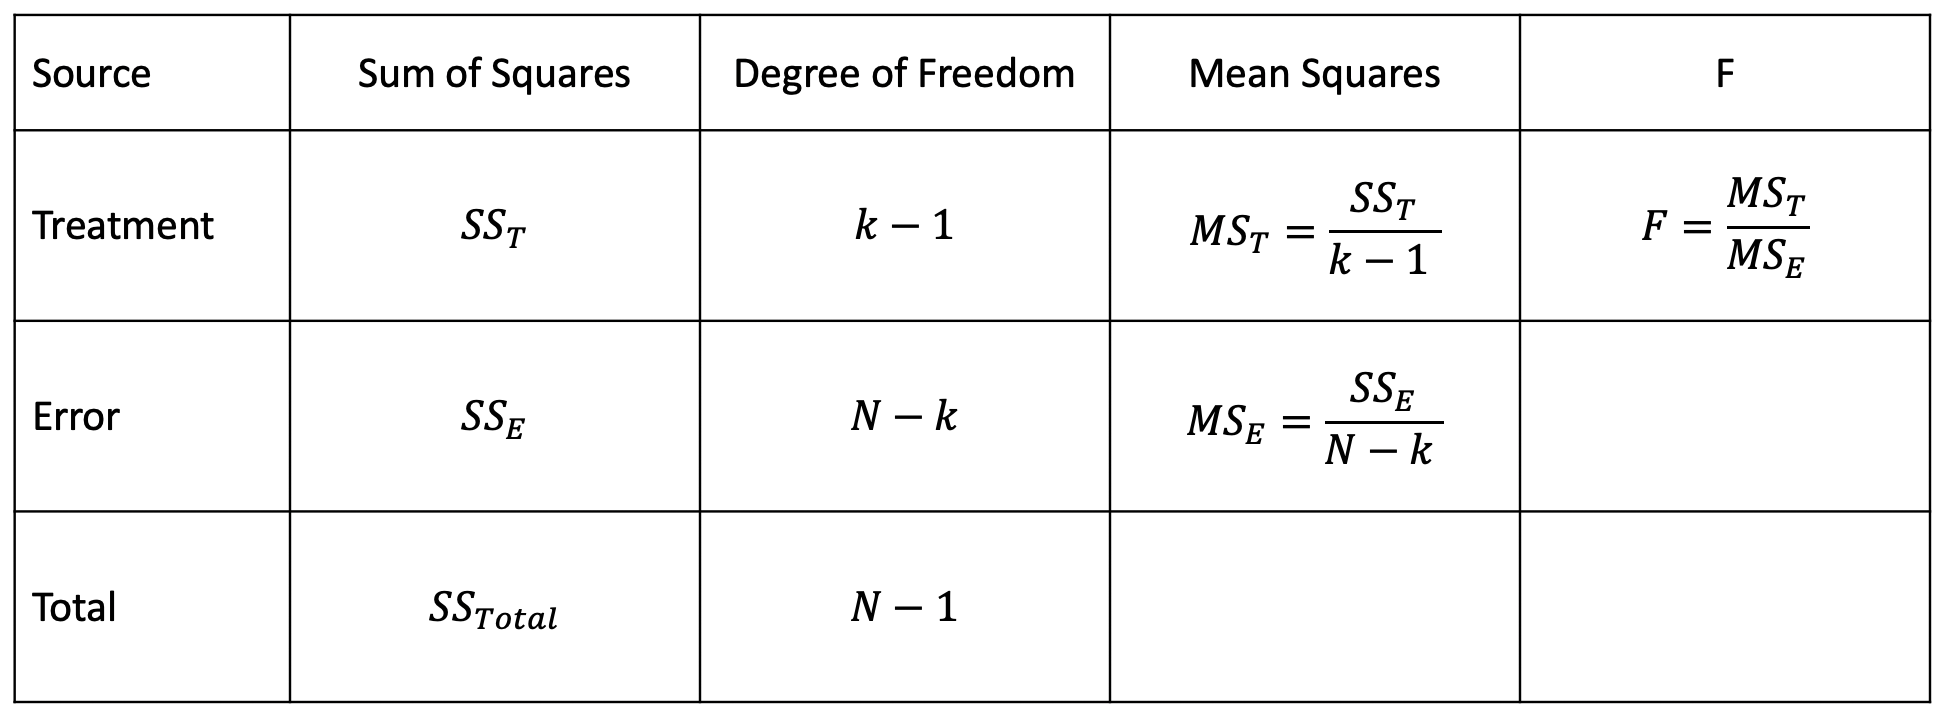 ANOVA Table
Chi-Square Test
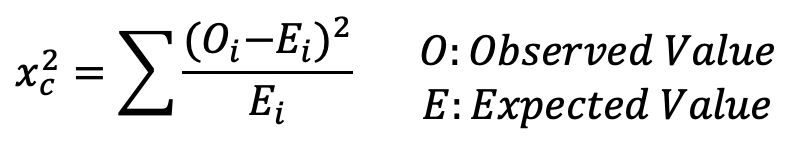 Chi-Square Test Formula
Chi-Square Test check whether or not a model follows approximately normality when we have s discrete set of data points. Goodness of Fit Test determine if a sample matches the population fit one categorical variable to a distribution. Chi-Square Test for Independence compare two sets of data to see if there is a relationship.
Regression
Linear Regression
Assumptions of Linear Regression
- Linear Relationship
- Multivariate Normality
- No or Little Multicollinearity
- No or Little Autocorrelation
- Homoscedasticity
Linear Regression is a linear approach to modeling the relationship between a dependent variable and one independent variable. An independent variable is the variable that is controlled in a scientific experiment to test the effects on the dependent variable. A dependent variable is the variable being measured in a scientific experiment.
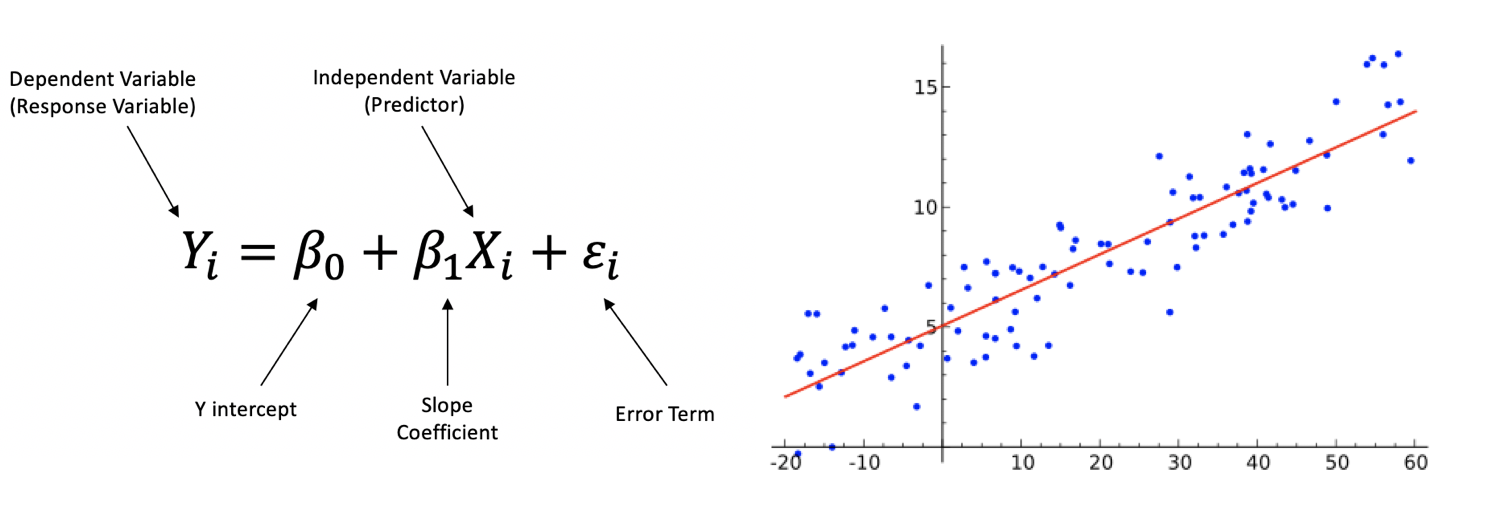 Linear Regression Formula
Multiple Linear Regression is a linear approach to modeling the relationship between a dependent variable and two or more independent variables.
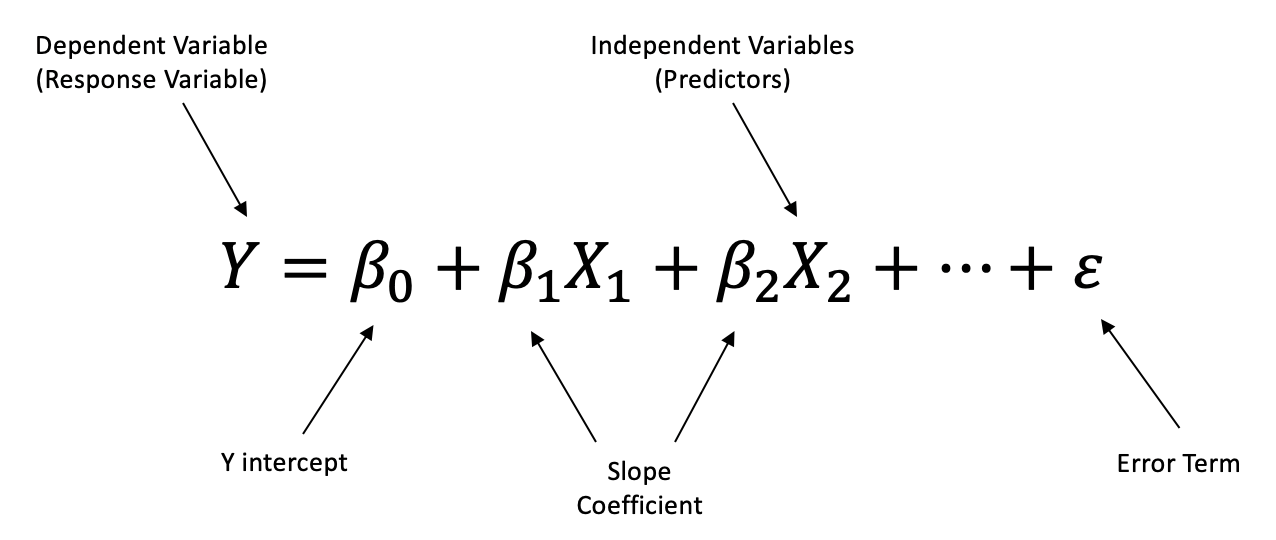 Multiple Linear Regression Formula
Steps for Running the Linear Regression
?Step 1: Understand the model description, causality and directionality
?Step 2: Check the data, categorical data, missing data and outliers
- Outlier is a data point that differs significantly from other observations. We can use standard deviation method and interquartile range(IQR) method.
- Dummy variable takes only the value 0 or 1 to indicate the effect for categorical variables.
?Step 3: Simple Analysis ? Check the effect comparing between dependent variable to independent variable and independent variable to independent variable
- Use scatter plots to check the correlation
- Multicollinearity occurs when more than two independent variables are highly correlated. We can use Variance Inflation Factor(VIF) to measure if VIF > 5 there is highly correlated and if VIF > 10 there is certainly multicollinearity among the variables.
- Interaction Term imply a change in the slope from one value to another value.
?Step 4: Multiple Linear Regression ? Check the model and the correct variables
?Step 5: Residual Analysis
- Check normal distribution and normality for the residuals.
- Homoscedasticity describes a situation in which error term is the same across all values of the independent variables and means that the residuals are equal across the regression line.
?Step 6: Interpretation of Regression Output
- R-Squared is a statistical measure of fit that indicates how much variation of a dependent variable is explained by the independent variables. Higher R-Squared value represents smaller differences between the observed data and fitted values.
- P-value
- Regression Equation
About me
Thank you so much for reading my article! Hi, I?m Shirley, incoming Business Intelligence Analyst at U-Haul and already graduated with a Master Degree in MS-Business Analytics at ASU. If you have questions, please don?t hesitate to contact me!
Email me at [email protected] and feel free to connect me on LinkedIn!
