This post is about SUPPORT VECTOR REGRESSION. Those who are in Machine Learning or Data Science are quite familiar with the term SVM or Support Vector Machine. But SVR is a bit different from SVM. As the name suggest the SVR is an regression algorithm , so we can use SVR for working with continuous Values instead of Classification which is SVM.
The terms that we are going to be using frequently in this post
- Kernel: The function used to map a lower dimensional data into a higher dimensional data.
- Hyper Plane: In SVM this is basically the separation line between the data classes. Although in SVR we are going to define it as the line that will will help us predict the continuous value or target value
- Boundary line: In SVM there are two lines other than Hyper Plane which creates a margin . The support vectors can be on the Boundary lines or outside it. This boundary line separates the two classes. In SVR the concept is same.
- Support vectors: This are the data points which are closest to the boundary. The distance of the points is minimum or least.
Why SVR ? Whats the main difference between SVR and a simple regression model?
In simple regression we try to minimise the error rate. While in SVR we try to fit the error within a certain threshold. This might be a bit confusing but let me explain.
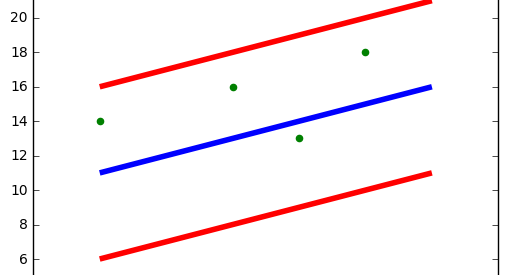
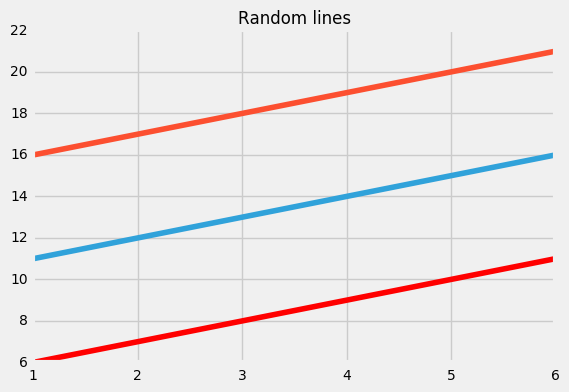 fig 1 :Blue line: Hyper Plane; Red Line: Boundary Line
Blue line: Hyper Plane; Red Line: Boundary Line
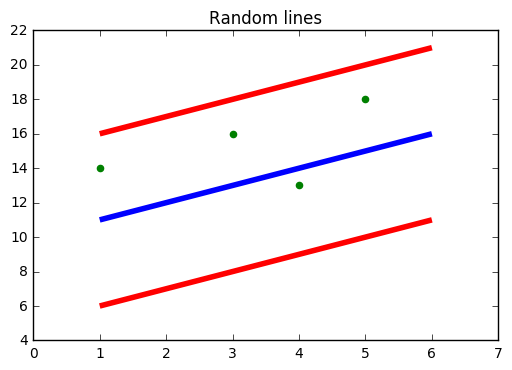 fig 2:Now see the points
See fig 2 see how all the points are within the boundary line(Red Line). Our objective when we are moving on with SVR is to basically consider the points that are within the boundary line. Our best fit line is the line hyperplane that has maximum number of points.
So Let?s Start:
So the first thing we have to understand is what is this boundary line ?(yes! that red line). Think of it as to lines which are at a distance of ?e? (though not e its basically epsilon) but for simplicity lets say its ?e?.
So the lines that we draw are at ?+e? and ?-e ? distance from Hyper Plane.
Assuming our hyper plane is a straight line going through the Y axis
We can say that the Equation of the hyper plane is
wx+b=0
So we can state that the two the equation of the boundary lines are
Wx+b=+e
Wx+b=-e
respectively
Thus coming in terms with the fact that for any linear hyper plane the equation that satisfy our SVR is:
e?y-Wx-b?+e
stating the fact that y=Wx+b
y-Wx-b=0
This applies for all other type of regression (non-linear,polynomial)
RECAP
What we are trying to do here is basically trying to decide a decision boundary at ?e? distance from the original hyper plane such that data points closest to the hyper plane or the support vectors are within that boundary line
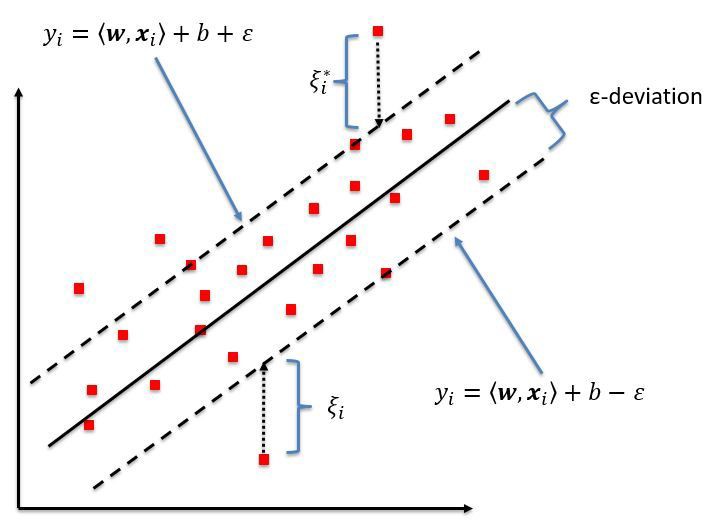 Fig 3: https://www.researchgate.net/figure/Schematic-of-the-one-dimensional-support-vector-regression-SVR-model-Only-the-points_fig5_320916953
Thus the decision boundary is our Margin of tolerance that is We are going to take only those points who are within this boundary.
Or in simple terms that we are going to take only those those points which have least error rate. Thus giving us a better fitting model.
If my explanation is not sufficient You can check:
Support Vector Regression
Edit description
www.saedsayad.com
Ok let now do what we actually wanna do. Coding Part of course
DOWNLOAD THE CODE AND CSV FROM HERE:
neelindresh/NeelBlog
NeelBlog – Contains the code and csv from my blog
github.com
DATA SET DESCRIPTION:
Predicting the age of abalone from physical measurements. Name Data Type Meas. Description —- ——— —– ———– Sex nominal M, F, and I (infant) Length continuous mm Longest shell measurement Diameter continuous mm perpendicular to length Height continuous mm with meat in shell Whole weight continuous grams whole abalone Shucked weight continuous grams weight of meat Viscera weight continuous grams gut weight (after bleeding) Shell weight continuous grams after being dried Rings integer +1.5 gives the age in years
Link:
https://archive.ics.uci.edu/ml/machine-learning-databases/abalone/abalone.names
This time lets take it all the way! From Scaling to Feature Selection What say!
# coding: utf-8
import pandas as pd
df=pd.read_csv(?./age_mod.csv?)
df.head()
df=df.drop([?Sex?],axis=1)
from sklearn.svm import SVR
regressor=SVR(kernel=?linear?,degree=1)
import matplotlib.pyplot as plt
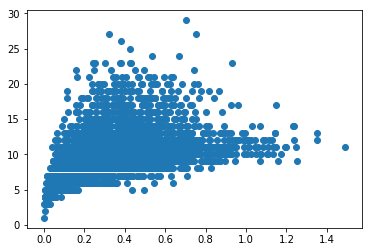
plt.scatter(df[?Shucked weight?],df[?Age?])
from sklearn.model_selection import train_test_split
xtrain,xtest,ytrain,ytest=train_test_split(x,y)
regressor.fit(xtrain,ytrain)
pred=regressor.predict(xtest)
print(regressor.score(xtest,ytest))
from sklearn.metrics import r2_score
print(r2_score(ytest,pred))
regressor=SVR(kernel=?rbf?,epsilon=1.0)regressor.fit(xtrain,ytrain)pred=regressor.predict(xtest)print(regressor.score(xtest,ytest))print(r2_score(ytest,pred))
READ THE CSV FILE
import pandas as pd
df=pd.read_csv(?./age_mod.csv?)
df.head()
WE DON?T NEED THE ?Sex? COLUMN SO DELETE
df=df.drop([?Sex?],axis=1)
LOADING THE SVR MODEL FROM sklearn.svm
from sklearn.svm import SVR
regressor=SVR(kernel=?linear?)
#NOTE: kernel=?linear? ? we are setting the kernel to a linear kernel
#DEFAULT: kernel=?rbf?
PLOT THE RELATION:
import matplotlib.pyplot as plt
plt.scatter(df[?Shucked weight?],df[?Age?])
#try it for other parameters
SPLIT INTO TRAIN AND TEST SET
from sklearn.model_selection import train_test_split
xtrain,xtest,ytrain,ytest=train_test_split(x,y)
FIT THE MODEL DO THE PREDICTION
regressor.fit(xtrain,ytrain)
pred=regressor.predict(xtest)
CHECK THE ACCURACY
print(regressor.score(xtest,ytest))
from sklearn.metrics import r2_score
print(r2_score(ytest,pred))
#NOTE: Both .score() and r2_score gives us a accuracy score prediction
LET?S TUNE SO PARAMETERS TO SEE IF WE CAN GET BETTER SCORE:
regressor=SVR(kernel=?rbf?,epsilon=1.0)regressor.fit(xtrain,ytrain)pred=regressor.predict(xtest)print(regressor.score(xtest,ytest))print(r2_score(ytest,pred))
LOOK HERE:
SVR(kernel=?rbf?,epsilon=1.0,degree=3)
#here we set the kernel to ?rbf? of degree 3 and a epsilon value of 1.0
#by default the kernel is ?rbf? degree is 3 and epsilon is 0.1
#other kernels are ? ?linear?,?poly?(for polynomial),? rbf?
Thanks for Reading!
Follow my blog at:
Data Science for Everyone
Polynomial regression As told in the previous post that a polynomial regression is a special case of linear regression?
dataneel.wordpress.com
Polynomial regression:
Polynomial regression
Polynomial regression As told in the previous post that a polynomial regression is a special case of linear regression?
dataneel.wordpress.com
Multiple regression
Multiple regression/Regression Part 2:
As we discussed in the previous post Linear regression part 1 Linear Regression Part 1 We use multiple Regression when?
dataneel.wordpress.com
Linear Regression

