Pivot table or crosstab? Let?s see panda?s description.
Crosstab: ?Compute a simple cross-tabulation of two (or more) factors. By default computes a frequency table of the factors unless an array of values and an aggregation function are passed.?
Pivot Table: ?Create a spreadsheet-style pivot table as a DataFrame. The levels in the pivot table will be stored in MultiIndex objects (Hierarchical indexes on the index and columns of the result DataFrame.
Both create tables and compare features/columns of data. Let?s see some examples.
Import Pandas and Create a Data Frame
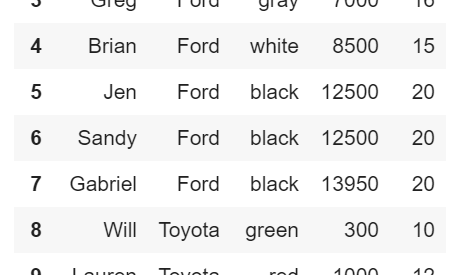
#Import Pandasimport pandas as pd#Sample data I created and saved to dfdf = pd.read_csv(‘sample_car_data.csv’)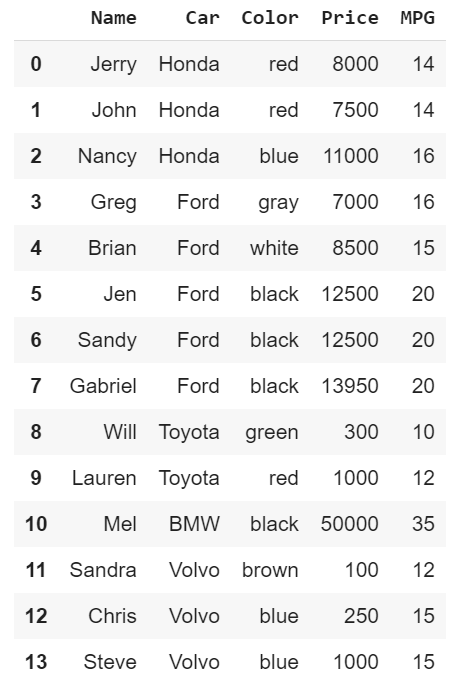 Sample Data of Cars
Pivot Tables
We?ll begin with a simple pivot table:
pd.pivot_table(df, index=’Car’, aggfunc=’mean’)#Deleting aggfunc=’mean’ will yield the same value.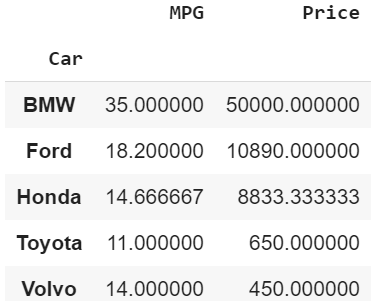 Car with Average Values of MPG & Price
With just the bare minimum the numerical values are automatically filled while the non-numerical values are omitted. Each cell is the averages/mean of the car?s MPG and Price. The default aggfunc is mean.
Create multiple indexes and specify its value and aggfunc.
pd.pivot_table(df, index=[‘Car’, ‘Color’], values=’Price’, aggfunc=’sum’)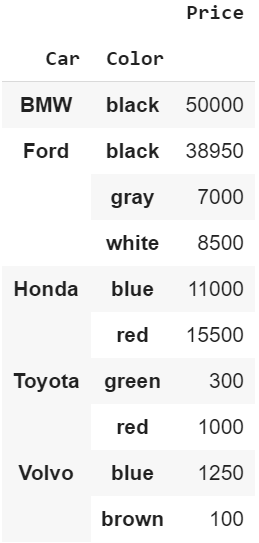 Car & Color with Summed Values of Price
Adding multiple columns to the pivot tables
pd.pivot_table(df, index=’Car’, columns=[‘Color’,’MPG’], aggfunc=’sum’)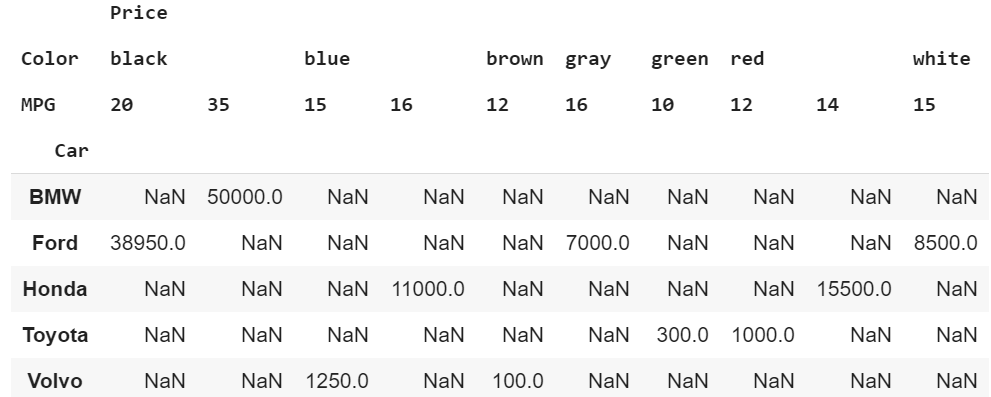 Car with Color and MPG and Summed price values
Crosstab
Create the bare minimum crosstab below. This compares the index and column to get the count.
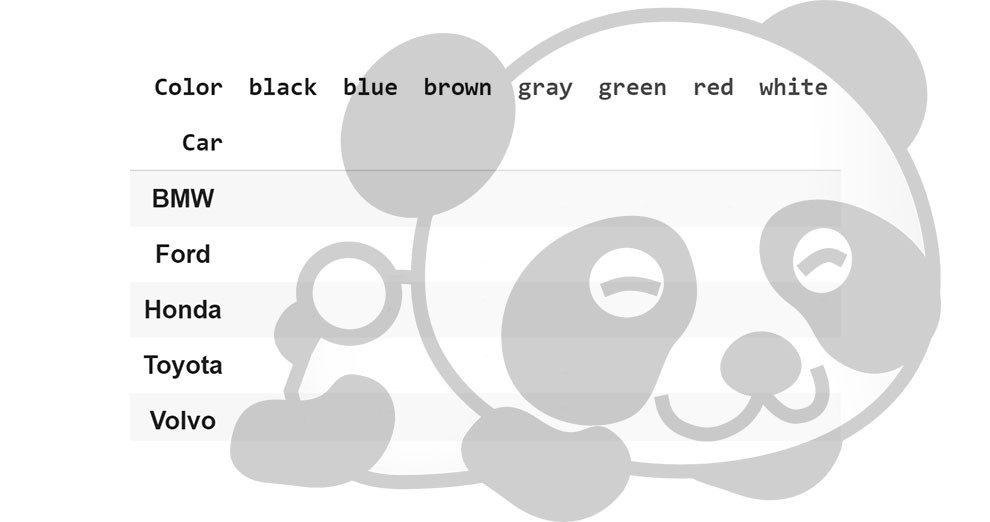
pd.crosstab(index=df[‘Car’], columns=df[‘Color’])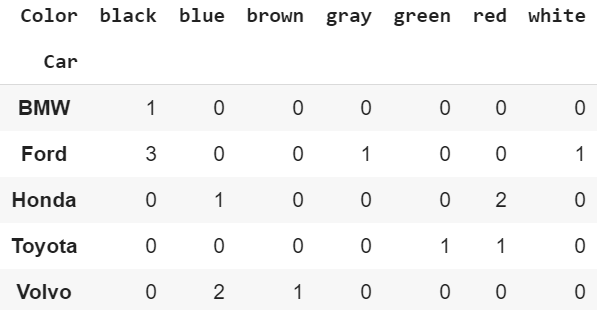 Car and Color
Crosstab of multiple indexes and a column. Additionally, it shows the total count of each row and column.
pd.crosstab(index=[df[‘Car’],df[‘MPG’]], columns=df[‘Color’], margins=True)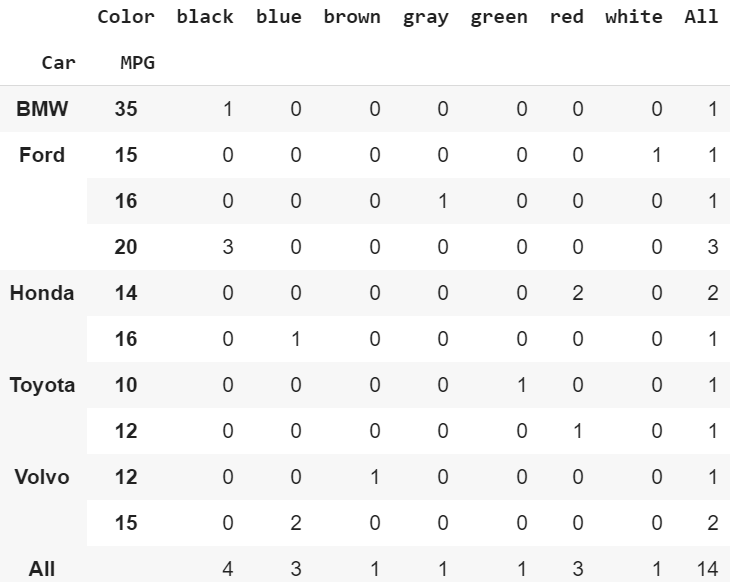 Car & MPG with Color
Crosstab of multiple columns also showing the total count of each row and column.
pd.crosstab(index=df[‘Car’], columns=[df[‘Color’],df[‘Price’]], margins=True)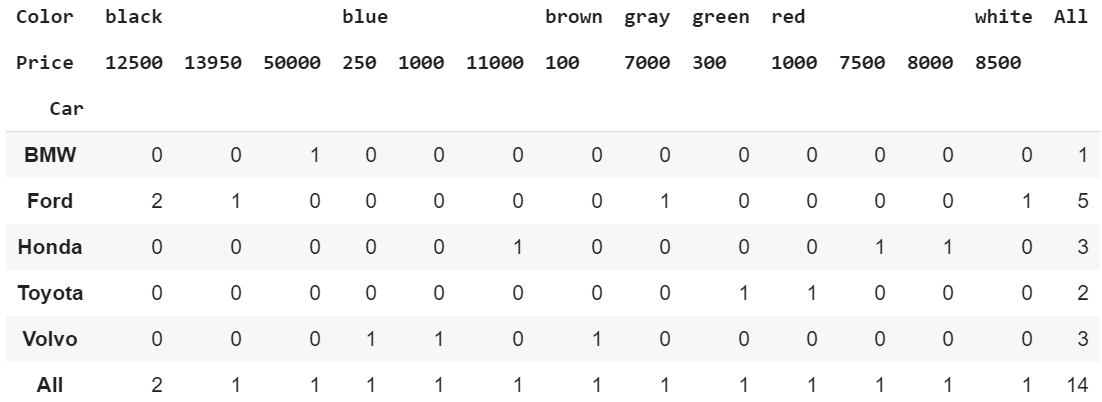
Something Interesting!
Depending how we specify the parameters we can create the same values for pivot tables and crosstabs.
Pivot Table <==> Crosstab
#Pivot Tablepd.pivot_table(df, index=’Car’, columns=’Color’, values=’MPG’, aggfunc=’count’, fill_value=0)#For the values parameter, I could have used ‘Name’ or ‘Priceand still get the same result.#Crosstabpd.crosstab(index=df[‘Car’], columns=df[‘Color’])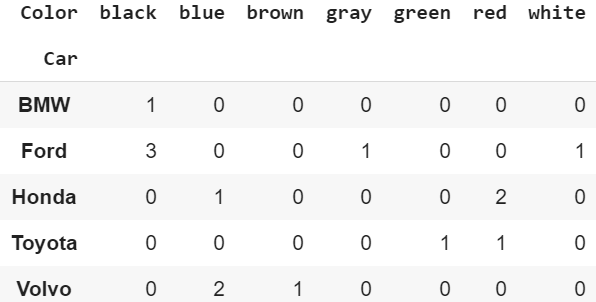 Pivot Table and Crosstab#Pivot Tablepd.pivot_table(df, index=’Car’, columns=’Color’, values=’Price’, margins=True)#Crosstabpd.crosstab(index=df[‘Car’], columns=df[‘Color’], values=df[‘Price’], margins=True, aggfunc=’mean’)
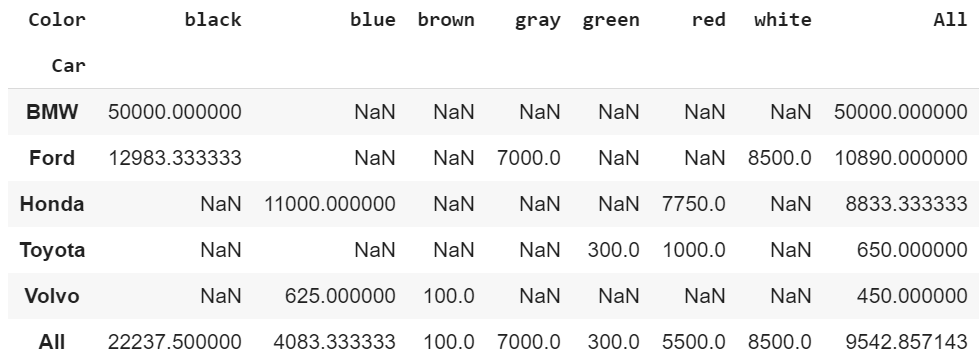 Pivot Table and Crosstab
Pivot Table or Crosstab?
Choose how you want to represent the data. At bare minimum, the pivot table compares the index and yields numerical values. Additionally, the crosstab compares the index and columns which yield the count.
