A glimpse into how Google Maps works
When I worked on Google Maps as a UX Engineer, one of the things I really wanted to be able to do was create prototypes that could synchronize animations with zoom. However the JavaScript Maps API has limited control of the zoom, so in order to have more control, I experimented with using HTML5 canvas to composite the tiles in a fully custom implementation.
To understand what makes smooth zoom challenging for modern map applications, it helps to first understand how the map is made, and how Google Maps (and most of the other) map clients work ? you can search for the bolded titles to go straight there.
- Making the Earth flat ? the process by which a 3D globe is turned into a 2D map.
- Google Maps ? how Google changed the world of mapping in 2005, and how the client renders.
- Animating the rasterized map ? the custom approach I used to enable smooth animation.
1. Making the Earth flat
I hope it won?t come as a surprise to anyone, but the world is round ? although curiously enough, it is not actually a sphere, but rather slightly squished and wider at the middle.
The process of taking this mostly-spherical object and representing it in 2D is something that cartographers have been struggling with, and arguing over, for millennia. There is actually no ?best? way to do it, each comes with tradeoffs.
Latitude and Longitude
If you imagine the world as a sphere rotating around its axis, the north pole is at the very top, the south pole is at the very bottom, and the equator is the imaginary line that runs around the middle.
 Graticule
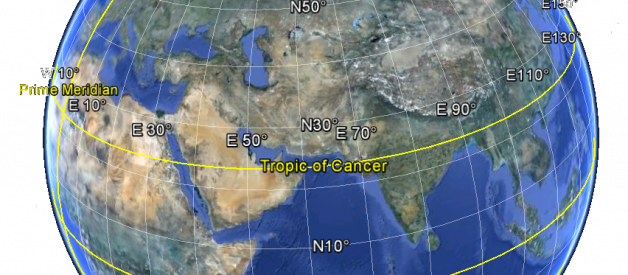
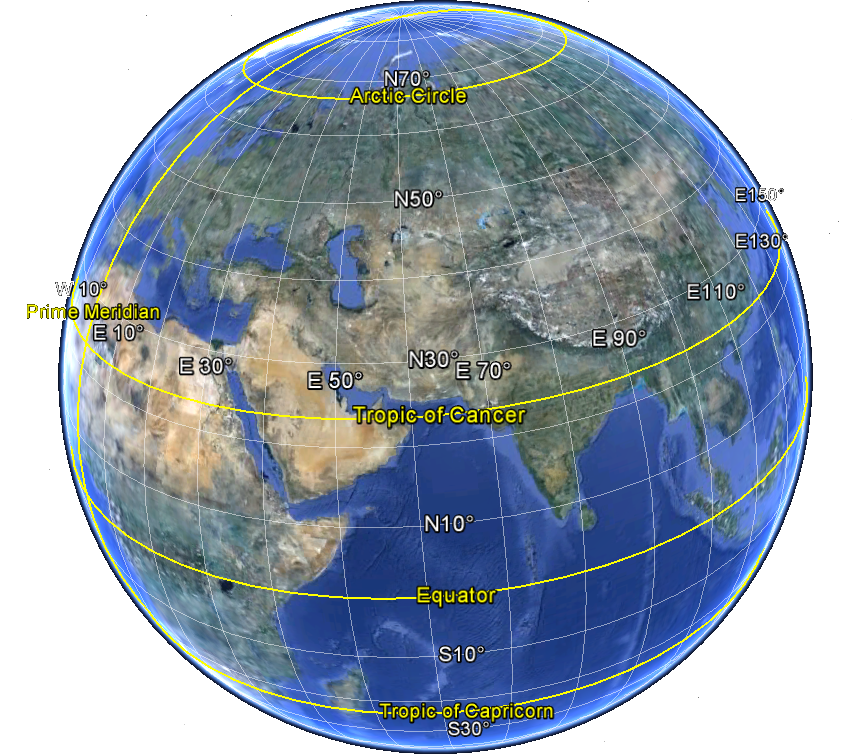
If you think of the equator as a circle that sits horizontally (like a belt), then you could imagine additional horizontal circles above and below, each of these parallel to the equator. Following any circle to the right you move due east, following any circle to the left due west. These imaginary lines are called circles of latitude. The latitudes are always the same distance apart from each other, no matter how far east or west you travel.
Because the earth is tilted on its axis, the sun doesn?t always sit directly above the equator, but appears to wander slightly north and south during our orbit. The Tropic of Cancer is the north-most circle of latitude at which the sun can appear directly overhead (on the June solstice), and the Tropic of Capricorn is the equivalent in the southern hemisphere (and the December solstice). That?s not actually important for Google Maps, but it?s fun trivia.
Latitude denotes how far north or south you are (because no matter how far east or west you go you have not moved north or south at all).
Running in the other direction, perpendicular to the equator, are the meridians, or lines of longitude ? each connect the north pole to the south in a straight line. Following any line up you move due north, following down due south.
Longitude denotes how far east or west you are (because no matter how far north or south you go, you haven?t moved east or west at all).
The crucial difference between latitude and longitude is that while latitude is always an equal distance away on a sphere, the lines of longitude are farthest apart in the middle (the equator) and get closer together near the poles (where they touch).
 Measuring latitude and longitude
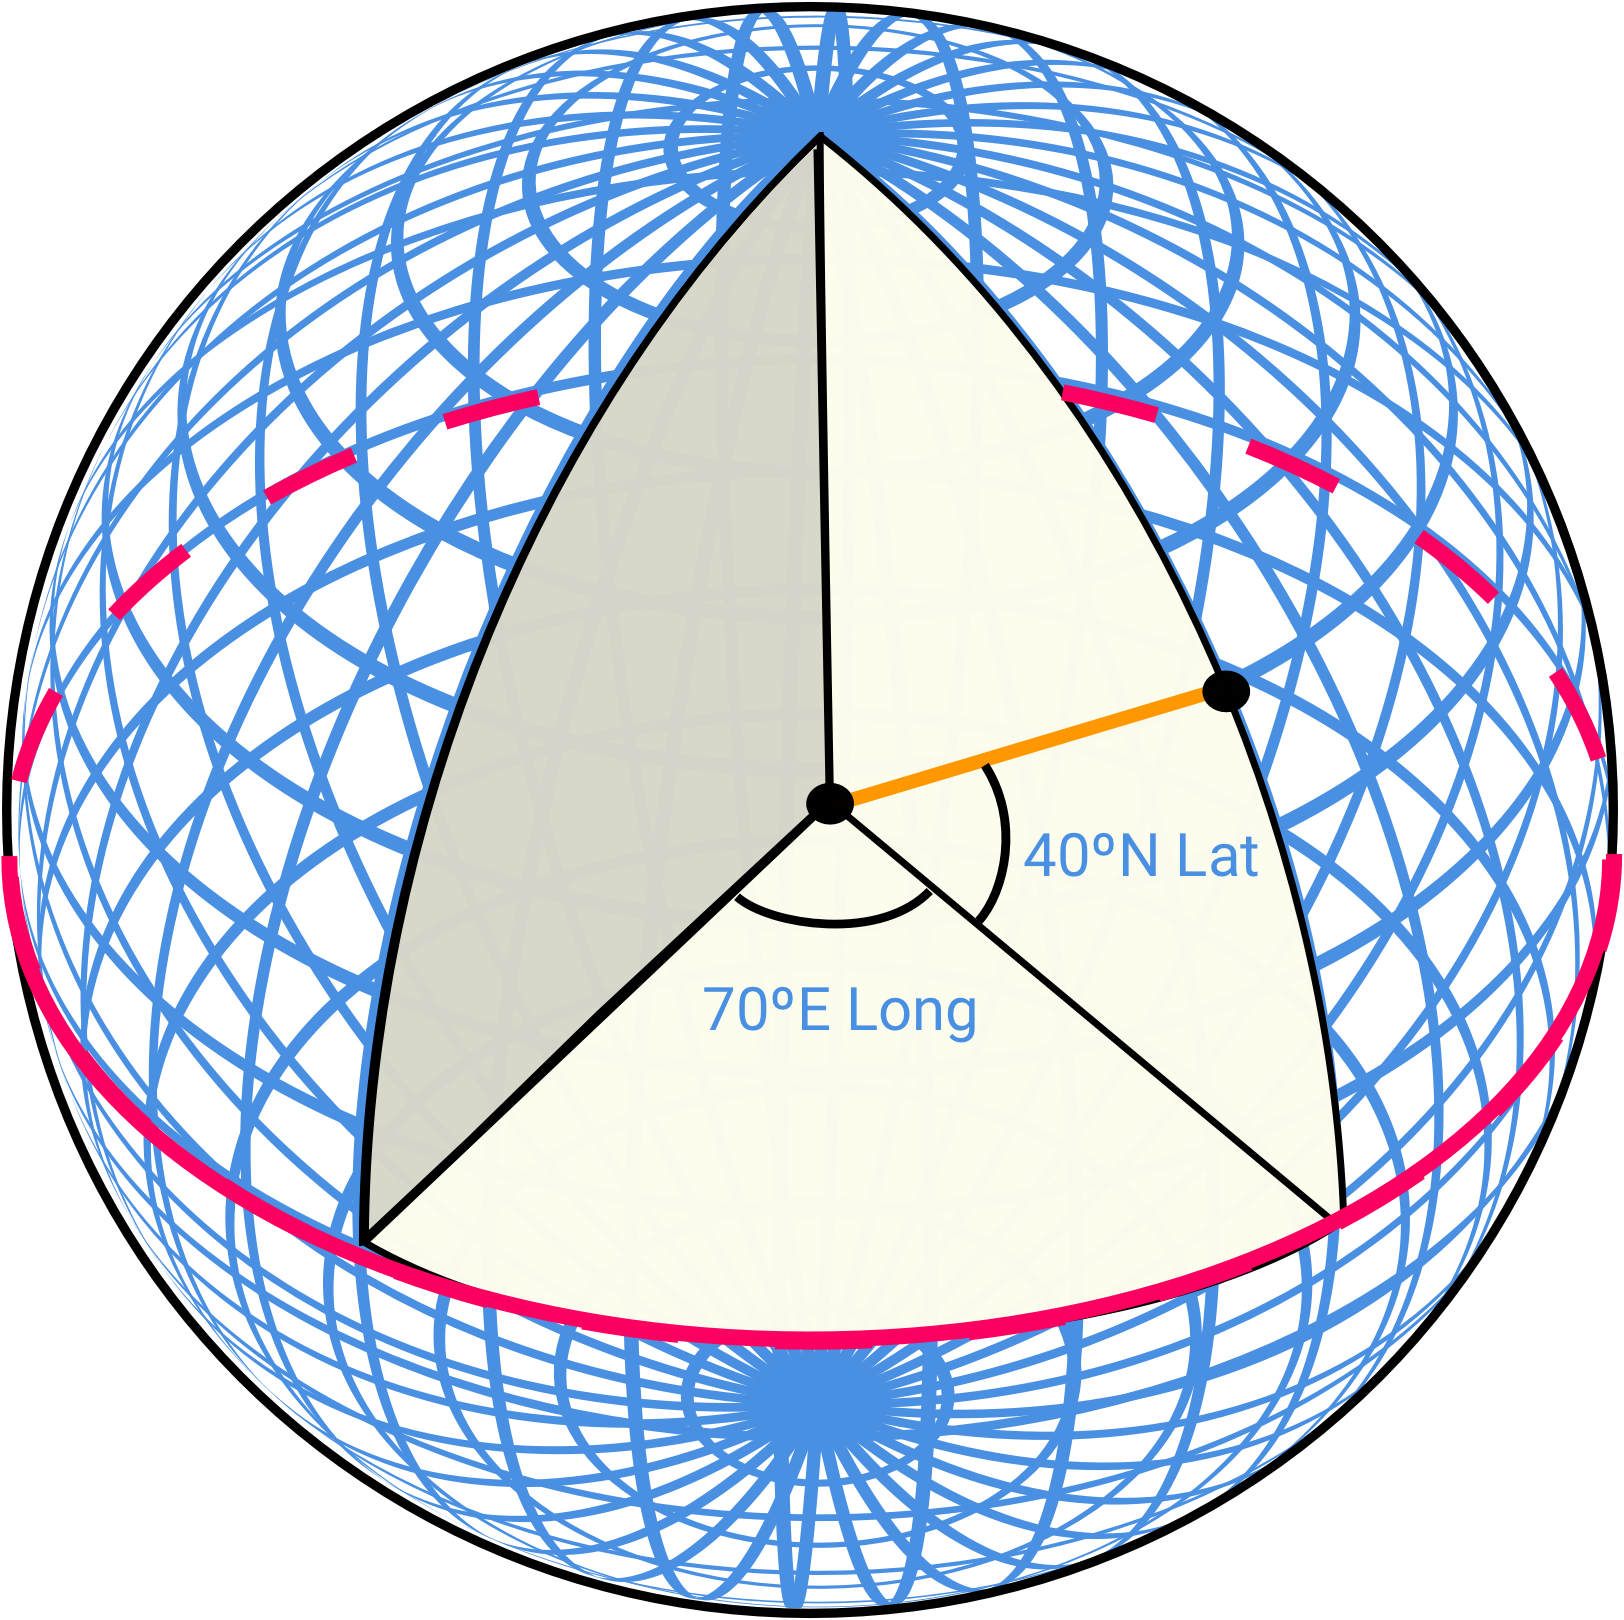
Both latitude and longitude are measured in degrees. Starting from the center of the sphere you just measure out the angle on each circle (the parallel circles of latitude, and the perpendicular circles of longitude).
Latitude is the angle formed from the equator, so it?s 0 at the equator, and up to 90 North or South (at the poles). Halfway towards the North Pole would be at 45 N.
Longitude is the angle measured from the Prime Meridian (an arbitrary line that runs through Greenwich, England). It?s 0 in Greenwich and up to 180 East or West (the opposite side of the world).
Global Positioning
A final bit of trivia, that doesn?t really matter to Google Maps (but I find interesting nonetheless), is how people located themselves prior to GPS.
Latitude is relatively simple, you just need to measure the angle between the horizon and a known star (or our sun) and then do a little math. People have been navigating based on the stars for thousands of years, Polaris (the North Star) is especially popular ? at the North Pole, Polaris is directly overhead (at 90 to the horizon). At the equator, Polaris appears to sit on the horizon (at 0). In-between these two extremes the angle to Polaris is the angle of latitude North. You can use others stars too, they just require more math.
Longitude is much, much, harder ? in fact so hard that nobody could do it well until the late 1700s (nor easily until much later than that). The solution involves time ? the earth rotates at the same speed, 360 every 24 hours (or 15 per hour), so if you know the time where you started and the time where you are, you can calculate the distance based on the difference. Easy to do today, with accurate clocks, but very hard to do previously.
Originally, they used the predicted positions of celestial bodies at known times to calculate what the time was, and then compared that to the local time (using the sun at noon to reset the ?local clock?). The most widely used set of predictions was the Nautical Almanac published by the Royal Observatory in Greenwich, England ? which, if you?ve ever wondered why it was called GMT (Greenwich Mean Time), or why the Prime Meridian runs through Greenwich, it?s because for the longest time everyone was measuring relative to the observatory in Greenwich.
The biggest breakthrough in measuring longitude was more accurate clocks so they could cease the stargazing and just check GMT? longitude was the number of hours difference multiplied by 15. In fact this is pretty much how everyone calculated longitude until the invention of the Global Positioning System (GPS), which is just a set of super accurate atomic clocks sitting in space (and some impressive math).
If you?re half as fascinated by this as I am I?d really recommend reading this great book about it.
Picking a Projection
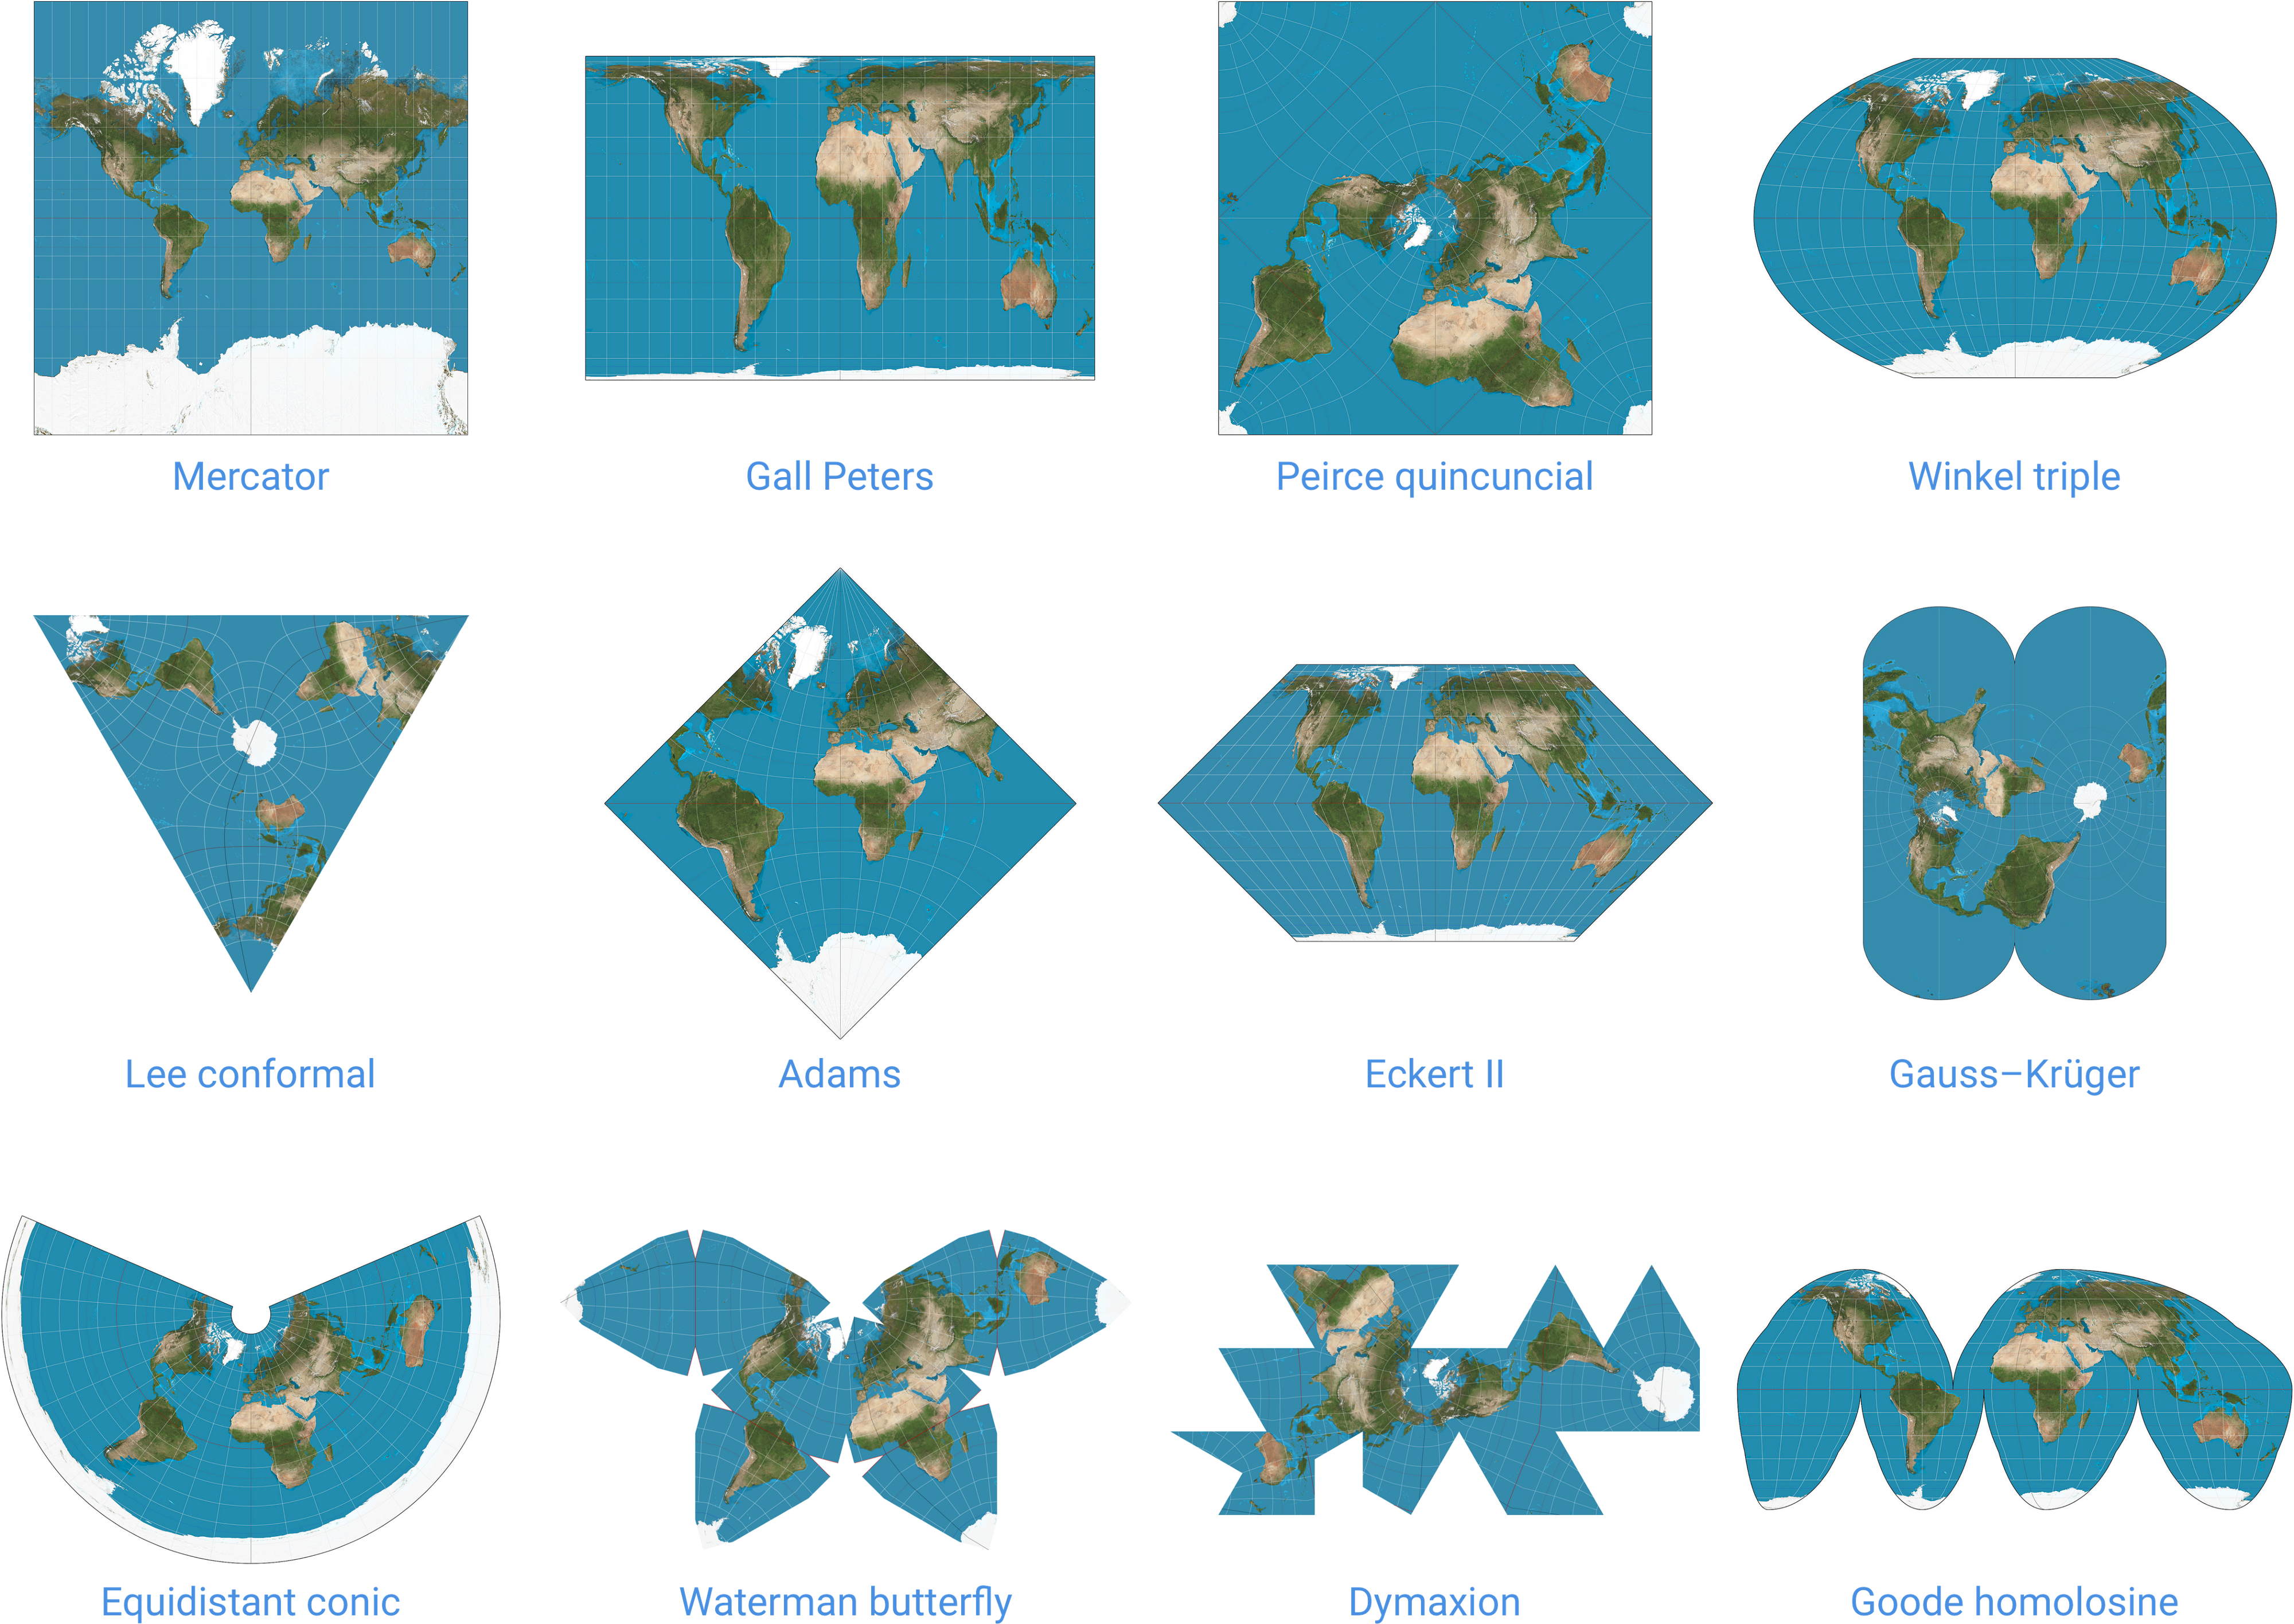
The method of translating the points on a 3D globe to a 2D plane is called a map projection. There are many different projections, each with their own strengths and limitations, and none without some form of distortion to the actual geometry ? here are just a few:
 Projections on Wikipedia
The projection that Google Maps selected is a modified version of the Mercator projection, creatively titled Web Mercator [the main difference is it assumes the world is a sphere, instead of a flattened ellipsoid].
There are a few reasons for picking Mercator, but the best reason is that north and south are straight up and down, and east and west are straight left and right ? on some of the other projections these lines would curve or deviate as you move across the map. This is very similar to the reason Mercator was so widely adopted for navigation ? lines of constant course (ie if you pick a compass bearing and stick with it) are completely straight. A side benefit is that because it?s a cylindrical projection, you can wrap horizontally and tile the map.
Some of the other special properties of the Mercator projection are that the scale is the same in every direction around any localized point (ie if you zoom into a city, the distances north and south are the same as east and west) and all angles are depicted accurately (ie east is 90 from north).
The biggest criticism of the Mercator projection is that it significantly distorts the scale of countries the farther you get from the equator (eg Greenland looks as big as Africa, despite being less than a tenth of the size).
Think of what happens when you peel an orange, and then imagine doing the same to the earth. If you were to cut along the series of longitudinal lines you would end up with an assortment of wedged slices ? on the globe each vertical line appears straight, but as you unwrap it to two-dimensions it becomes curved (remember how those lines of longitude got closer together at the poles?).
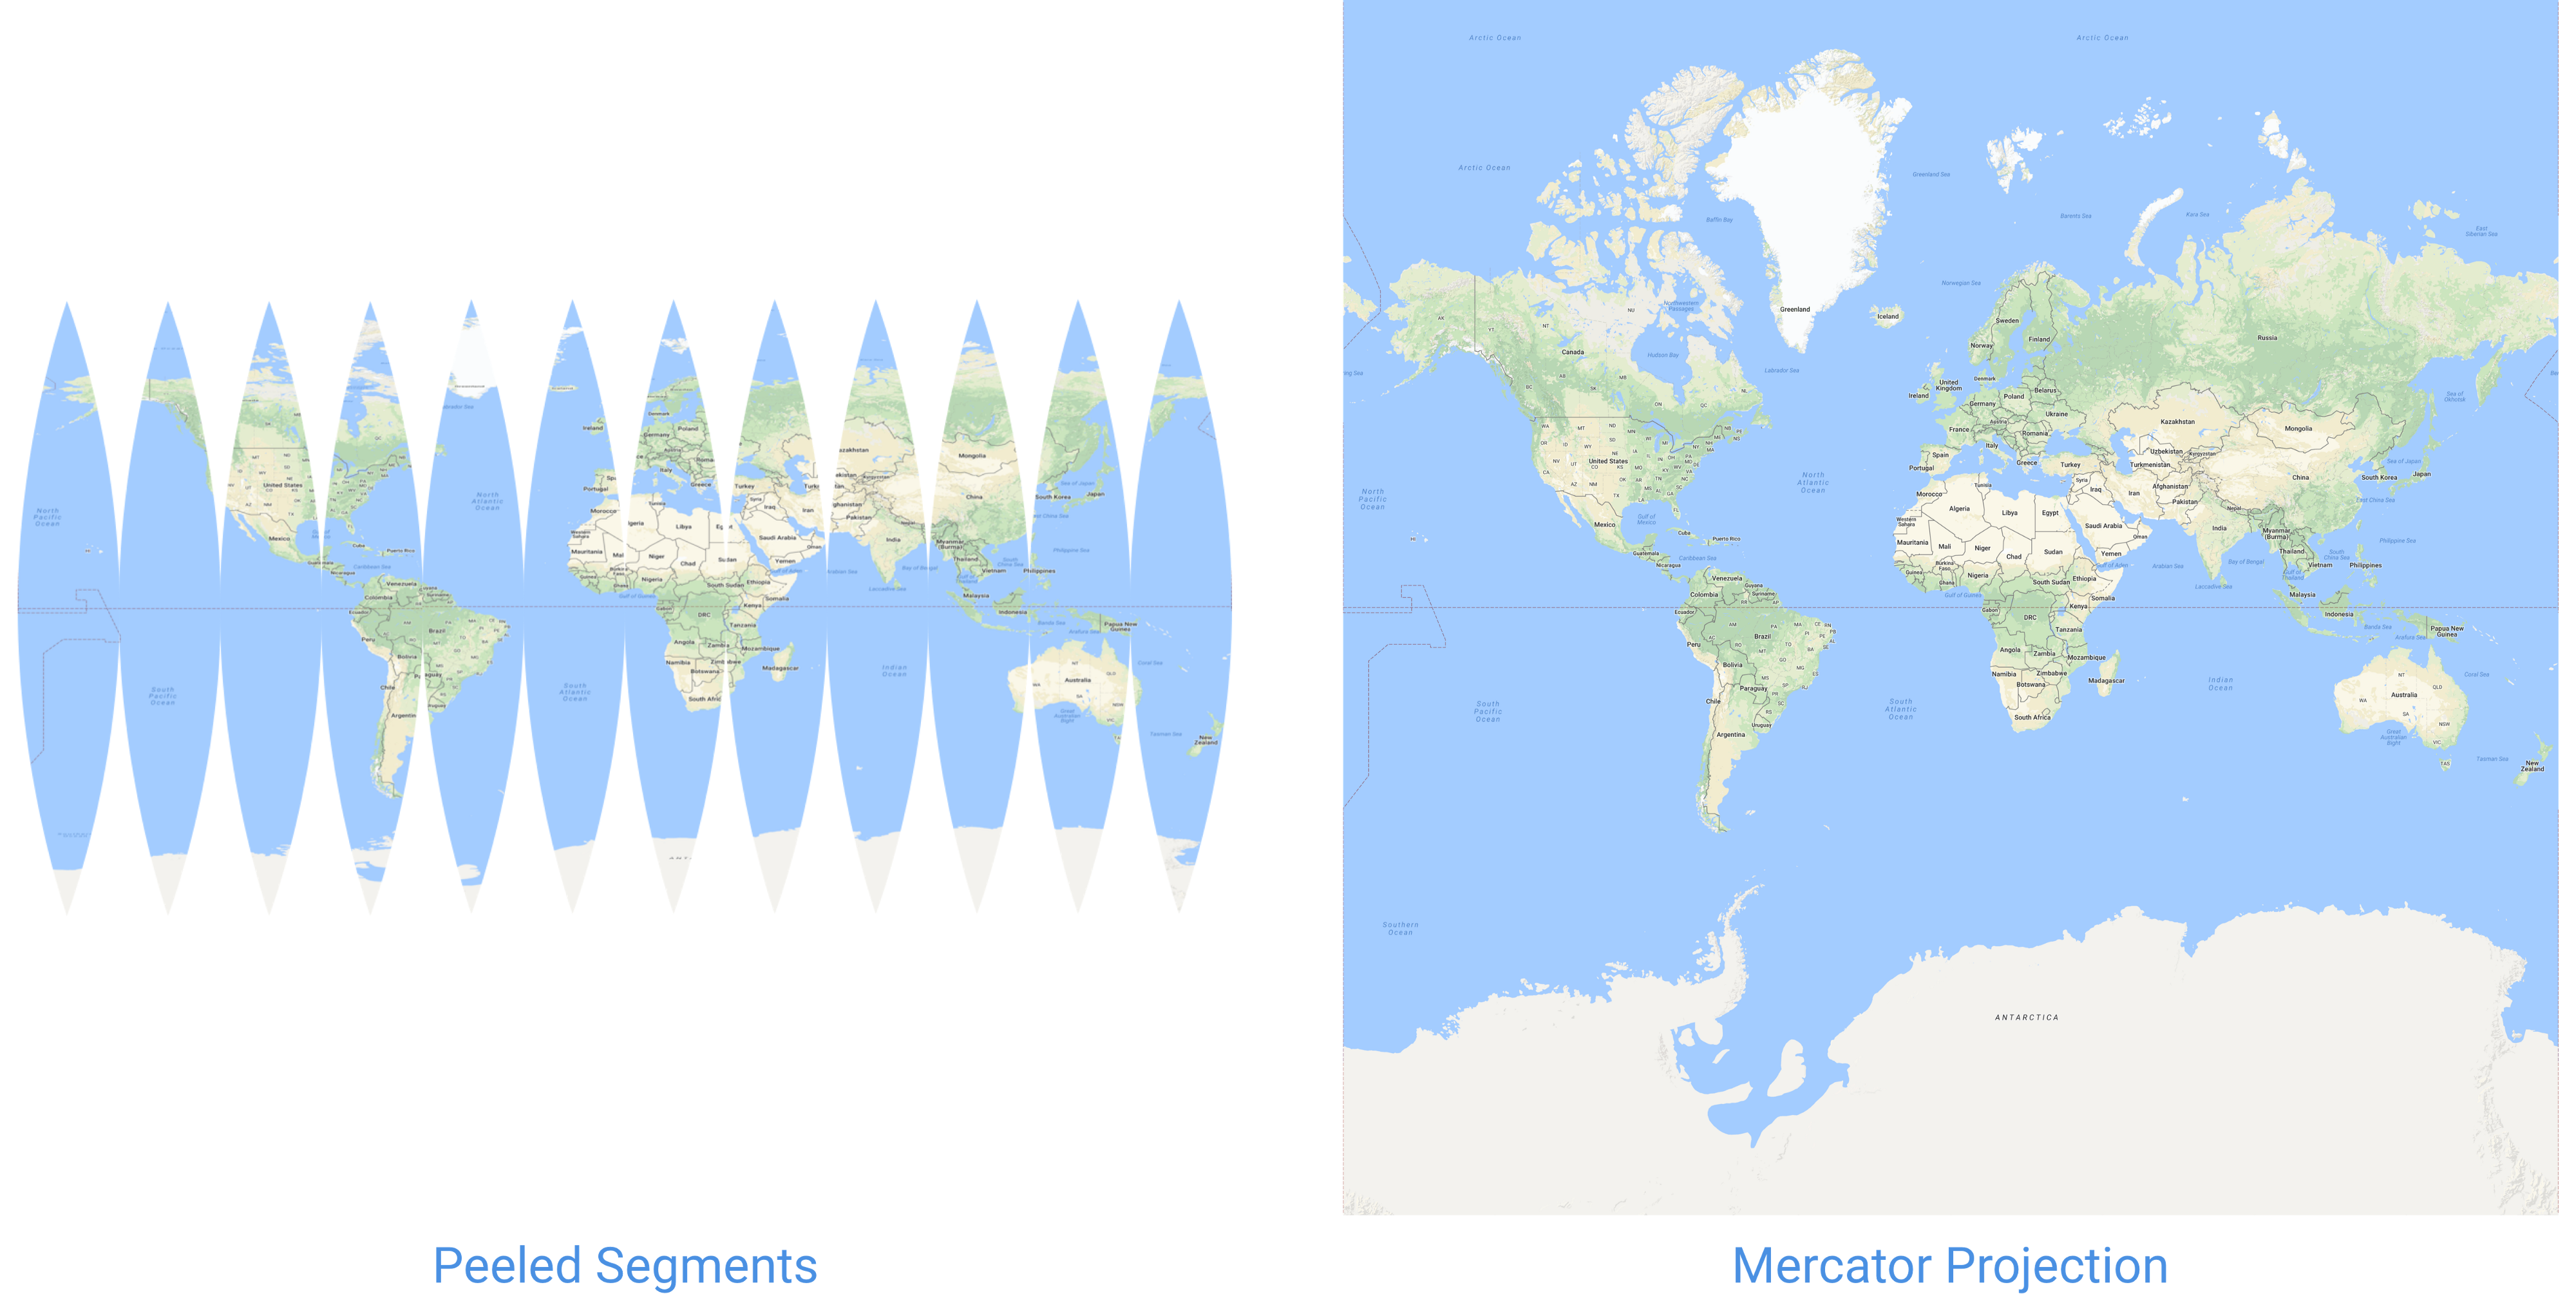 Unwrapping the globe
To make the Mercator map join up again, we need to stretch those segments horizontally. At the equator they?re already touching, so they do not need to stretch at all, but at the poles there is a really big gap and they need to stretch a lot (technically infinitely). To preserve the distances and angles in both directions as it stretches horizontally it is stretched by the same amount vertically. The closer it gets to the poles the more it needs to stretch.
This is a little easier to visualize if you try and draw a circle of the same size at various points on the map. For the Mercator projection you can see that the circles appear much larger towards the poles (although in reality they?re the exact same size). This is because we needed to stretch the map more at the poles to make it connect up.
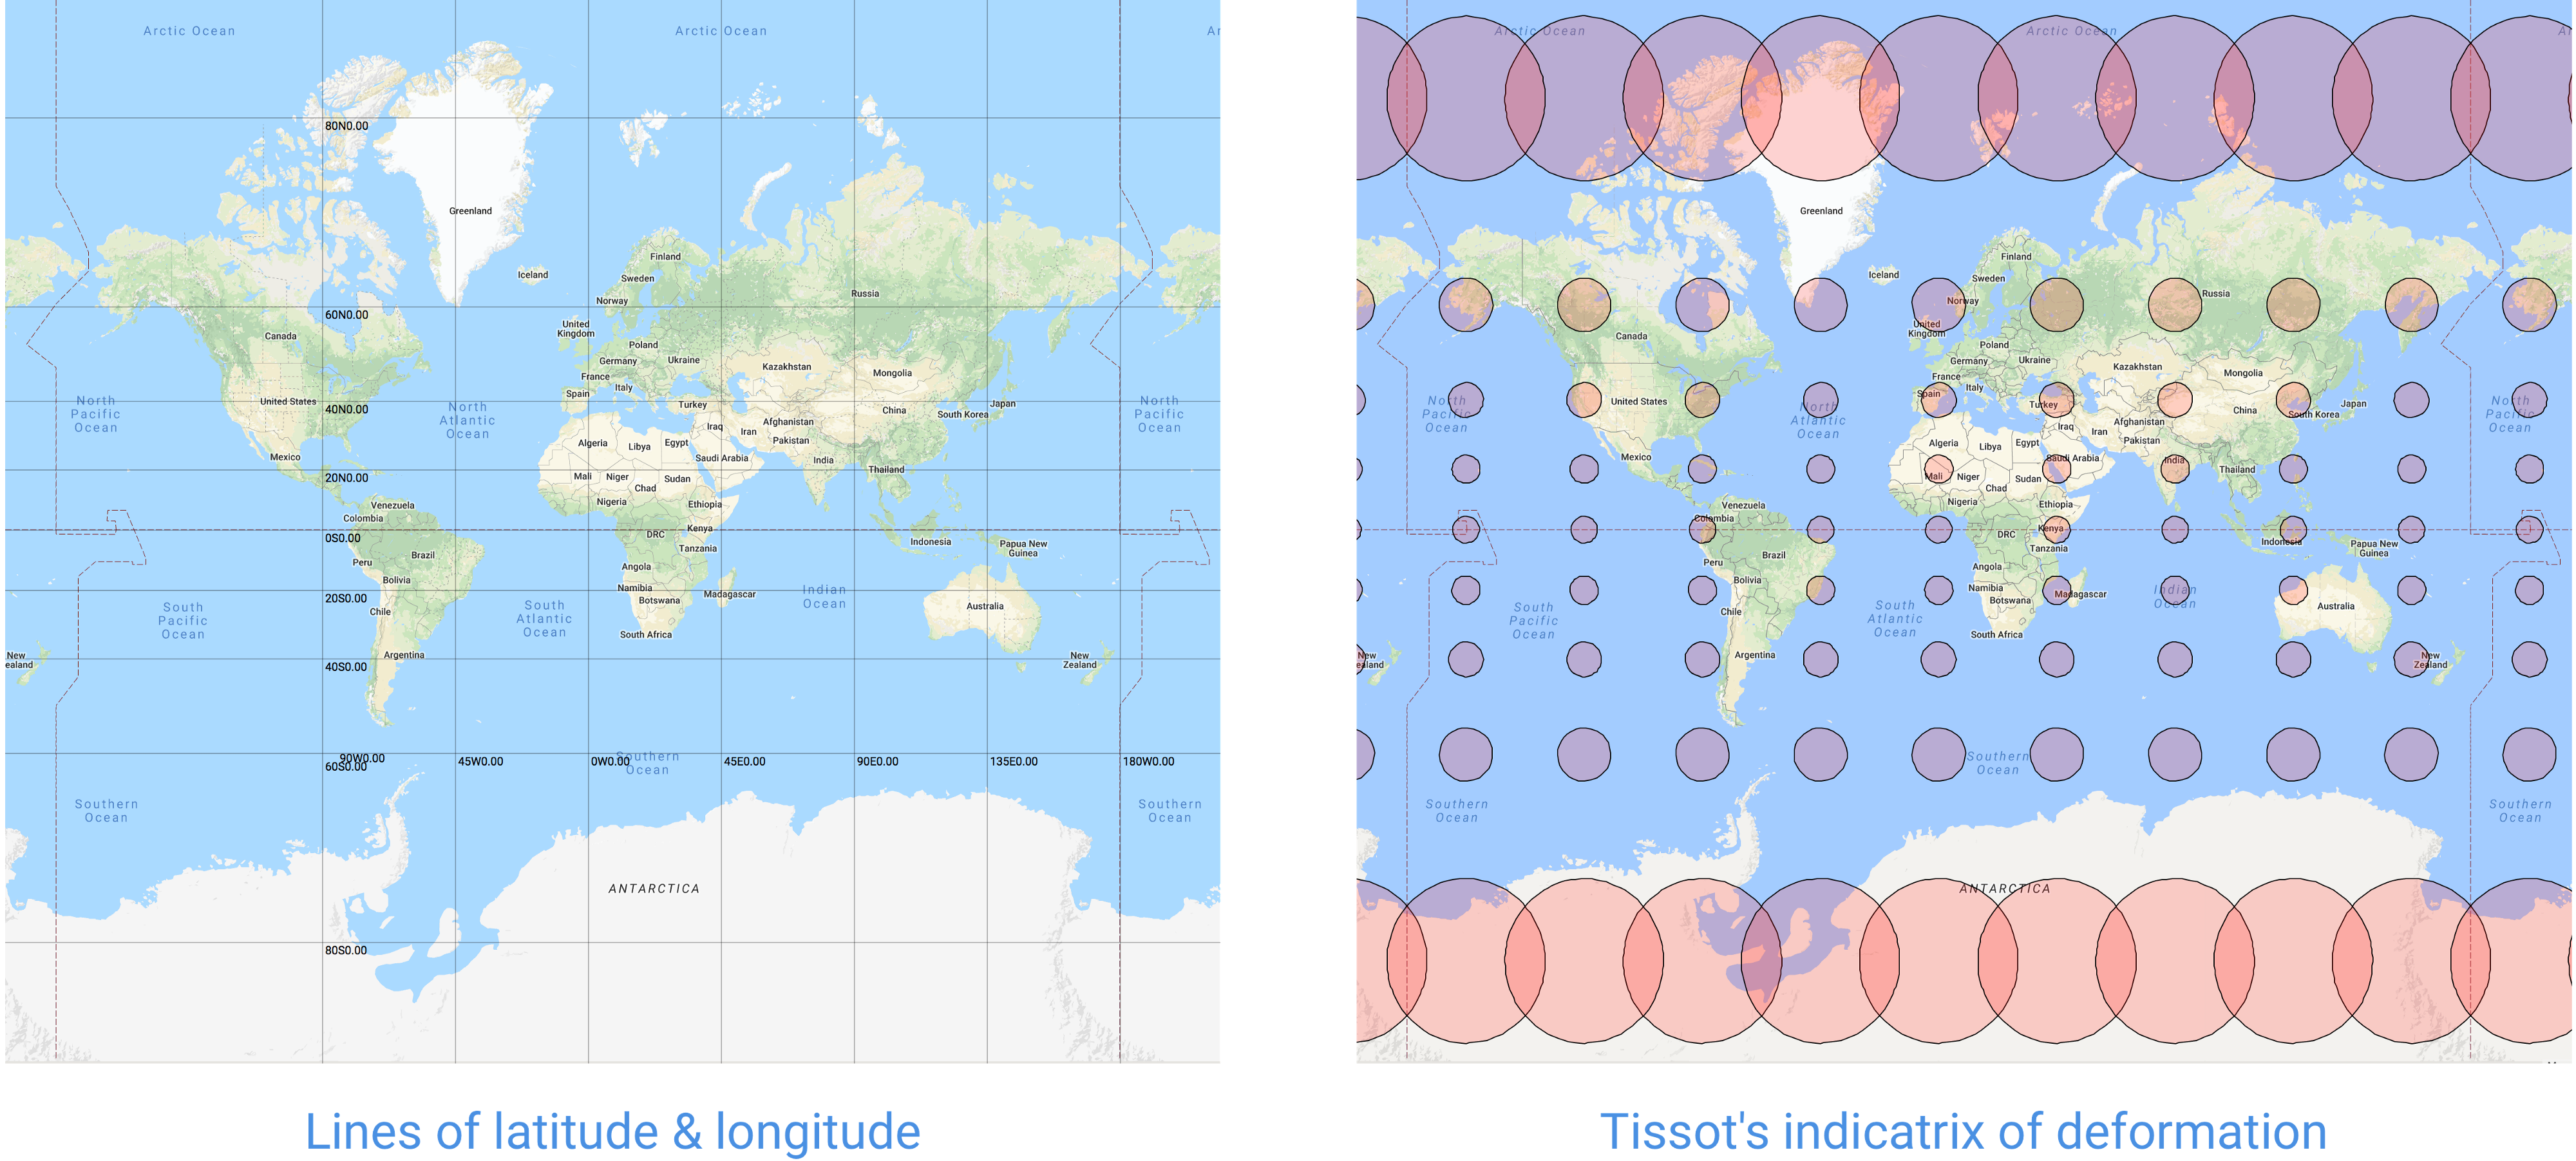 Deformation of scale
This really only matters when very zoomed out, because the scale is the same in any localized region, so for a given city or even country everything remains proportional. And it?s really only a significant problem for the poles, but since penguins and polar bears don?t use Google Maps there hasn?t been much complaint.
If we think back to the sphere ? where lines of latitude were parallel to each other, and always the same distance apart, while lines of longitude got closer together at the poles ? with Mercator, latitude remains perfectly parallel, and longitude becomes perfectly perpendicular. Everything is straight.
This fantastic video by Grafonaut demonstrates the entire transformation:
Translating a 3D globe into the 2D Mercator projection
2. Google Maps
In 2005 Google Maps launched using an innovation that still underpins every single mapping service today ? the tiled map. In 2013 there was a major update to use WebGL and add client-side rendering, but the tiled approach remains.
I should note that Google Maps didn?t invent the concept of the tiled map, but it was perhaps the first mainstream application to use it, and combining it with AJAX and the web certainly helped popularize the approach.
Tiled Maps
Instead of trying to render a single image, Google breaks down the map into smaller tiles, and then places them next to each other to make up a single bigger picture ? just like a mosaic.
 Tiled Map
The primary reason for this is image size. At the highest zoom level of Google Maps the image would be over 500 million pixels square (double that on HDPI screens), which is more than 25,000 terabytes (I think?) even with generously optimistic image compression. Assuming your browser could render that image, it would take you more than 6 years to download using Google Fiber.
The second reason is the server load. Instead of using tiles, the server could generate a perfectly sized map for each user, at the exact zoom level, latitude and longitude, and the right size to fill their window. But that would probably mean each user needs a completely custom map, and with over 1 billion monthly users, that?s a lot of custom maps! It would also mean that every time you panned the map even a few pixels you?d need to download a completely new map.
The nice thing about tiles is everyone can share them, the server can cache them (and even pre-generate them), and the client can easily move them. Some users may download a few extra tiles if their window is bigger, but the tiles still only need to be rendered once.
Note: for the 2013 vector based WebGL implementation, instead of sending image tiles, the server sends the vector information (each path and polygon) and the client renders the imagery. However this vector information is still grouped into ?tiles? ? for the exact same reasons (allows server caching, and provides a clean way for the client to subdivide data requests). While the following sections discuss the raster implementation (which is still used by the Maps JavaScript API) the general approach also applies to the WebGL version.
Zoom Levels
Google Maps has a varying number of zoom levels based on the location ? but it?s usually about 21. At the most zoomed out (level 0) the entire map is represented by a single 256 by 256 pixel square tile. At every incremental zoom level the map doubles in size in each direction ? each tile is replaced by 4 more detailed ones (2×2) when zooming. Each tile is still only 256 by 256 pixels, and when you combine them together you get the same map (only more detailed).
At zoom level 0 the world map is a single tile, at zoom 1 the map is 2 tiles in each direction, at zoom 2 it is 4 tiles wide, at zoom 3 it is 8 tiles wide, and so on (doubling each time). So while the total width and height doubles each level, the area goes up more rapidly (1 tile, 4 tiles, 16 tiles, 64 tiles, etc?). By the time it hits zoom level 21 the map is 2 million tiles wide, and contains more than 4 trillion tiles in total.
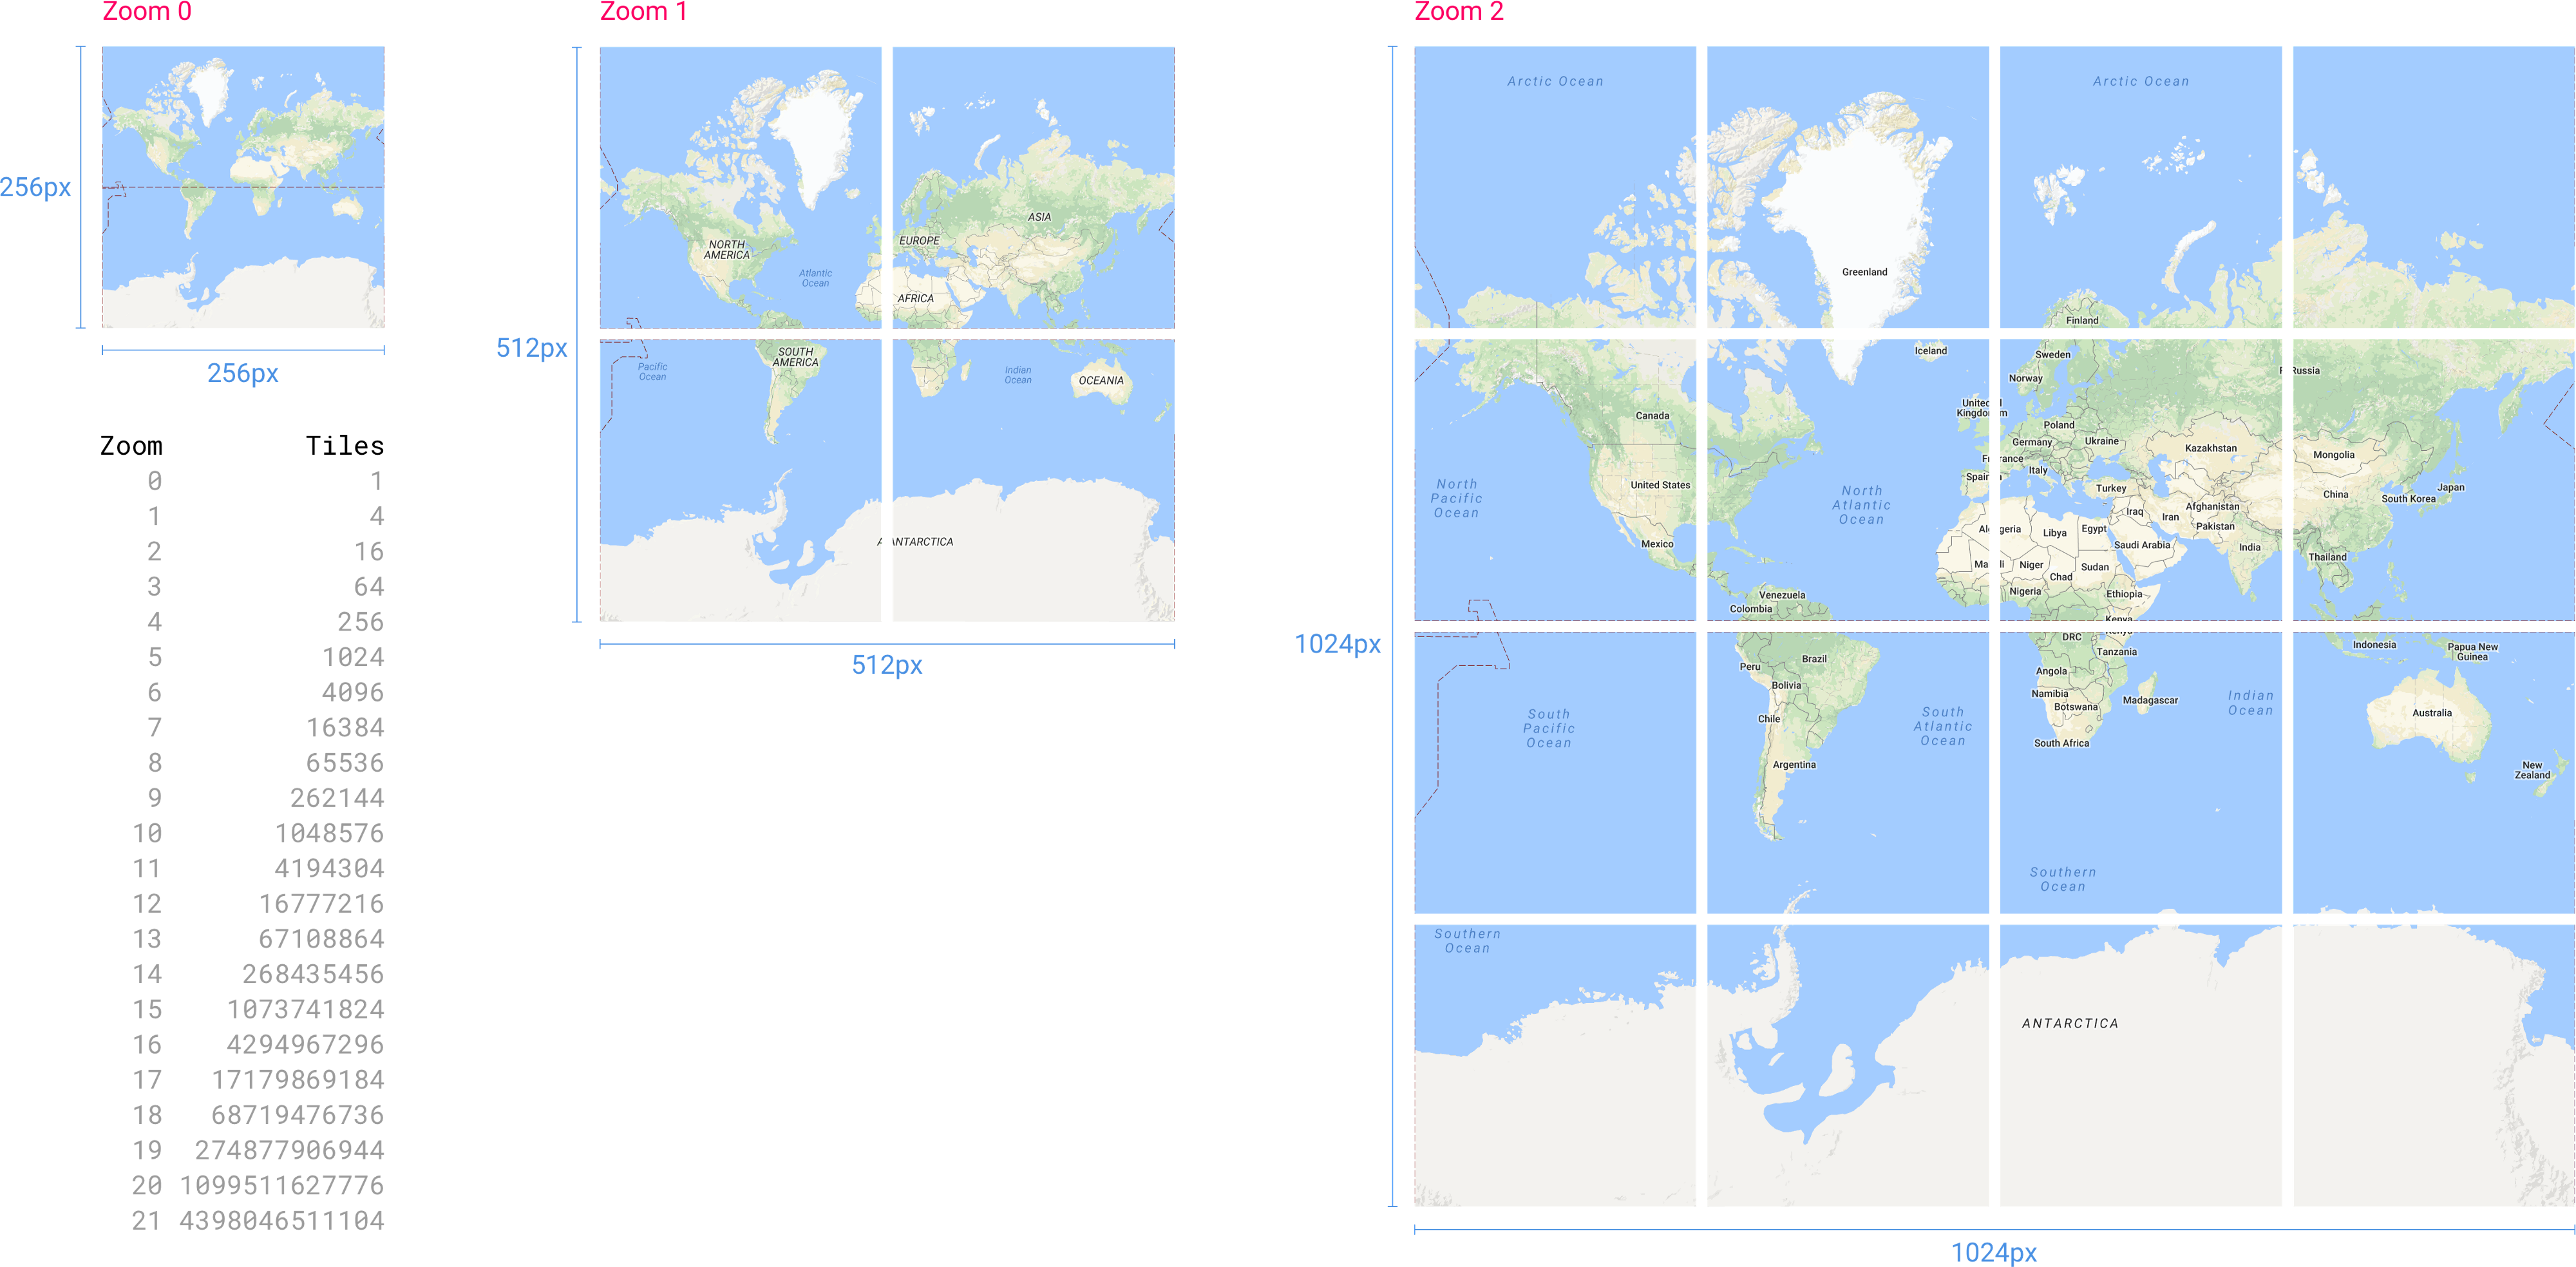 Map tiles at each zoom level
Each zoom level gets its own style rules to decide what information should be shown. There is little value adding road information to the world map, nor building information to the country map, etc? There is a very hardworking team who constantly balance the labels and features that are presented and styled at each level.
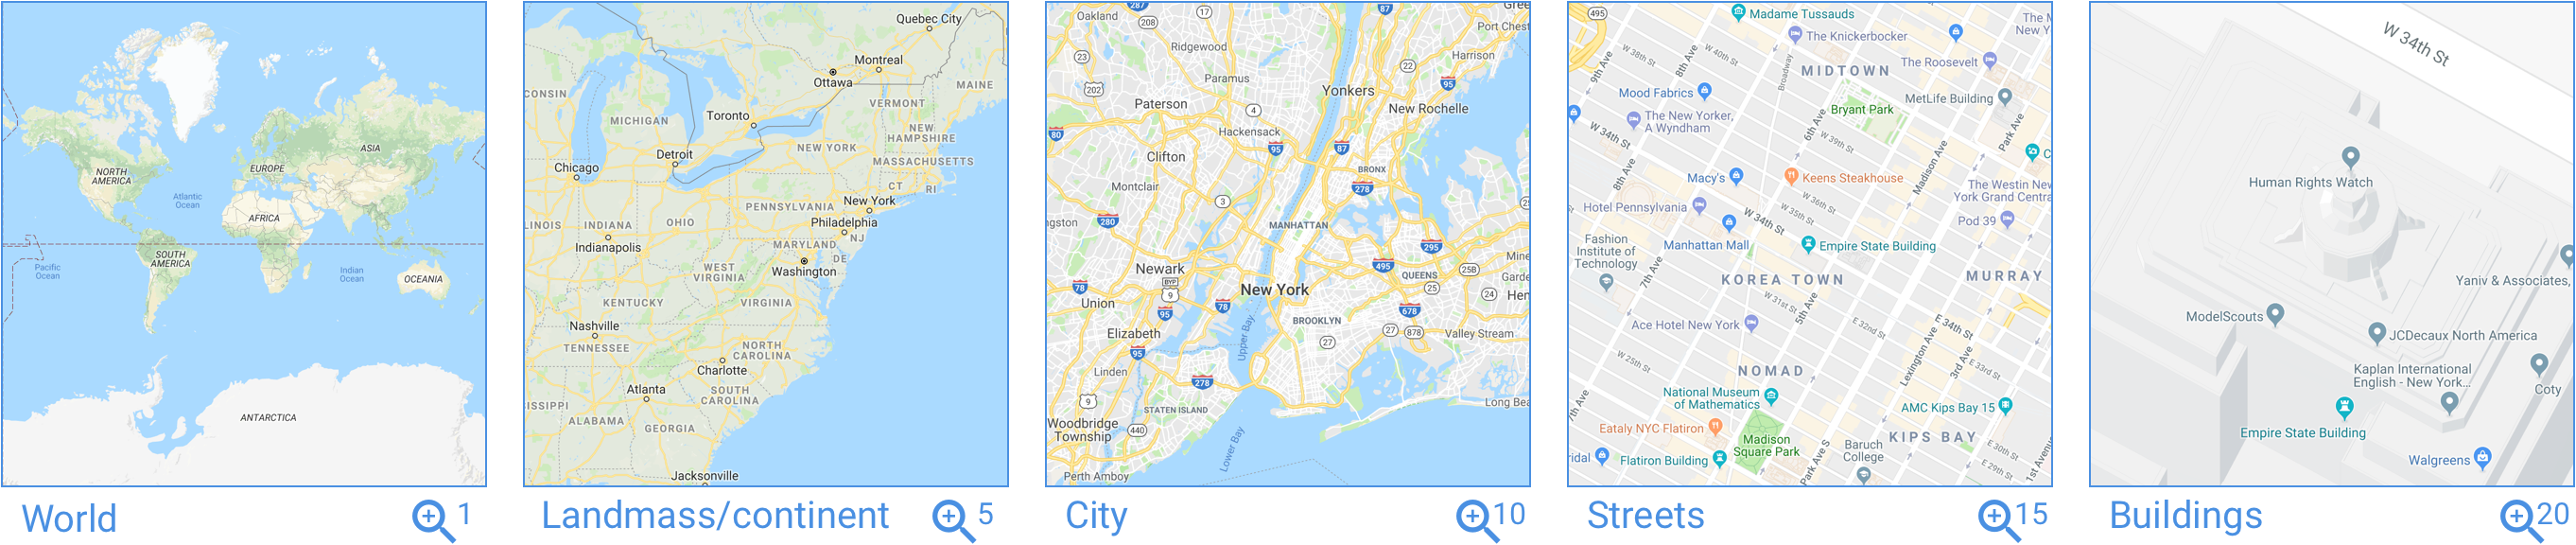
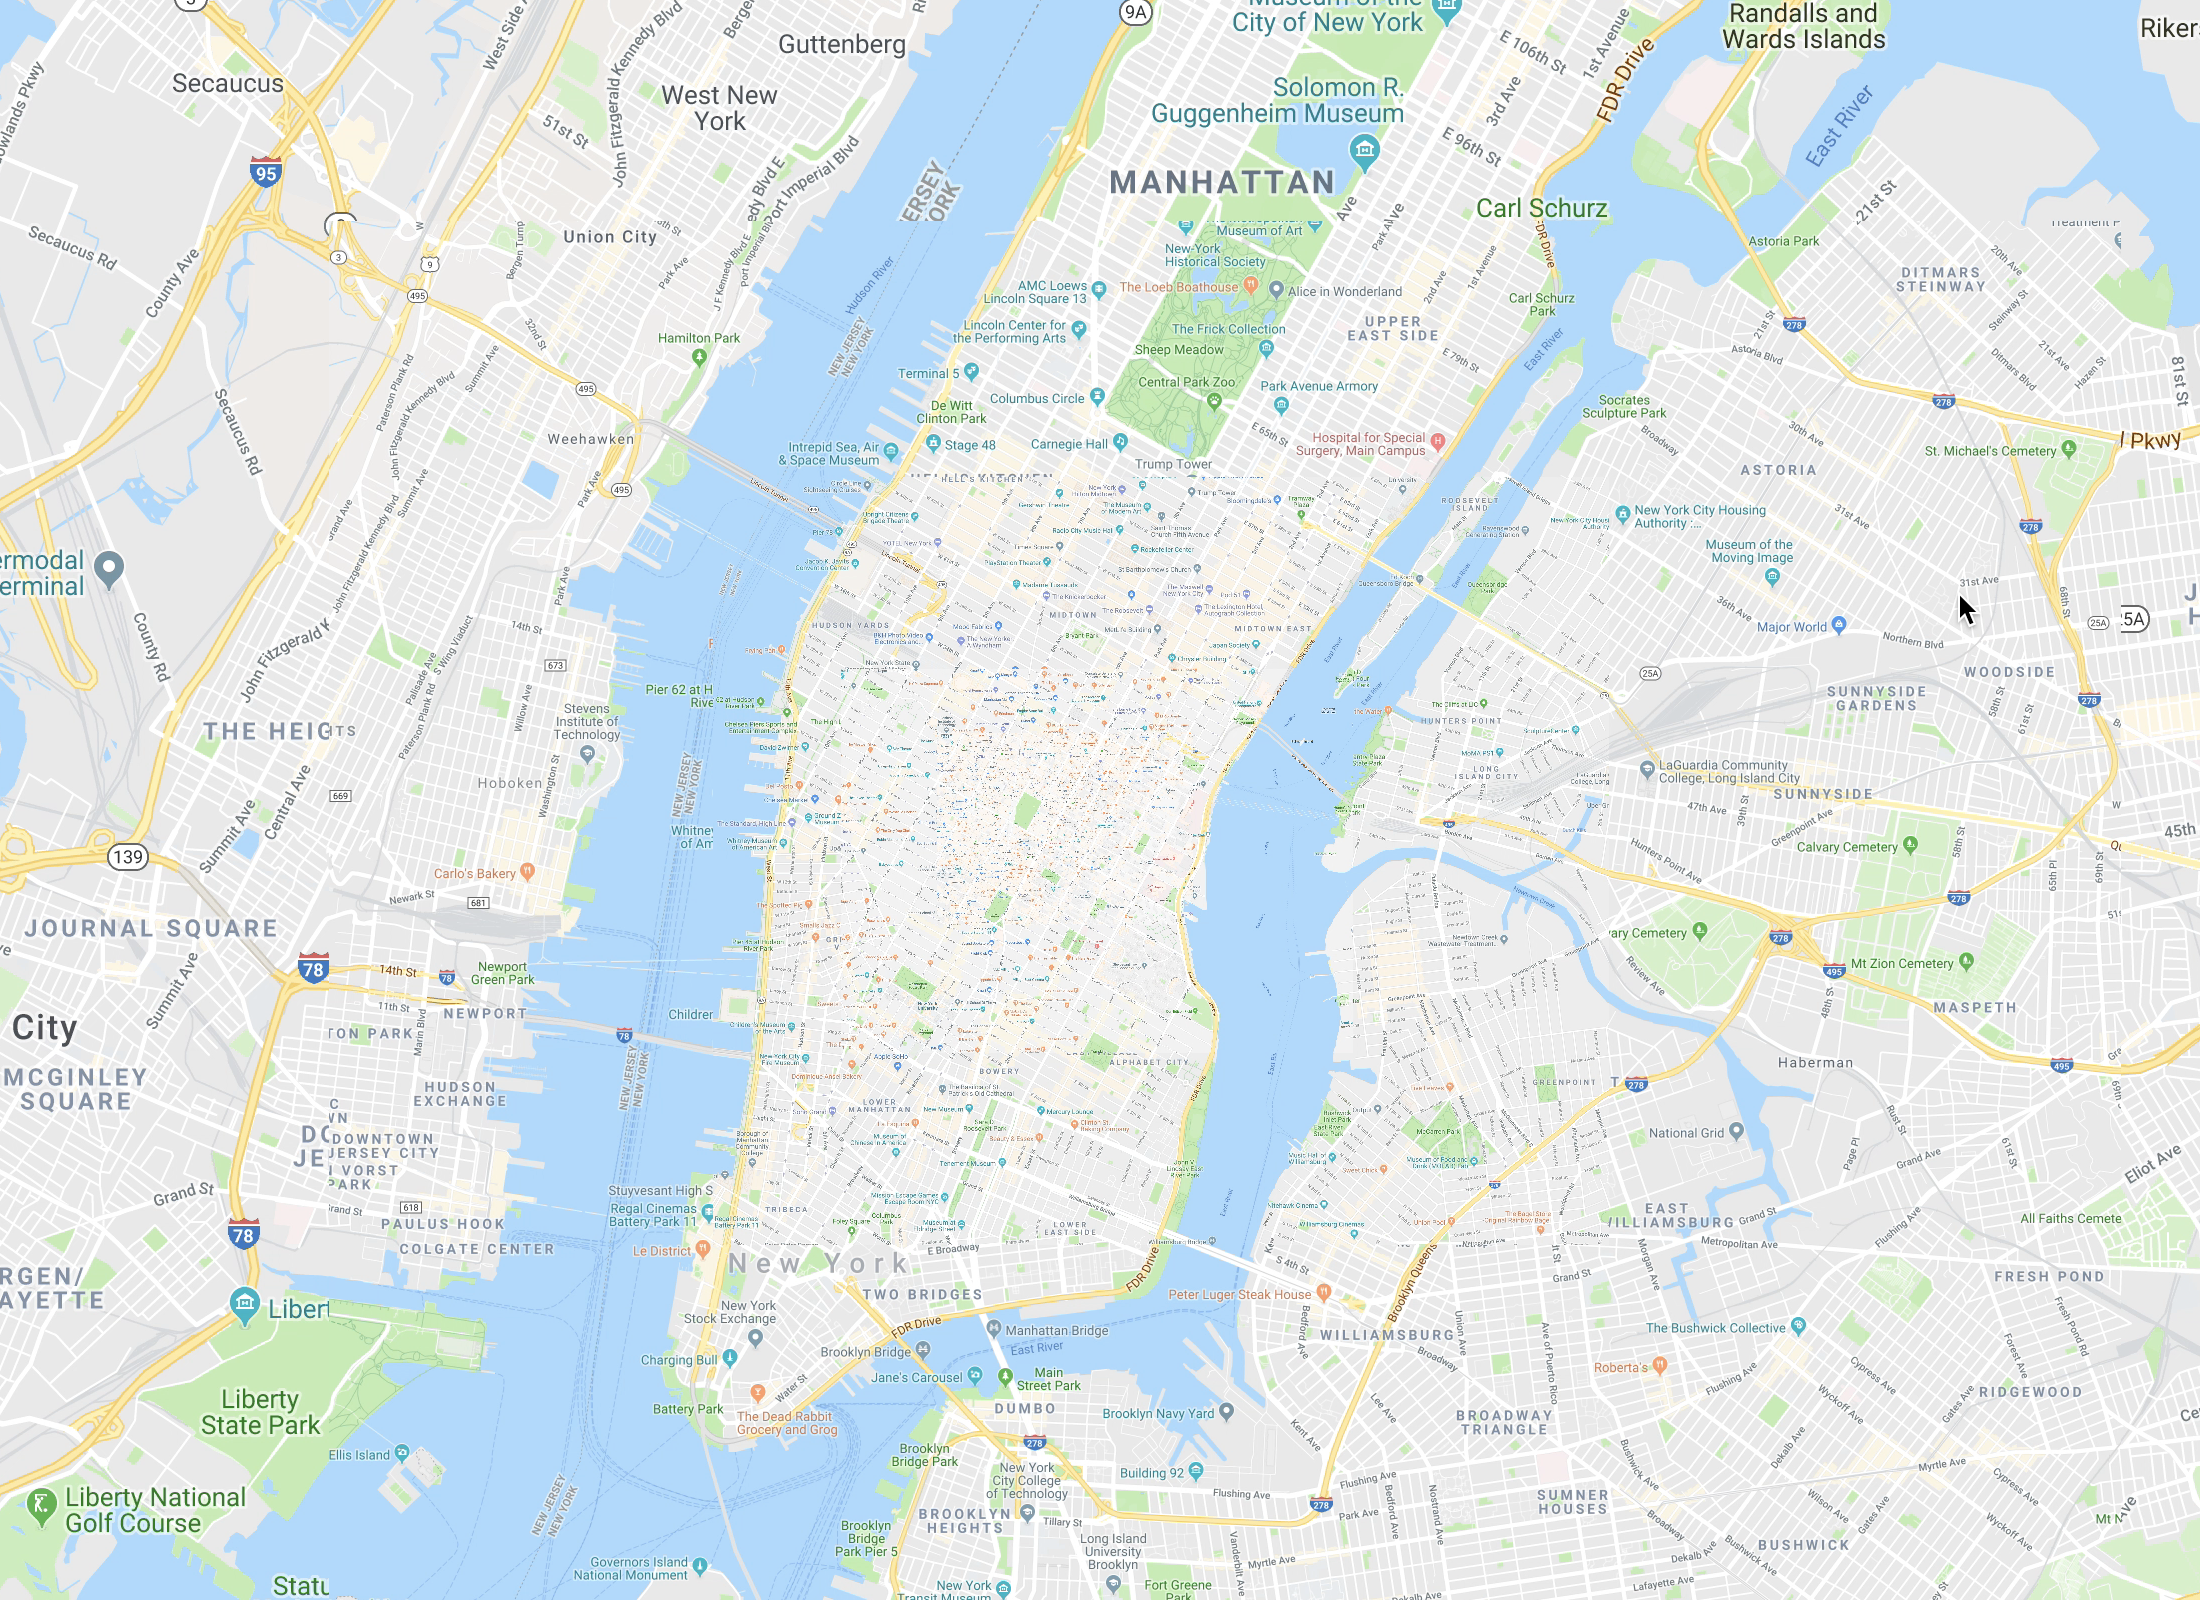
As a general rule of thumb the first few levels are pretty much just the world map. At zoom 5, the continents and landmasses are the primary features. By level 10, the city details emerge. At level 15, the streets are clearly visible. And by zoom 20, the buildings are all rendered.
We can easily estimate the pixel scale for these zooms?we could do it precisely with more complex math?but at the equator (where the Mercator projection doesn?t stretch the map) it is a simple calculation:
At zoom 1 every pixel represents 78km (48 miles), zoom 5 is 5km (3 miles), zoom 10 is 150m (164 yards), 15 is 5m (5.5 yards), and by zoom 20 every pixel is the equivalent of 15cm (6 inches) ? that?s impressively detailed!
Positioning
Google Maps has three concepts of coordinates in addition to latitude and longitude: world coordinates, pixel coordinates, and tile coordinates.
World coordinates are independent of the zoom level, and are used to translate between latitudes and longitudes and the current position on the map (or vice versa). They?re calculated relative to a single tile at zoom level 0. The latitude and longitude is mapped to the fractional x and y pixel on that single tile (a number between 0 and 256 ? its width and height).
The conversion is very easy, although I can?t claim to understand the math. The longitude mapping is easy to understand as it directly translates, but the latitude is more complicated due to the skew as it approaches the poles.
Pixel coordinates reference the exact pixel position of a latitude and longitude at a specified zoom level. They can be calculated by taking the world coordinates and multiplying by the total scaling amount for the zoom level ? which is easy to calculate because the scale doubles each zoom.
Tile coordinates are how the client asks the server for imagery.
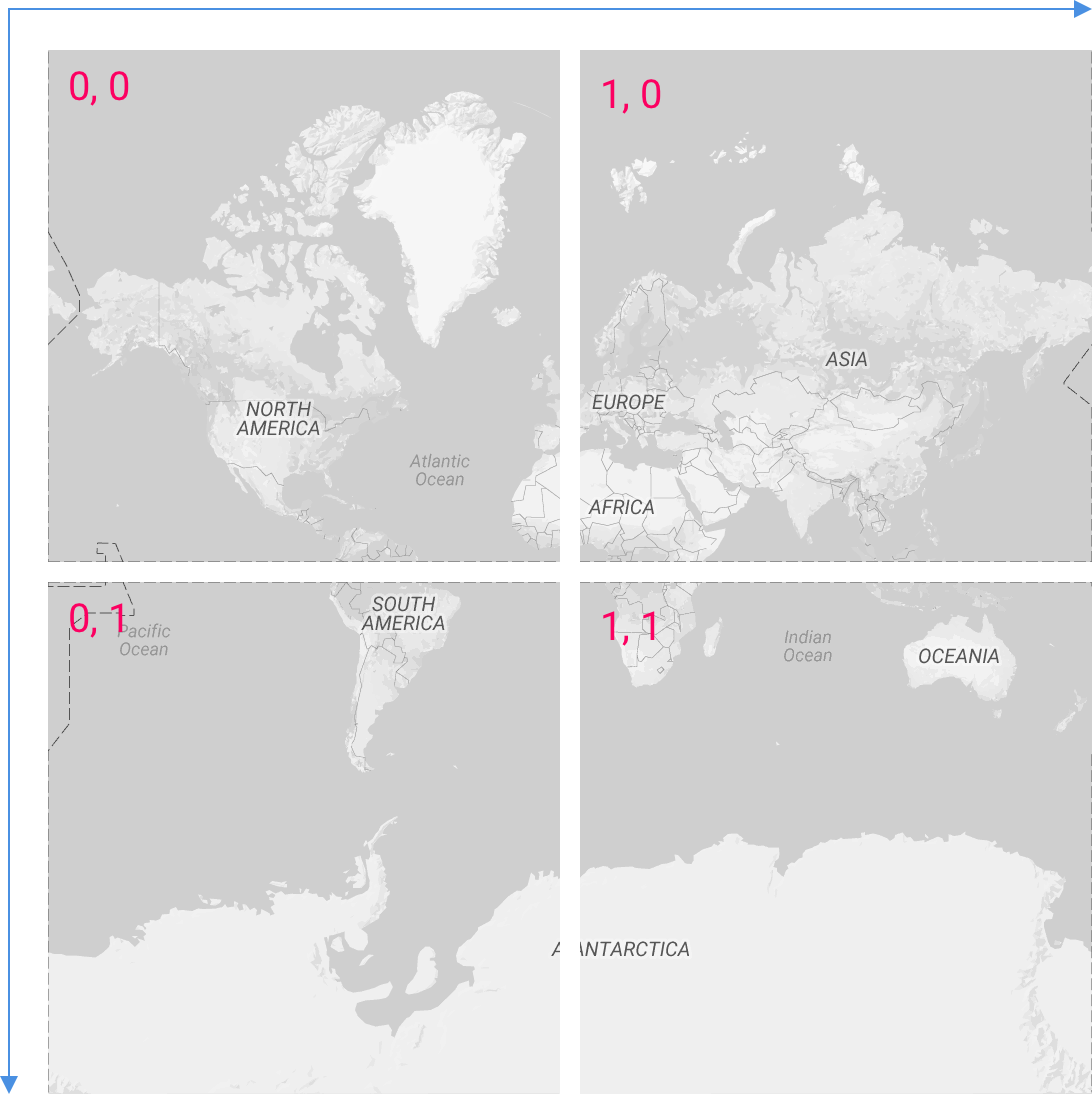 Tile coordinates
They are positioned in rows and columns, with row 0 column 0 at the top left, rows increasing to the right, and columns as you go down. Similar to pixel coordinates, tiles are dependent on the zoom level, in fact it?s a simple mapping from pixel to tile by dividing the pixel coordinates by the tile size and taking the integral number.
The client can easily work out which tiles it needs by calculating the tile coordinates for each corner of the screen. Usually it adds a little bit of padding, as a means of preloading, just in case the user pans the map by a few pixels.
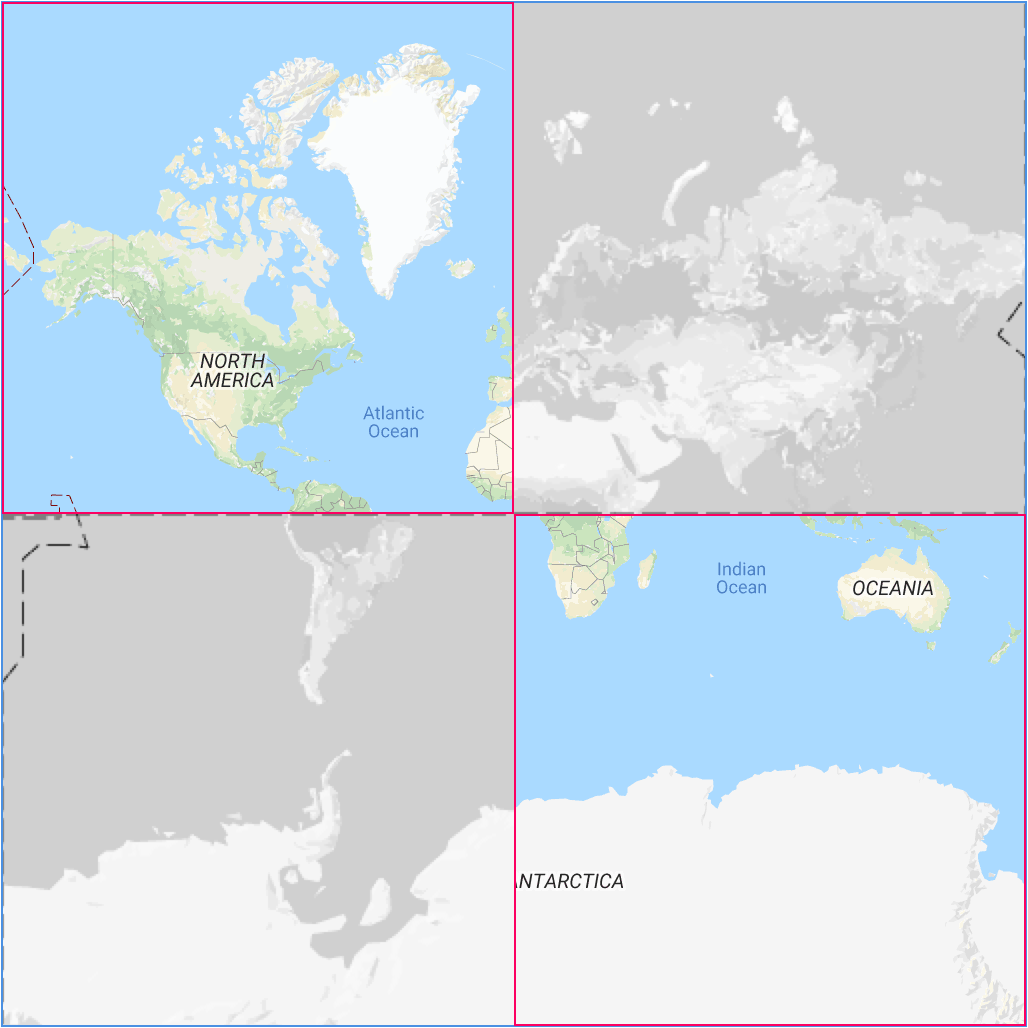
Clients can easily generate tile URLs using these coordinates ? for example zoom level 1, row 0, column 0, is this tile that contains North America. It?s trivial to construct in code, although the Maps API handles it for you (along with styling and other benefits).
Panning
Interacting with the map is where the tiles really prove their worth. Prior to Google Maps, things operated a little more like an Atlas ? if you got to the edge of the map you needed to turn the page to see something more. The great thing about tiles is it enabled users to freely explore the map without interruption as they panned and zoomed around.
Each tile is positioned absolutely within a container, and then when you pan the map instead of moving every tile, only the container needs to move (and the tiles shift with it). This lets the client minimize the number of DOM changes.
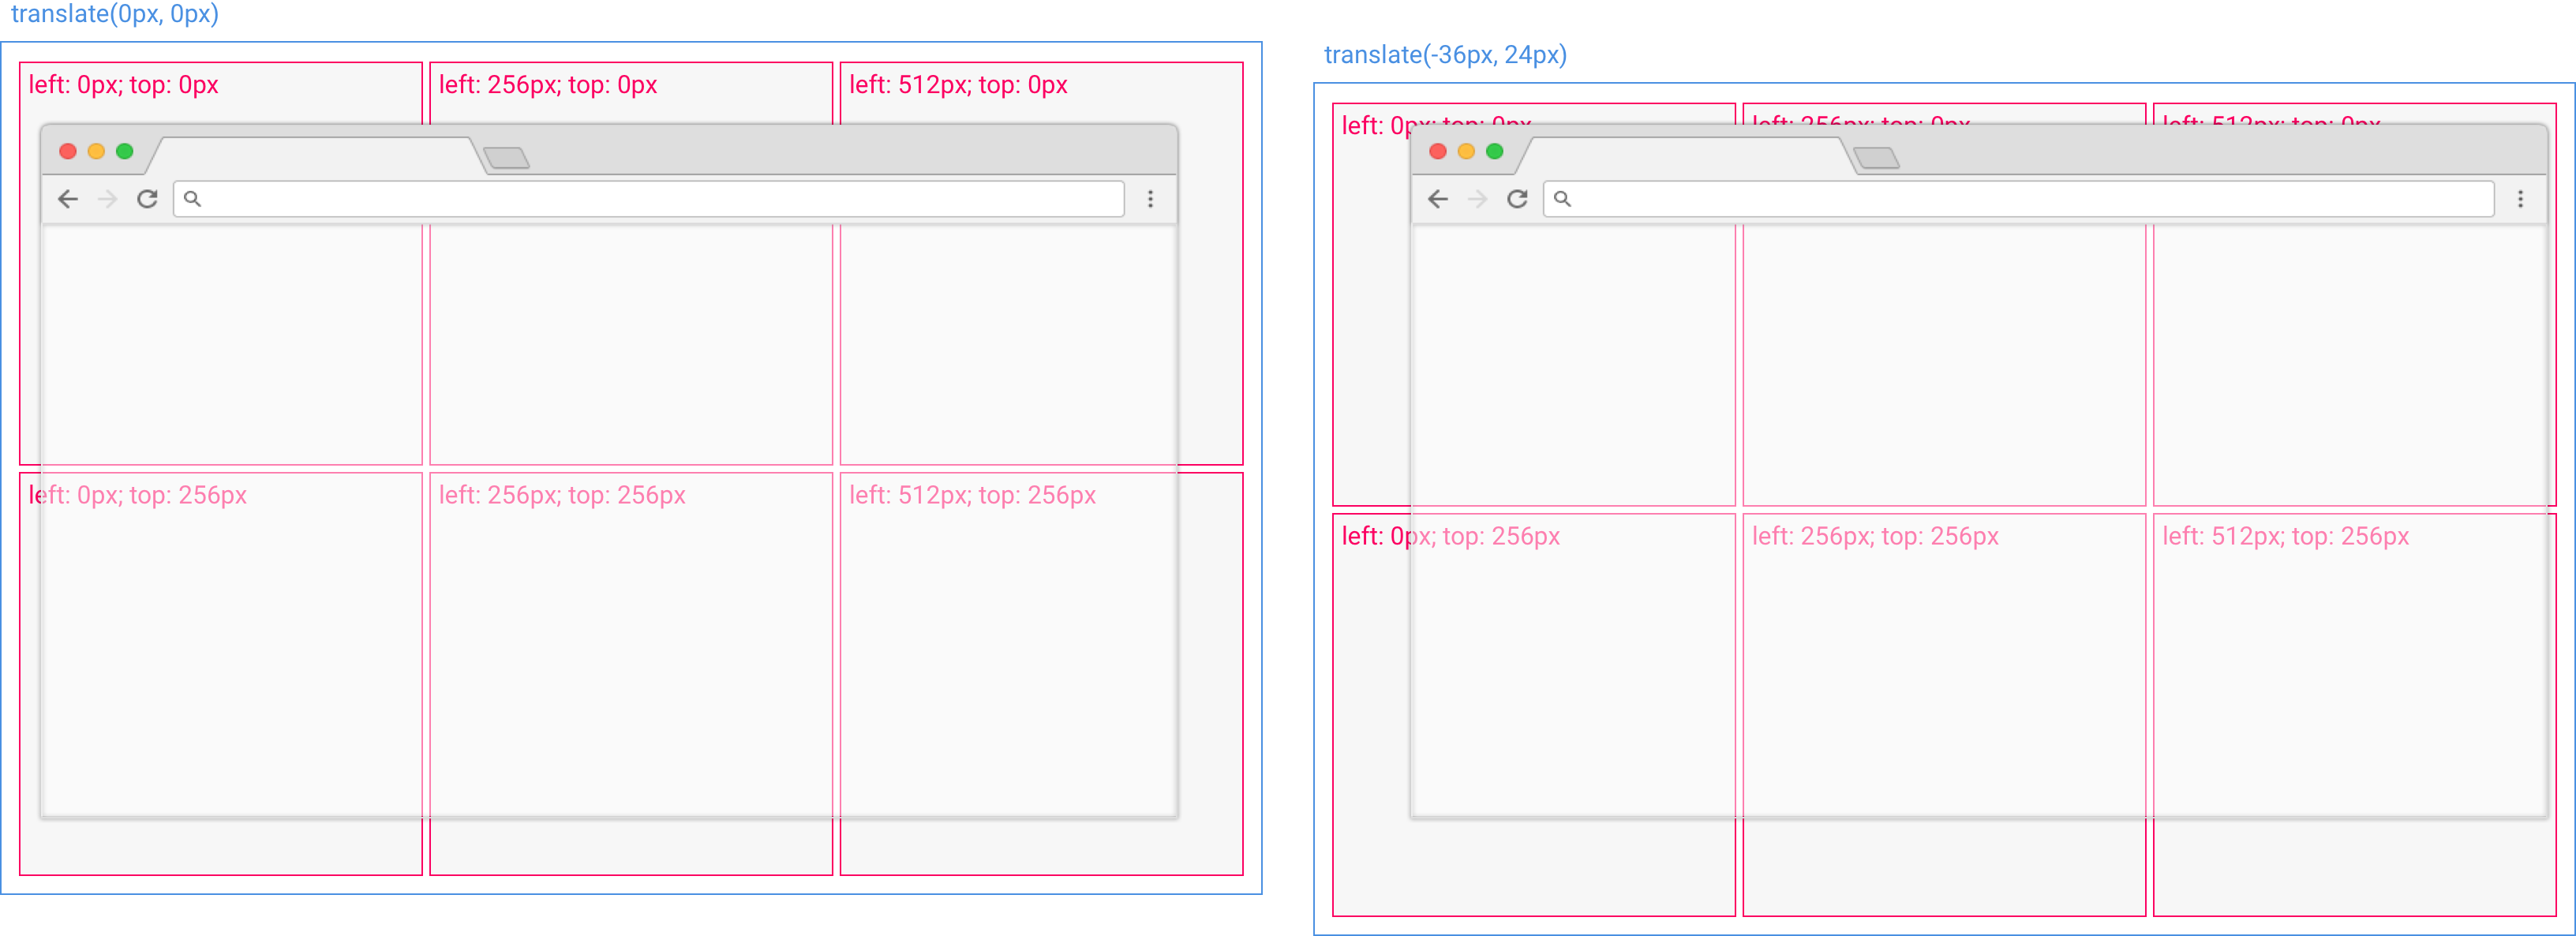 The container moves, not the tiles
It?s easy to calculate the position each tile should be in by simply multiplying the tile coordinate by the tile size.
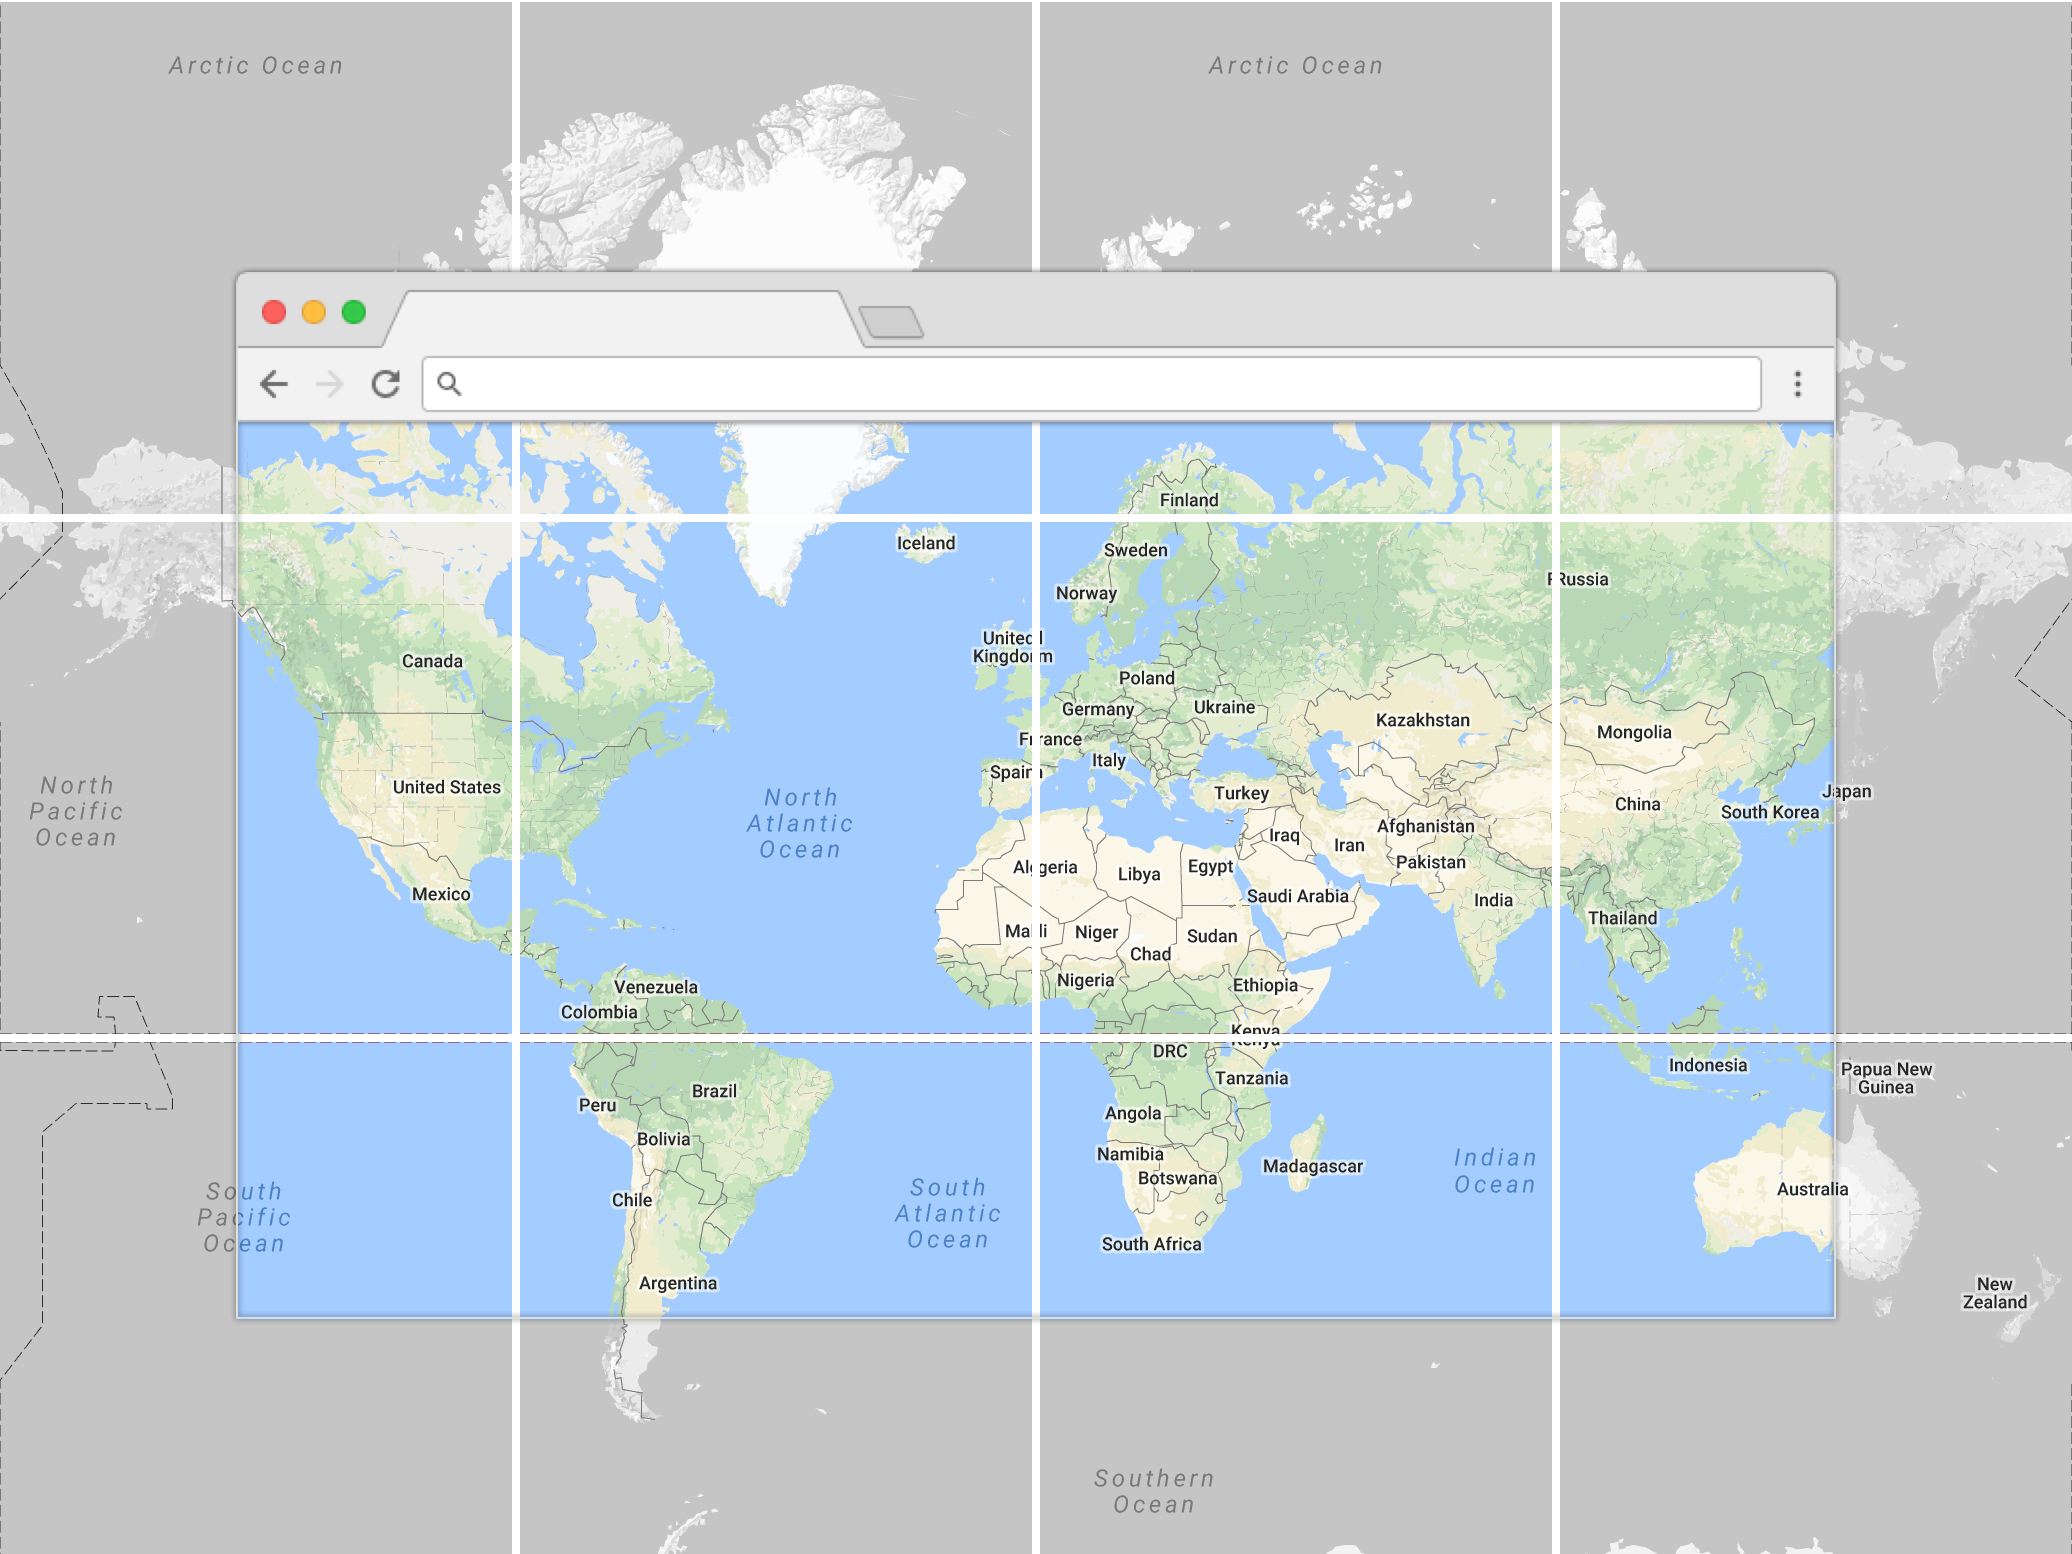
The last positioning trick is minimizing the total number of tiles the browser has to render.
 Maintaining a constant sized DOM
As the user pans the map the client checks what tiles should be visible and either loads the new ones, or removes the ones that are no longer visible.
This is done so quickly that the user rarely notices (and instead of clipping to the hard limits of the screen it often fetches an extra few tiles on either side as a buffer). [This approach actually isn?t that dissimilar from how Google Photos now works]
Zooming
Panning around is seamless, but zooming is one of the challenge areas with a tiled map.
On the technical side the challenge is less how to position the tiles, but more how to transition between levels. Each zoom level is a doubling in scale, and there are no in-between tiles to help.
 Snapping between levels
Zooming was originally very simple, it just replaced the map with the next set of tiles, but that was a little bit jarring because it would suddenly ?snap? between levels.
One way this is compensated for is instead of zooming in on the center of the map, it keeps whatever location is under the cursor stationary (pinned under the cursor). This enables users to literally ?point? at the feature they?re interested in and focus in (they control the reference point).
 Quick scale animation (Maps JavaScript API)
A more recent adaptation made it feel more responsive. When zooming, it temporarily keeps both zoom levels worth of tiles (the old and the new) and does a very quick scale animation between them?the new tiles start scaled down by half, and the old tiles are animated up to double size.
It still ?snaps? between layers when the animation finishes, but it all happens so quickly that the eye sort of imagines the in-between state.
This scale & snap approach is what is still used today by the Google Maps JavaScript API, Bing Maps, Here Maps, Yahoo Maps, MapQuest, and OpenStreetMap (LeafletJS).
 Scale transition during zoom
Possibility the biggest limitation with scale & snap is that the user has no control over the animation, once they trigger the zoom it will run until completed, there is no ability to control the speed, or pause at an in-between state.
Vector Maps
In 2013 Google Maps released a major update to maps.google.com that stopped using PNG tiles for images, and started downloading vector tiles. These vector tiles are still referenced by their tile coordinates, still behave very similarly to the raster tiles, but instead of being an image, they contain all the labels, paths, and polygons?and are drawn on the client.
There are a variety of reasons why this is important ? the vector data compresses better than images (so saves bandwidth), it makes possible dynamic updates and styling (for example if a user clicks on a transit route), and it enables substantially improved zooming.
 Smooth zooming
With the rasterized PNGs, as you scale the map can?t tell what is a road (and should stay drawn the same width) or what is a park (and should scale bigger) which means everything just gets stretched and pixellated. With the vector information the client can keep labels properly positioned, maintain the road widths, yet scale all the polygons ? the result is an incredibly smooth zooming experience. Even better, it?s completely responsive, so the user can control the speed and even stop at fractional zoom levels.
However, if you look closely (or go try yourself) while it?s very smoothly scaling the tiles, there is no new information until you stop. As soon as the user pauses zooming, the map quickly loads the vector tiles at the new zoom level and swaps them out. It?s really smooth & snap.
MapBox is one of the other other clients that uses vector tiles on the web, and also use this smooth & snap approach, although they more aggressively load new tiles during the zoom transitions.
3. Animating the rasterized map
In order to be able to smoothly animate the map, the most critical element is the ability to set fractional zoom levels (eg halfway between two of the integral zoom levels the tiles render at). With vector tiles this can be custom rendered on the client, but with the raster tiles, we?d need to get more creative.
To support it, I wrote a fully custom version of the Maps JavaScript API, that reuses the image tiles from the Maps Server, but then positions them and handles interaction by itself. This enabled complete control over the scaling and positioning of each tile, as well as control over the zoom and animation. All told it was 4,442 lines of commented code ? it?s remarkable how little code the client needs, but if you think about it, most of the really hard work is being done on the server (working out which roads, lakes, buildings, etc? are visible in each tile, deciding the styles and colors, and then rendering that as images).
The rest of this article refers to my prototype code and not the normal version of Google Maps.
Creating fractional zoom levels
Similar to the approach on Google Photos to cross-fade the opacity between low-res and high-res images to blend the details when loading, my theory was that we could blend the tiles from different zoom levels to create an in-between state.
We could take lower zoom levels and scale them up as when zooming in, or do the opposite and scale down the higher zoom levels when zooming out. By scaling and overlaying tiles from multiple zoom levels we could smoothly transition between integral zooms, and do it in a mathematically predictable manner (perfect for synchronizing animations).
This is possible because Google uses the Mercator Projection ? scale is uniform for localized regions, so linearly scaling the tiles preserves the shapes.
Calculating the opacity for the cross-fade is simple, and linear. When transitioning between two zoom levels the next tile should be fully transparent (opacity 0) at the first zoom step, and fully opaque (opacity 1) at the next. So opacity is just 1 minus the distance the tile zoom is from the map zoom (although in practice it clamps to values between 0 and 1).
Scale isn?t that complicated either. Given the scale doubles at each zoom level it is possible to calculate the amount to scale for an in-between level using powers of 2.
If the mapZoom is a full level higher than the tile (mapZoom – tileZoom = 1) then the math would result in 2 or 2. If the mapZoom is the same level as the tile (mapZoom – tileZoom = 0) the math would be 2? or 1. The great thing about calculating powers is it works for fractions and negatives. If the mapZoom is a full level lower than the tile (mapZoom – tileZoom = -1) you get 2? or 0.5. Halfway between zoom levels (mapZoom – tileZoom = 0.5) you get 2^(0.5) or 1.414, and you can do this to scale smoothly between each state.
The following illustration shows how this applies while zooming in. The monochrome tile is the starting zoom level, and the colored tiles are the next zoom level (drawn in a checkerboard so you can observe the difference). You can see that the closer we get to the next zoom level, the more the colored tiles dominate, and the detail (eg labels) start to fade in.
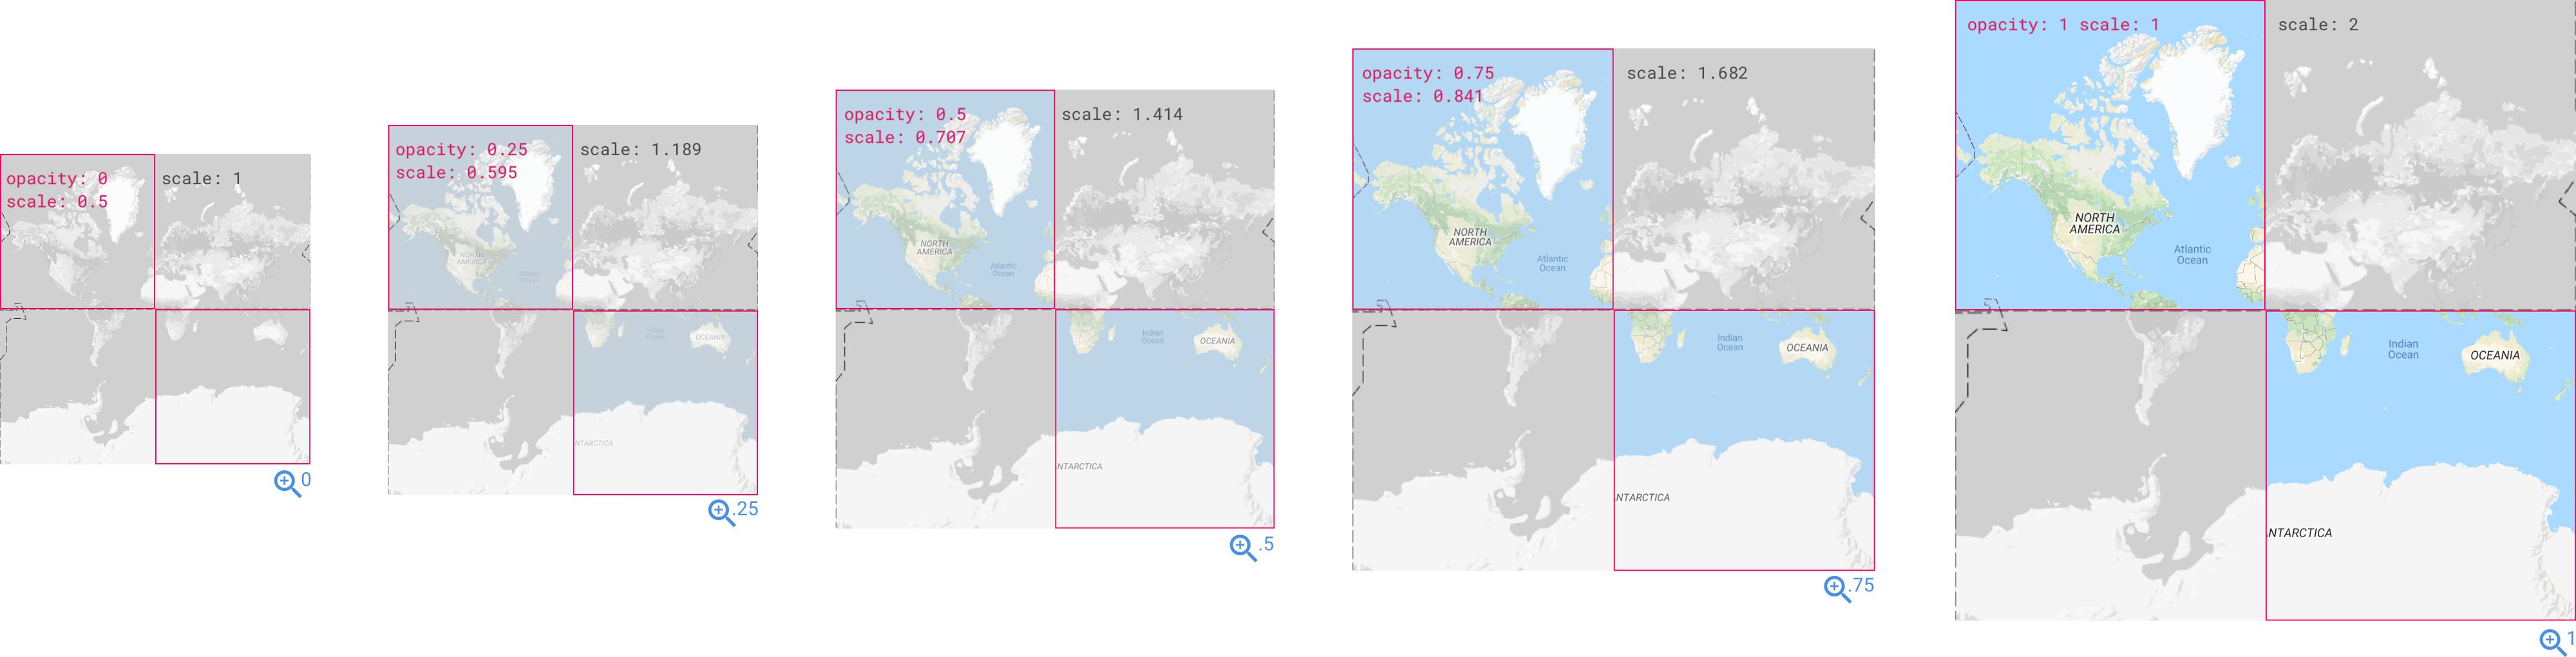 Zooming in
Here is the opposite direction, zooming out. Monochrome are the starting zoom level again, and colored the previous zoom level? in this case we?re losing detail as we zoom out.
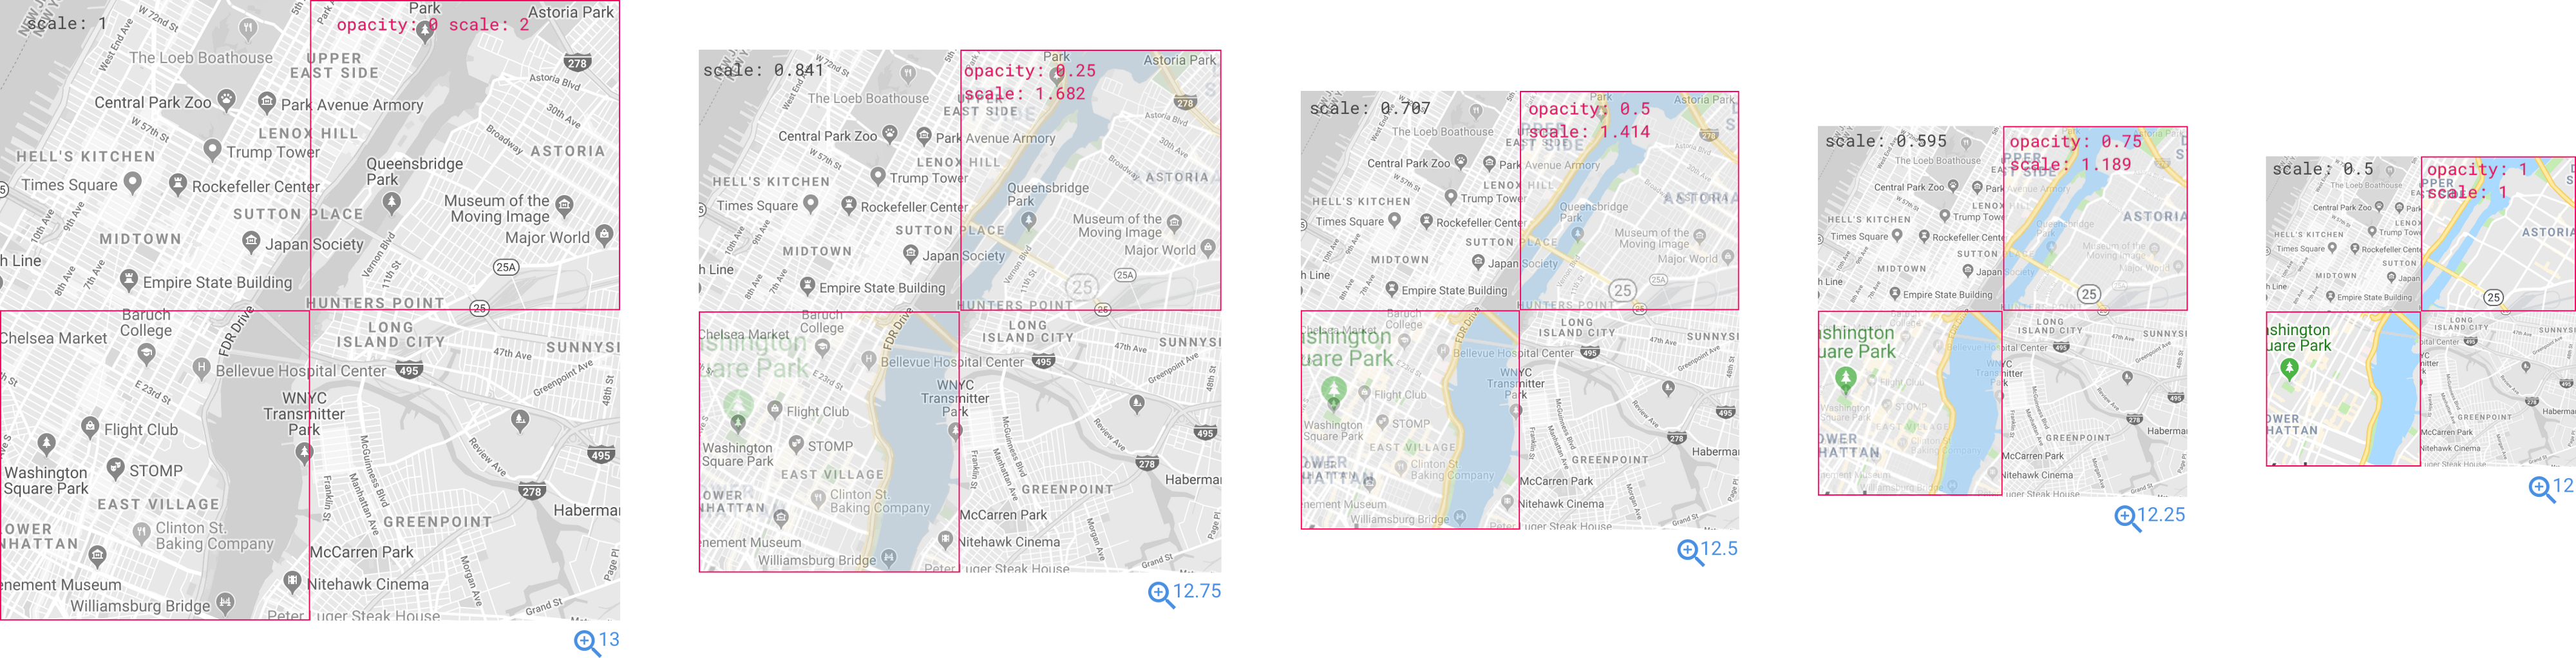 Zooming out
 12fps
12fps
It works very well, providing a relatively smooth zoom (much better than scale & snap) and while not quite as smooth as the vector rendering (smooth & snap) it actually eliminates the snap aspect entirely.
I?ve left the debug overlay on in the GIF so you can see where the new tiles are loading in. It?s smoother in practice (60 frames a second) but I limited the GIF to 12fps. Here is the video. Alternatively, here it is without debug lines.
At either extreme, the map is almost imperceptibly different from the integral zoom, although in the middle it can get into an awkward state with labels competing with each other. This wouldn?t be a great effect if staying at a fractional zoom level, but it?s not a problem during transitions?and to avoid fractional zooms it is easy for the client to ?settle? back to an integral zoom when the user finishes zooming, waiting until they let go so they remain in complete control in the meantime.
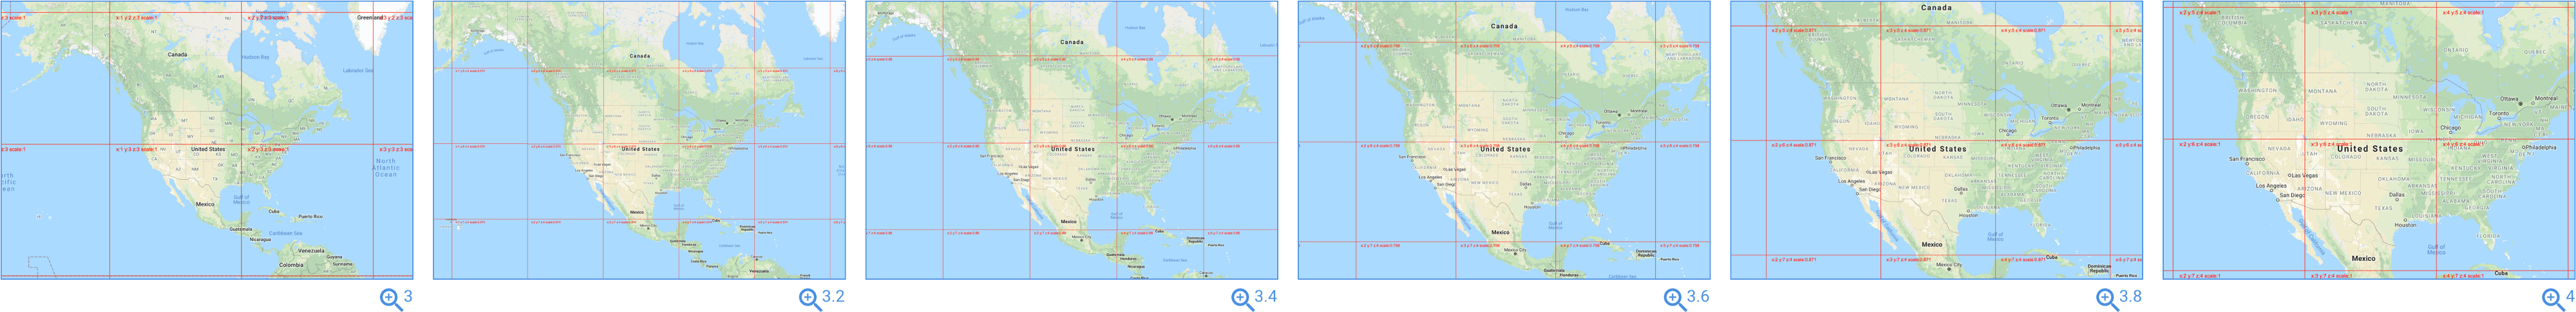 Zooming between integral levels 3 and 4
Shall we call this effect scale & blend? Not only does it zoom smoothly, but it?s responsive to user input at all times.
 Animating zoom at 24fps
HTML5 Canvas
To achieve the best performance, I abandoned the normal web approach of using standard HTML elements. As described in the previous section, the Maps API uses a combination of DIV and IMG elements to render the map. Each image is placed within a parent container and that container is moved as the map pans. For normal web applications letting the browser manage things has a lot of advantages, the browser handles all the decisions around when to redraw the screen, how to lay out and position elements, as well as streamlining interaction (like scrolling and click events). Leveraging the browser for this is nearly always the best approach.
However, sometimes ? especially for very custom drawing ? it?s advantageous to do this manually. To support this, browsers created the canvas element. Unlike normal HTML where you create elements and add them to the page, with a canvas you execute draw commands on it. You can draw lines, arcs, circles, rectangles, and even complex curves. The canvas won?t do anything extra for you, and treats the result just like a picture. If you draw an image into the canvas you need to tell it exactly where and what size, and then if you decide to move that image a few pixels, you need to clear the entire canvas and repaint everything on it (including the other lines and images). If you scroll a normal website, the browser recalculates positions and redraws. If you want to let users scroll a canvas, you need to manually recalculate every position and then redraw every piece yourself.
If it sounds like a lot of work, it really is, and that?s one of the many reasons why canvas isn?t used more often; but there are certain situations where a canvas is the best way to achieve something, and a fully custom map renderer is one of them (as the scaling and positioning of every tile was custom anyway, using a canvas added some complexity but reduced the overhead).
One way to visualize the difference in how the page is constructed is by looking at the resulting HTML. The normal approach creates dozens of elements and adds them to the page, but for the canvas approach there is very little there, everything was a draw command within the canvas.
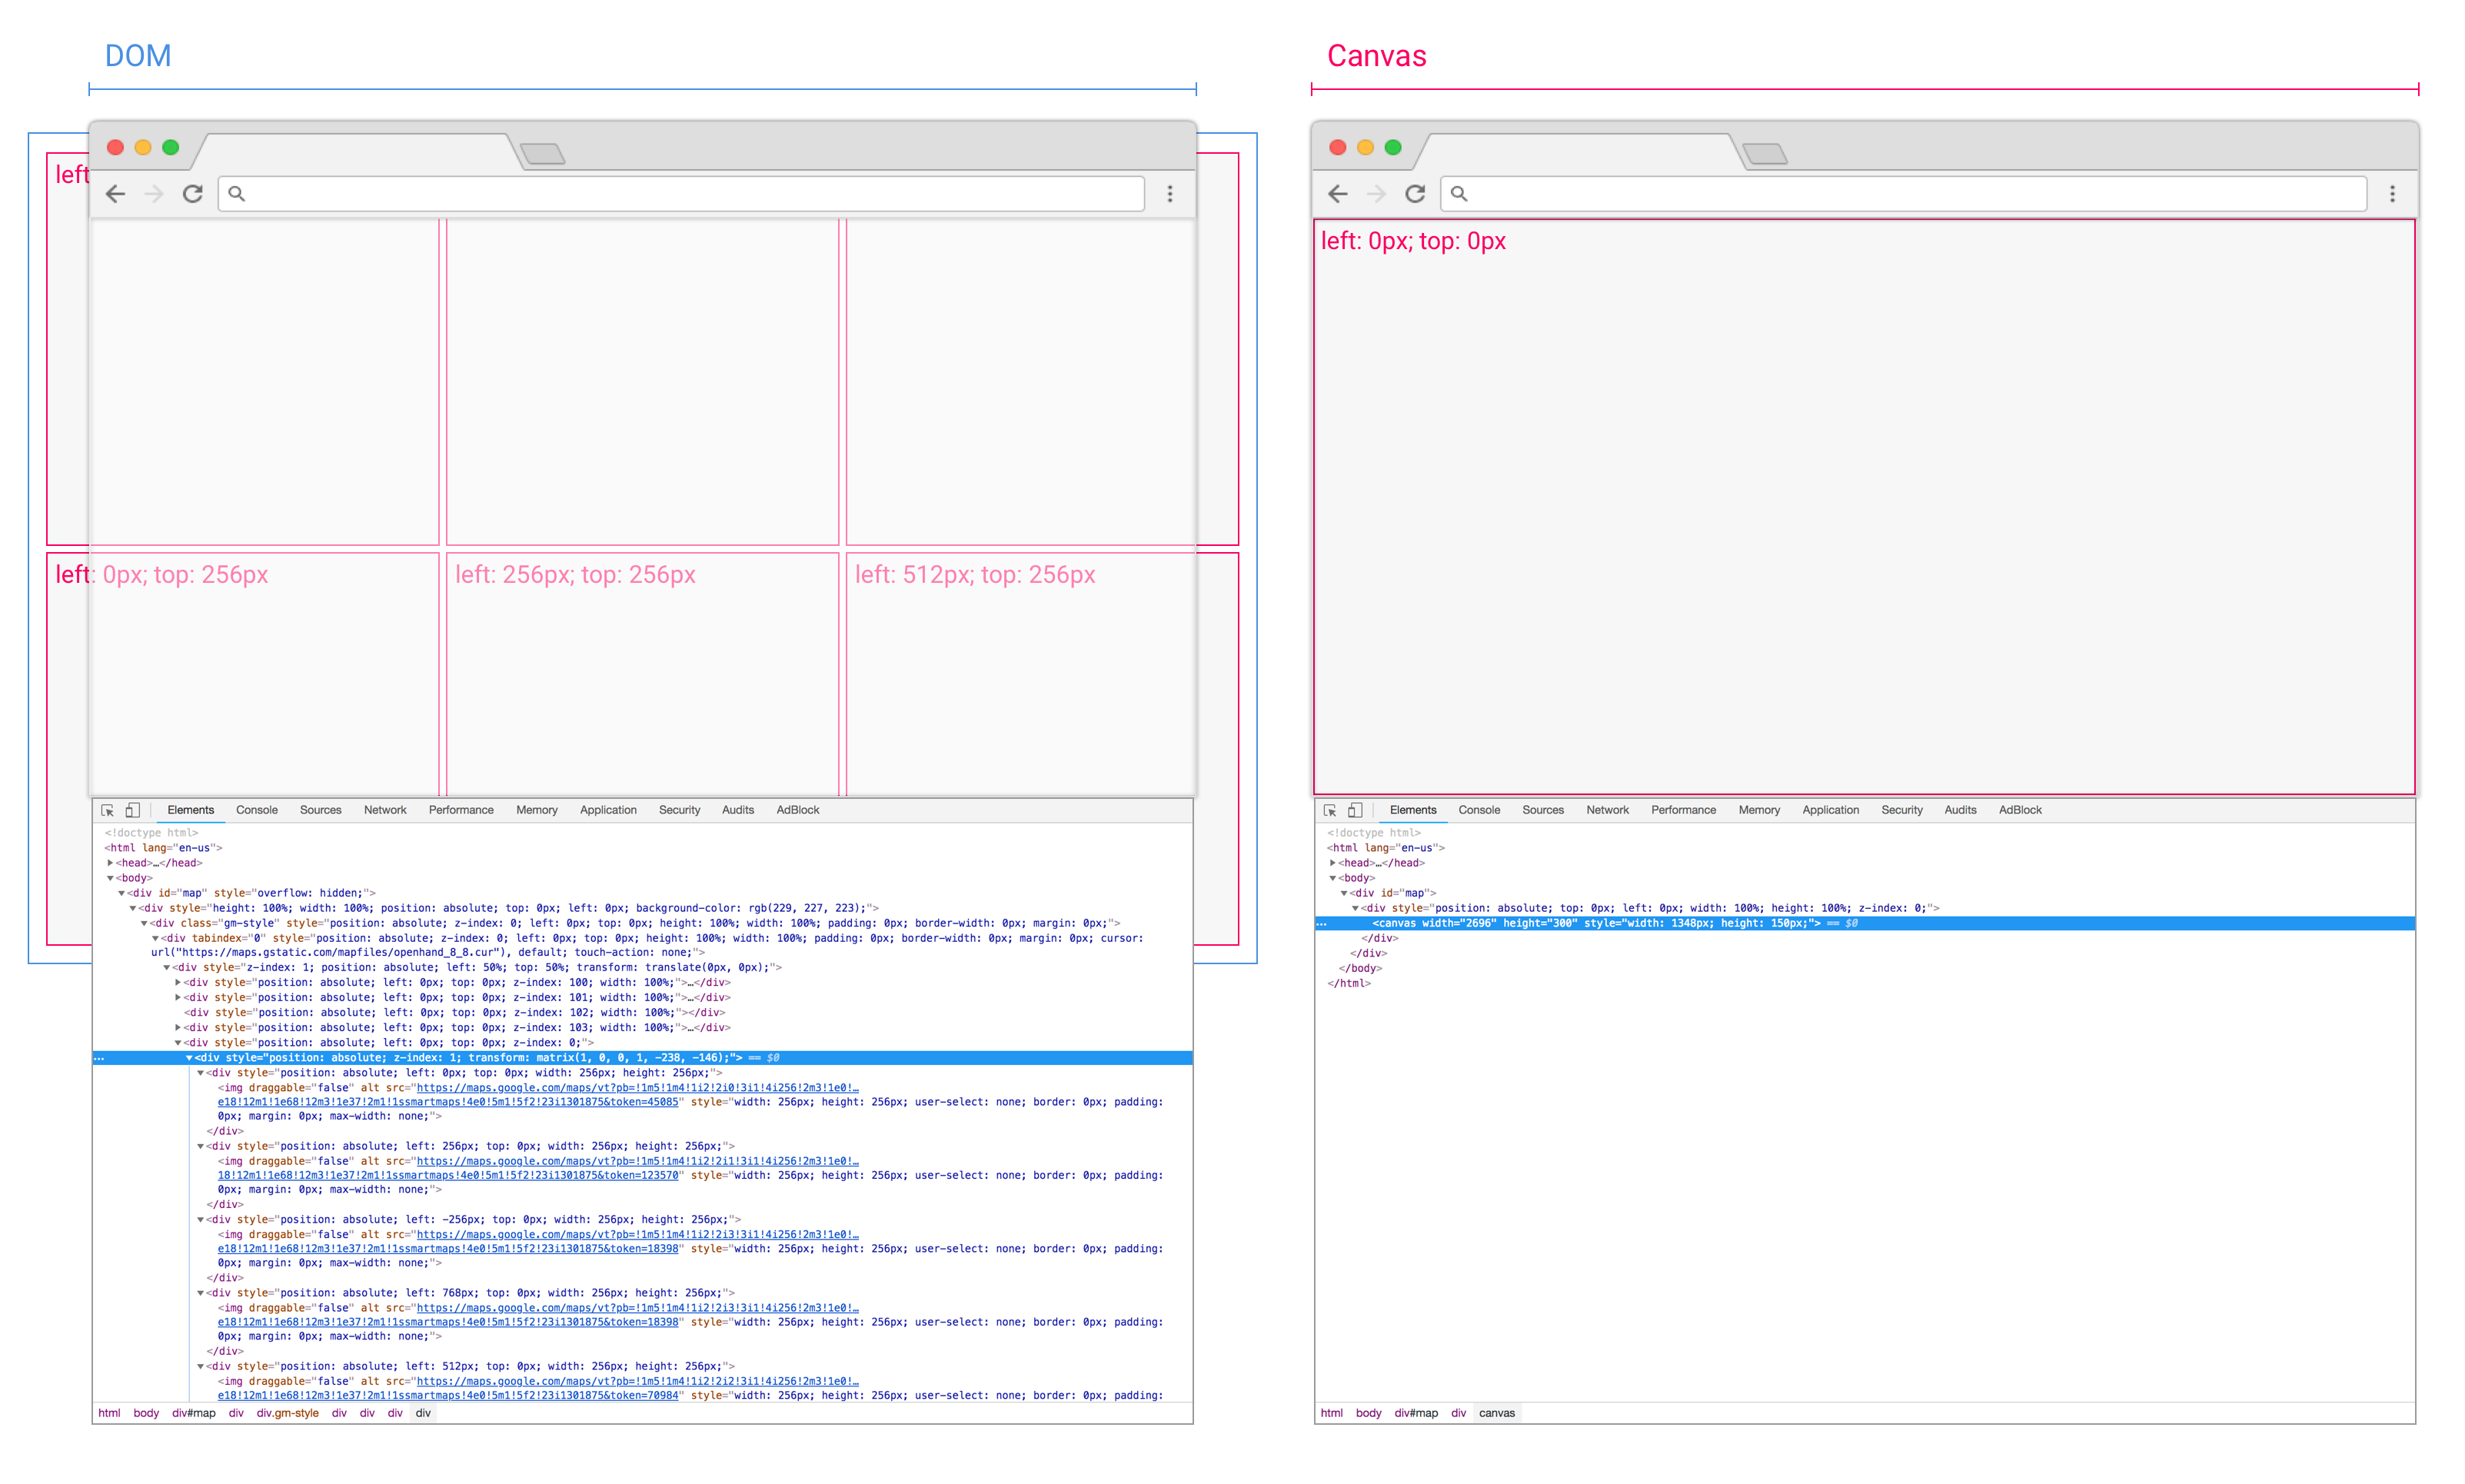 Page structure difference between the element based and the canvas approach
Fallback tiles
One edge case to handle when scaling and blending the tiles is what happens if there are no tiles to blend. If the lower zoom hasn?t loaded yet, then instead of animating opacity on the next level, it?s better to start it fully opaque ? otherwise there will be patchy gaps in the map.
Calculating the coverage of fallback tiles is one area that the custom canvas composition really shines ? each draw operation can set custom opacity, and because canvas is really efficient for small draw operations (eg map tile sized), we can efficiently set custom opacity levels for every individual tile. If we were relying on the browser to do this with custom elements, all the individual animations could cause slowdown.
The client always draws fallback (the underlying) tiles at full opacity, and only changes the opacity of the primary (target zoom level) tiles which it overlays on top. Before the paint cycle, it checks to see if the primary tile has complete fallback coverage ? ie if everything underneath that tile has been drawn.
For example, if we were zooming in here, from zoom 0 to 1 ? those colored tiles do have complete coverage, and that single grey tile underneath them fully overlaps. This means they can safely have their opacity animated without leaving gaps.
However the opposite isn?t true. If we were zooming out, from 1 to 0 (so the colored tiles would be the underlay) we cannot animate the opacity on the grey tile because it would leave some gaps.
One possible solution to this would be to paint the primary tiles without coverage once as a fully opaque base layer, then paint the fallback tiles, then safely change the primary tile opacity (at worst it would be blending with itself) ? but that would increase the number of draw operations for little noticeable improvement.
Another thing we can do with the opacity is to quickly animate in newly loaded tiles, so instead of snapping into place, there is a quick fade.
Zoom direction and velocity
The client also keeps track of which direction users are zooming (in or out), as well as how quickly they?re zooming, and uses this to determine if it should load new tiles.
For example, if zooming in from 14 to 15, the client won?t bother to load any more tiles from zoom level 14, but will instead prioritize fetching the new ones it needs from 15. If the opposite was occurring, zooming out from 15 to 14, the client would only try to load the new tiles from 14.
It uses the zoom speed to decide if there is any point to loading tiles at all, or if it is likely the layer will be zoomed past before the images have a chance to load. For example, when zooming rapidly the user may race all the way from zoom 4 to 15 in just a second ? and there?s little point loading 5, 6, 7, 8? because it would just be a waste of tiles. Fortunately, for zooming-in we can scale just a few tiles (remember at zoom 0 the tile represents the entire world) to keep the colors/shapes vaguely representative.
Avoiding downscaling
Given the map gets increasingly detailed at higher zoom levels, I naively assumed that it would be preferable to use the higher levels and downscale them when zooming out.
 Downscaling too many tiles
However in practice this didn?t work very well?while the scale of all the polygons (eg water and parks) is well preserved, all the labels and icons also get scaled, making a map that looks really cluttered, especially in the middle. The performance also took a huge hit, because instead of drawing a few dozen tiles there were suddenly hundreds available for drawing.
To avoid this, I disabled downscaling tiles by more than 1 zoom difference. Ie when zooming in the fractional levels of the 14s (eg 14.2) it may use tiles from zoom 15, but never, ever, tiles from 16 or higher.
Animations
My stated intent at the start of the project was to be able to programmatically synchronize animations with zoom, although it also has the side benefit of just feeling better ? it?s smoother and more responsive to user input. When at integral zoom levels it behaves the same as the normal implementation. However I think it is quite effective for animating ? you can judge for yourself.
Here is an example visualizing a possible flight path from San Francisco to Australia. [alternatively the full video, or one with the debug overlay]
 Flying (and smoothly animating) from San Francisco to Australia
Of course, there is no reason it has to be limited to zoom animations. One additional benefit of painting everything onto a canvas is it can let us do some really creative things if we want to.
 destination-out globalCompositeOperation
Shown is an example using the destination-out composition mode on canvas to ?cut? shapes out of the map ? here it is overlaying a monochrome map on top of a colored one, and then animating the reveal. [full video]
Future usage
As fun as it was to write, and as useful as this was for my prototyping (it powered dozens of prototypes during my time on the team) Google and MapBox both have vector rendering that surpasses this scale & blend approach. I?d happily encourage everyone else, who isn?t upgrading to vector tiles, to consider implementing something similar. It?s a pretty simple technique that doesn?t add a lot of complexity to the client (certainly less work than vector rendering), but does enable a much more smooth and responsive experience.

