Want to know how to gain customers, boost profits, and save your budget? Among all metrics, there?s a special one that can tell you what value a customer brings to your company during the customer life cycle. Let?s unwrap the customer lifetime value (CLV) metric and make the most of it for your business.
Customer lifetime value (CLV, or LTV for ?lifetime value?) helps you predict future revenue and measure long-term business success. CLV tells you how much profit your company can expect from a typical client over the course of the relationship. More to the point, CLV helps you estimate how much you should invest in order to retain a customer.
Actually, that amount depends on your margins. One company may spend up to $1 to retain a customer while another spends up to $50. To figure out how much you should invest, you need to calculate the customer lifetime value for your business.
According to Marketing Metrics, there?s a 5?20% probability that you?ll sell your product or service to a new consumer, whereas the chance of selling it to an existing customer is about 60?70%. Retention is a lot cheaper than acquisition. Thus, successful marketers don?t focus only on strategies for acquiring new customers. They also work out tactics to retain customers and stimulate them to make more purchases. CLV gives an understanding of your promotion spendings, based on which you can further optimize and plan your budget. What?s more, CLV provides useful insights for how to encourage customers to spend more.
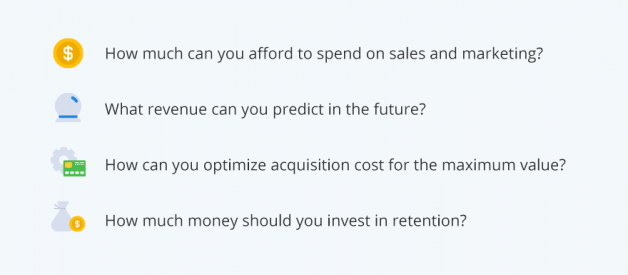
Knowing the lifetime value of a customer allows you to answer these questions:
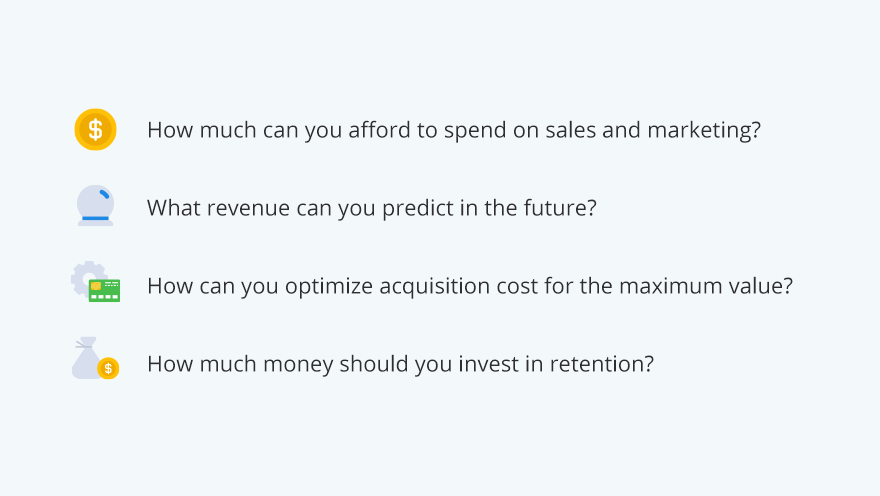
Let?s see a couple examples of how big companies have adopted CLV results.
CLV case studies
Back in 2013, Consumer Intelligence Research Partners estimated that Amazon Primemembers spent $1,340 per year on Amazon, which is twice what non-Prime shoppers spent. Based on this customer lifetime value metric, Amazon started focusing on Prime users and increased the company?s profit over the past four years.
Netflix is another good example of why you should learn how to calculate customer lifetime value. In 2007, they found that a typical subscriber stayed with them for 25 months and that CLV was $291.25. This helped them determine that viewers were impatient. After analyzing statistics, Netflix decided to implement online streaming. This kept members satisfied while they waited for new DVDs to arrive in the mail. In this way, Netflix managed to improve retention by 4% and rented its billionth DVD.
Likewise, Starbucks shows that by improving customer satisfaction you can increase lifetime value and grow profit. A study by Business Insider shows that Starbucks should spend on acquisition no more than average CLV $14,099.
This is how measuring customer lifetime value changes businesses in real life. Ready to give it a go?
How to calculate the lifetime value of a customer
There are many ways to measure customer lifetime value, and the choice depends on your resources and your business. We?ve picked five noteworthy methods to guide you.
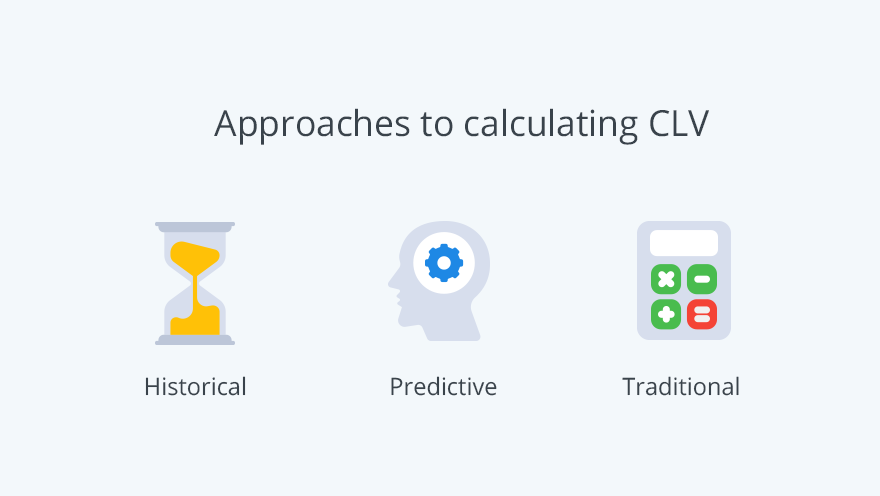
Historical and cohort approaches to calculating CLV
The historical approach is based on the gross profit sum from purchases your customers have made in the past. It?s not difficult to do this calculation, since you only need data on previous purchases. There are two methods of calculating CLV using the historical approach: by determining the average revenue per user (ARPU) and using cohort analysis.
Method #1
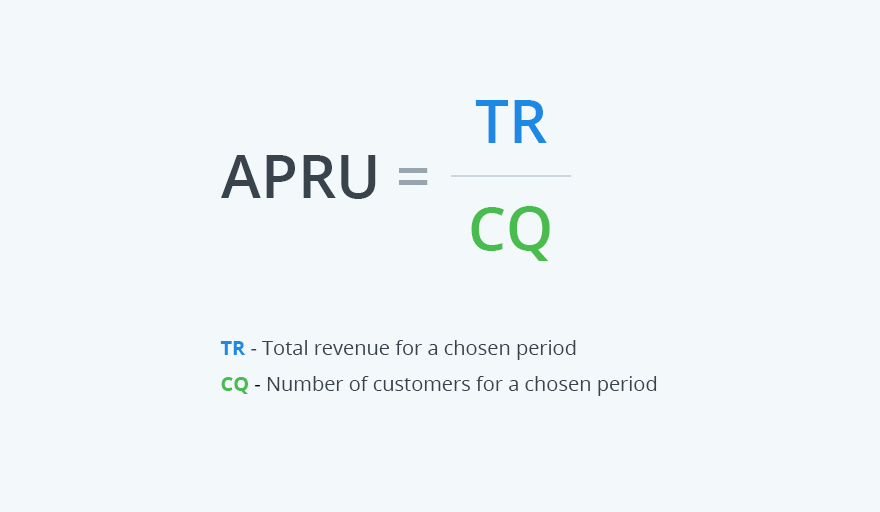
Let?s suppose 20 customers brought $1,240 in profit over a three-month period.
ARPU (3 months) = $1240 / 20 = $62
Let?s see what these customers will bring us in one year.
ARPU (12 months) = ARPU (3 months) 4 = $62 4 = $248 per year per customer
The historical CLV equals the ARPU for one year, which is $248 based on our data. Let?s see what we can do using the other approach.
Method #2
Cohort analysis takes the ARPU approach further. A cohort is a group of customers who have similar characteristics and made their first purchase during the same month in their customer journeys. Using cohort analysis, you calculate the average revenue per cohort instead of per user.
Taking the above example, we?ll calculate the ARPU per month for the cohort named Customers from January 2018 that joined in January 2018 and the cohort Customers from March 2018 that joined in March 2018.
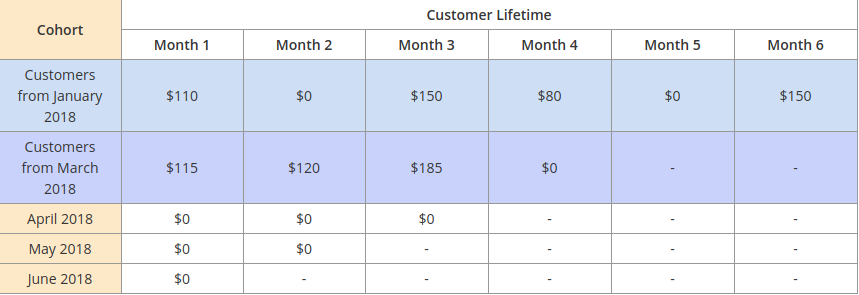
This table shows that purchases differ from month to month. Suppose your cohorts are not that different. In this case, the March cohort will likely also go silent for some period of time.
In addition to calculating CLV, cohort analysis can help you find the number of loyal clients, improve lifetime value by finding the points where purchasing drops off, and accurately assess ad campaign performance. You can read more about this in our article on cohort analysis.
The drawback of these methods
These two methods are simple, but they still can?t be used for predictions. The historical approach is valid only if your customers have similar preferences and stay with your company for the same period of time. They don?t consider changes in customer behavior. So if your customers change their interests and the way they purchase, it will affect the outcome.
A predictive approach to calculating CLV
This approach aims to model a customer?s transactional behavior and predict what they?re likely to do in the future. It?s more precise than historical CLV because it applies algorithms that can predict the total value of a customer. Along with past purchases, this approach accounts for a customer?s actions. Again, there are many ways to calculate predictive CLV. Below, we review the simplest equation.
Method #3
Don?t get dizzy! This is the most complicated but accurate method for calculating CLV. You?ll need to calculate some metrics to plug into this formula:
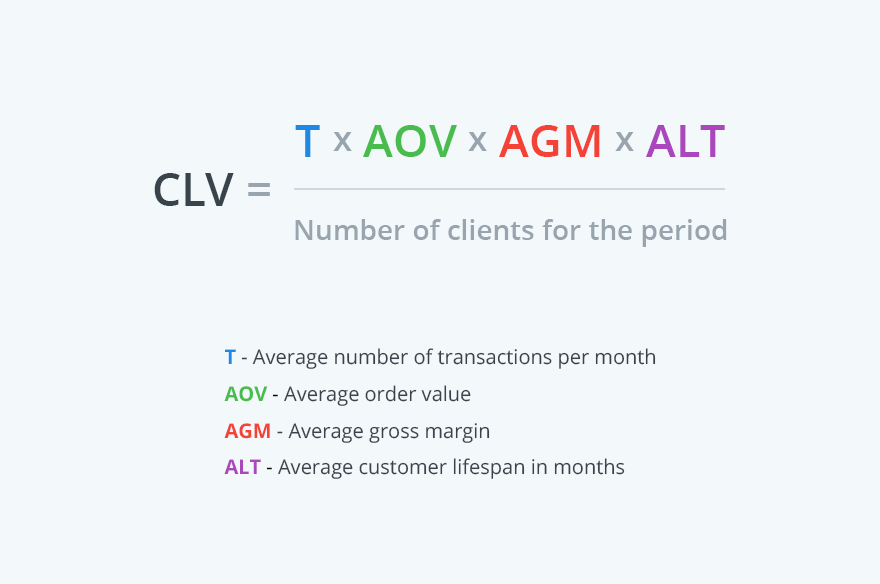
Now we?ll figure out how to calculate the metrics you need to plug into this formula.
- First, we?ll calculate the average number of transactions (T):
Period: 6 monthsTotal transactions: 120T = 120 / 6 = 20
2. AOV is the average value of an order, or the average revenue from each order.
Total revenue (November): $12,000Number of orders: 20AOV = $12,000 / 20 = $600
3. AGM is the average gross margin, which tells you what part of each sale is your actual profit and what part is the cost (expressed as a percentage). We need to perform a two-step calculation to get AGM.
- Determine the gross margin (GM) percentage per month:
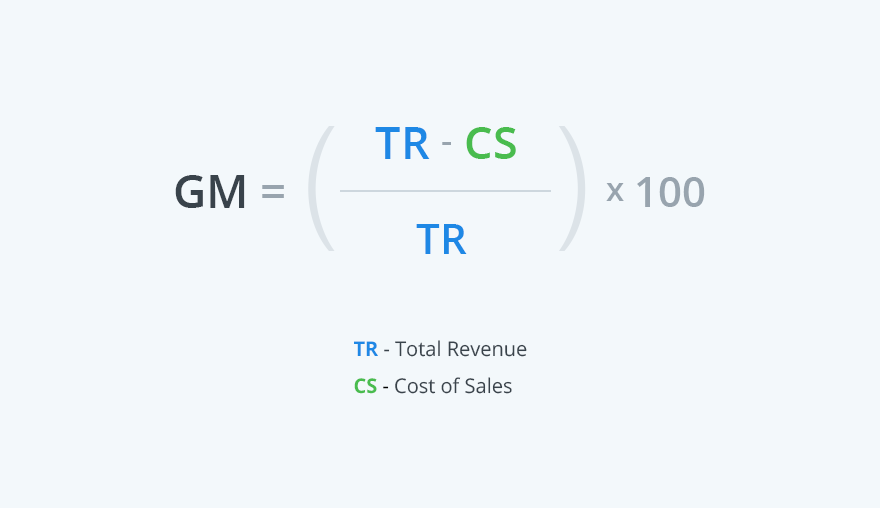
Example:
Total revenue (November): $12,000Cost of sales: $8,000Gross margin (%) = (($12,000 ? $8,000) / $12,000) 100 = 33%
2. Let?s take a six-month period to get the average:
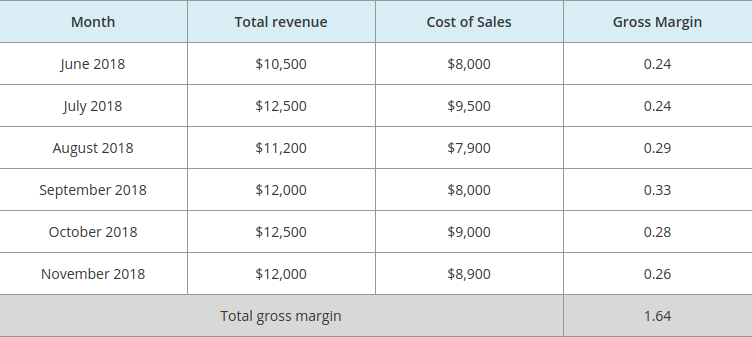
Total gross margin: 1.64AGV = 1.64 / 6 = 0.27, or 27%
4. ALT represents the average lifespan of a customer, which tells you how long the average customer has been with your company.
To get this figure, use this formula:
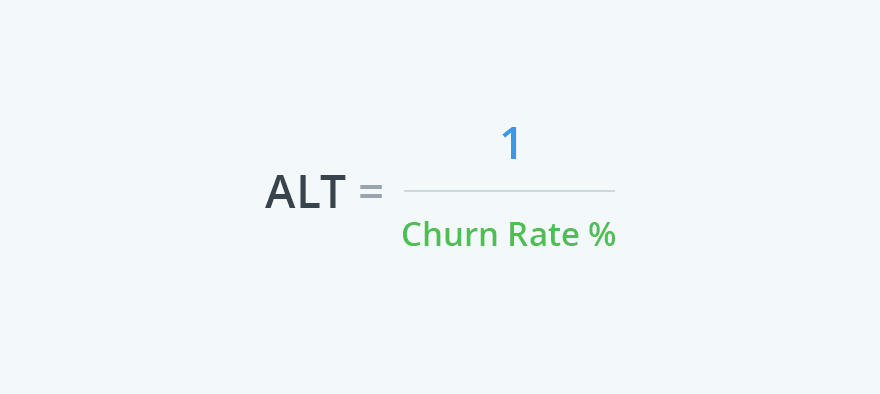
To measure your churn rate, use this formula:
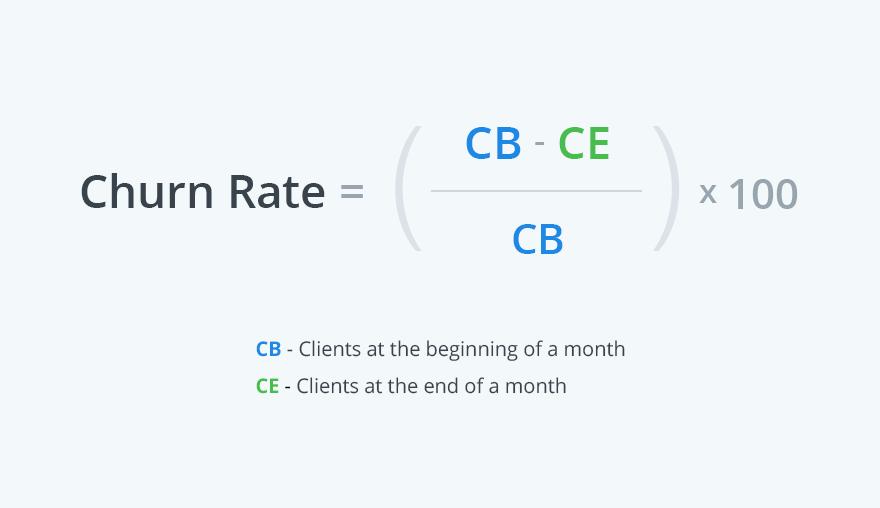
Suppose you had 200 customers at the beginning of November and 150 customers at the end of November.
Churn rate (%) = (200?150) / 200 = 50 / 200 = 0.25, or 25%ALT = 1 / 25% = 1 / 0.25 = 4 months
Finally, we have all the metrics for our CLV prediction formula:
- Average number of transactions per month (T) = 20
- Average order value (AOV) = $600
- Average gross margin (AGM) = 27%
- Average customer lifespan in months (ALT) = 4 months
CLV (total) = 20 $600 27% 4 = $1,296,000
Now, we should take into account the total number of existing customers at the end of the latest month, November, which was 150.
Predicted CLV = $1,296,000 / 150 = $8,640
The drawback of method 3
Although this approach is better than the historical model, you still need to consider that the predictions may be misleading. We?re just guessing the customer lifespan based on monthly data. For a more accurate result, you should adjust CLV to your industry and business strategies.
Traditional approach to calculating CLV
Method #4
If you don?t have flat yearly sales, you can rely on a traditional CLV formula. It?s possible to consider the discount rate, average gross margin per lifespan of a single customer, and retention rate.
The formula is:
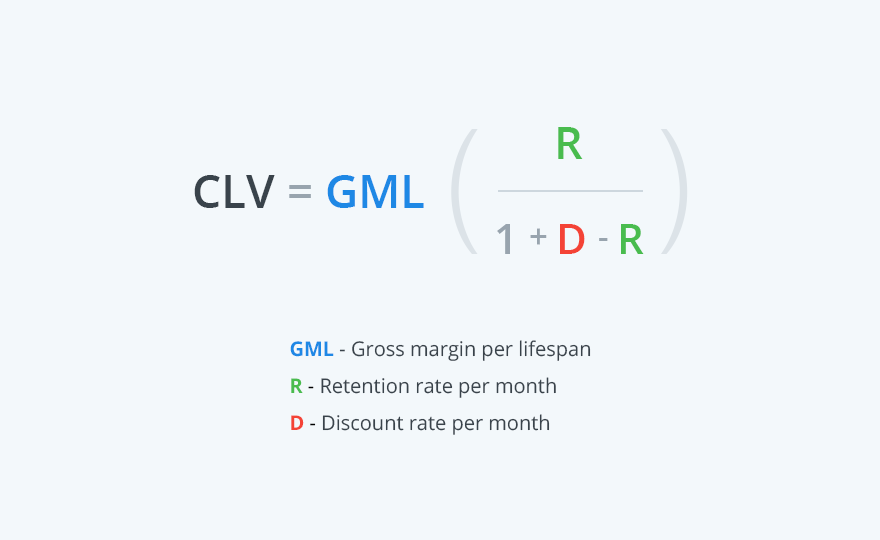
- GML is the average profit you receive from a customer during their lifespan.
GML = Gross Margin (%) Average Total Revenue per Customer
Gross margin: 27% ( from the example above)Average total revenue: $900 (from the example above)
GML = 0.27 $900 = $243
2. R is the monthly retention rate.
The retention rate, R, is the percentage of clients who made a repeat purchase over a particular period, compared to the previous period. To calculate your monthly R, you?ll need these numbers:
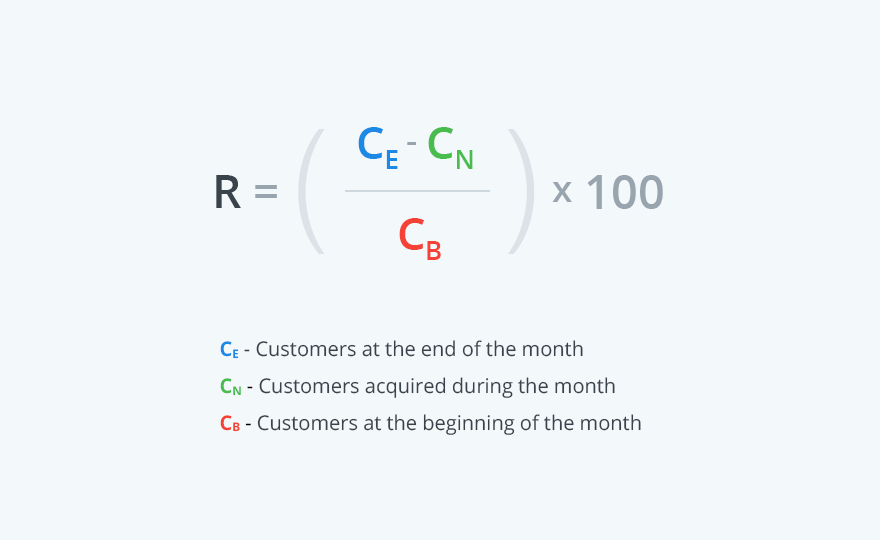
Let?s suppose that in November you had:
CE = 250CN = 50CB = 220
R = ((250?50) / 220) 100 = (200 / 220) 100 = 0.9 100 = 90%
3. D is the discount rate. We?ll take a standard 10% discount rate.
Now we have all the figures needed to calculate traditional CLV:
CLV = $243 (0.9 / (1 + 0.1?0.9)) = $243 (0.9 / 0.2) = $243 4.5 = $1,093.50
This formula covers all possible changes in revenue during a particular period. In order to take into account inflation, each subsequent year should be adjusted by a discount rate.
Lifetime value of a customer in Google Analytics
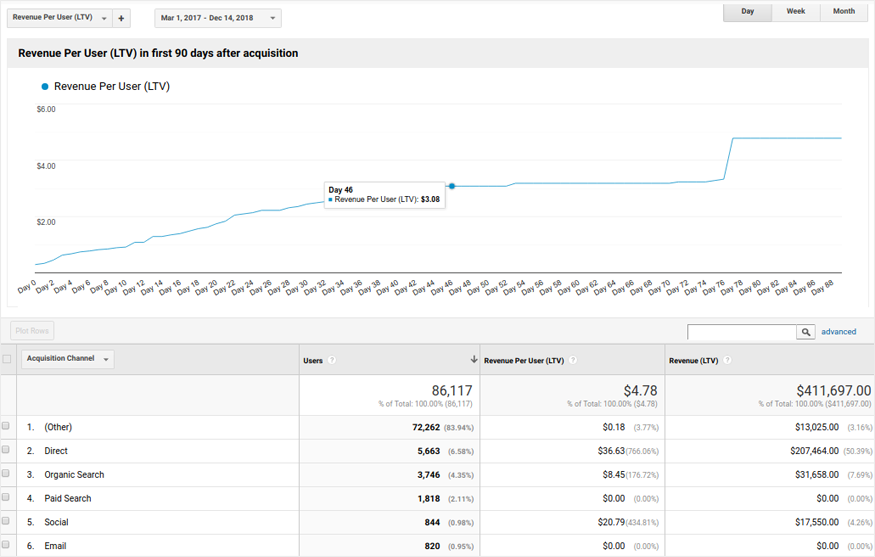
Many marketers use Google Analytics to keep up with essential data. This service provides a feature that helps you measure the value of clients by engagement and revenue metrics across many sessions for a 90-day acquisition period.
Method #5
The LTV report in Google Analytics can tell you data on users? behavior at their first stages of interaction with the company based on page views, goals, events, and trends. Basically, you just click the buttons to generate a report and Google Analytics breaks it down for you.
Things to consider:
- This is a relatively new add-on (released in 2017) that doesn?t consider a long lifespan. Instead, it makes conclusions based only on the past 90 days.
- Google Analytics is a cookie-based platform. If a user opts out from cookie tracking, they?ll fall out of your data.
- Google Analytics counts leads along with subscribers across all channels. This means you won?t know for sure how much money each user spends.
- Google Analytics can?t clearly see which customer makes a repeat purchase. There?s no way to check if a customer has spent $100 or $1,000.
Google Analytics is an effective tool for data collection, but calculating CLV requires data on real customers and can?t be done only with web metrics.
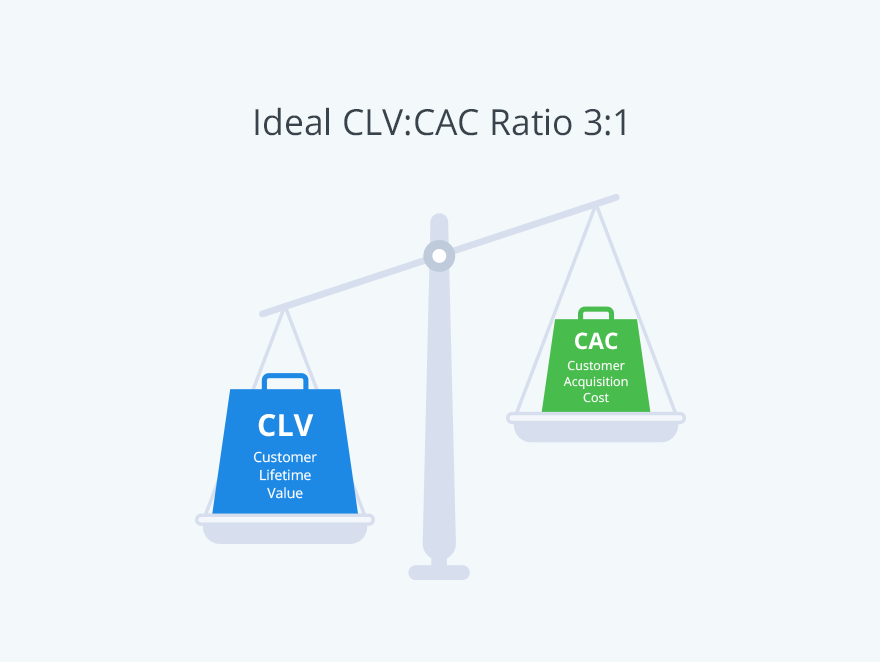
Is my CLV normal? There?s nothing like ?normal? for CLV. Any CLV is normal if your business stays alive. You should concentrate on how to improve this metric at any stage of your business development. And if you want a sign from above, here are some interesting statistics: if your CLV is three times your CAC, everything is going well. If not, you have a lot of things to do to improve the situation.
CLV is done. What?s next?
If you think that CLV is a bit difficult, just try hard, calculate it, and reap the rewards in the form of valuable insights for your business.
Compare your CLV results with acquisition costs to see if your marketing efforts are profitable:
- If CLV is higher than the cost of acquisition, you might be in a good situation due to repeat purchases or high retention. However, the interpretation also depends on your industry and gross margin.
- If you see that your costs constitute a small part of the gross margin (i.e. are lower than 10%), you might not be spending enough on marketing. Thus, you can invest more to grow.
It?s another matter if your CLV is equal to or close to your acquisition costs. This says that your business is spending almost as much on a customer as it gains. This might be a strategy when you want to attract new clients. However, it?s always a warning sign, telling you that your marketing efforts aren?t effective. So think about improving your lifetime value. One way to do that is through customer segments using OWOX BI Pipeline.
Customer lifetime value can be interpreted in many ways. This metric helps you find the balance. You can figure out how much to invest in order to retain your existing customers and to acquire new ones.
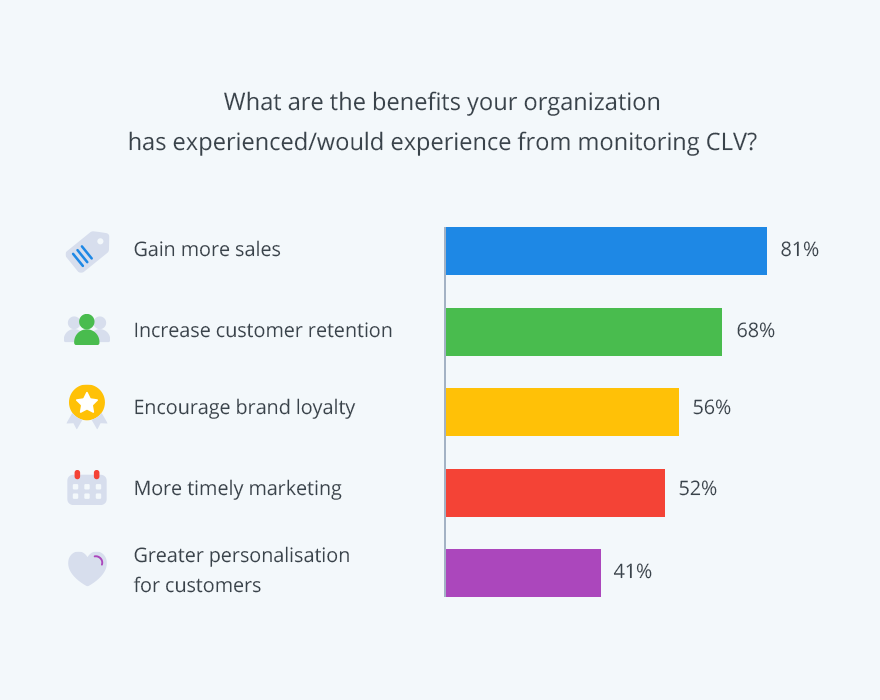
Just to give you an idea of possible benefits of CLV monitoring, take a look at these statistics by Criteo:
Final word
Of course, there are many important metrics to take into account in order to optimize costs. Simply by calculating lifetime value, you can improve your business in all directions. You?ll get an idea from CLV investigations of how to build customer loyalty and increase sales. If you keep your customers satisfied, they?ll stay longer and continue to purchase from you.
Source https://www.owox.com/blog/use-cases/customer-lifetime-value/

This story is published in The Startup, Medium?s largest entrepreneurship publication followed by +435,678 people.
Subscribe to receive our top stories here.


