
Matplotlib made easy in 30 days
 Photo by Anne Nygrd on Unsplash
Quick recap:
- Introduction to the basics
- How to fit Multiple Subplots in a single window
- How to deal with Figure & Axes
- Complete Guide to Scatter plots
Today’s topic:
It is the most used one ?Line plots?, widely across various industries like finance (stock forecasting), biology (decay forecasting), sports (team comparisons) and many more.
- Commands for line plots
- Multiline plots
- Adding annotations to each point
- Customizing markers, line styles & legends
we use the following command
import matplotlib.pyplot as pltplt.plot(x,y)
Let?s draw a simple line plot
import numpy as npx = np.arange(1,11)y = np.random.random(10)plt.plot(x,y)plt.show()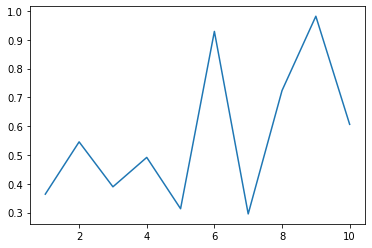 Basic Line Plot
One more:
x = np.linspace(1,10,1000)y = np.sin(x)plt.plot(x,y)plt.show()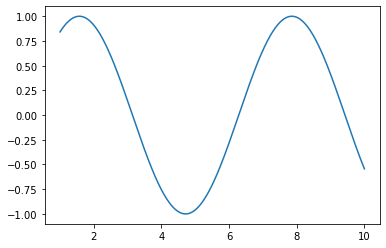
Customizing line plots with Markers, Linestyles, Annotations & Legends
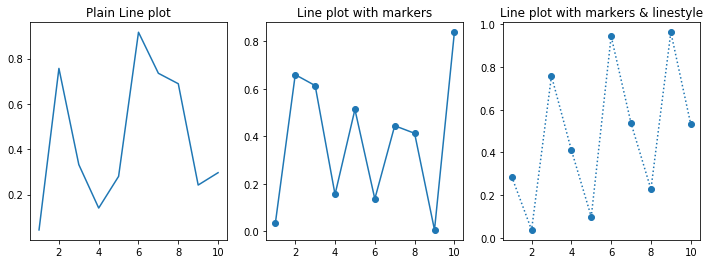 fig, (ax1, ax2, ax3) = plt.subplots(1,3, figsize = (12,4))x = np.arange(1,11)y1 = np.random.random(10)y2 = np.random.random(10)y3 = np.random.random(10)ax1.plot(x, y1)ax1.set_title(‘Plain Line plot’)ax2.plot(x, y2, marker = ‘o’)ax2.set_title(‘Line plot with markers’)ax3.plot(x, y3, marker = ‘o’, linestyle = ‘:’)ax3.set_title(‘Line plot with markers & linestyle’)plt.show()
Let?s try annotating each point with its (x,y) coordinates, this can be tricky because we need to specify the coordinates at which the annotations should appear:
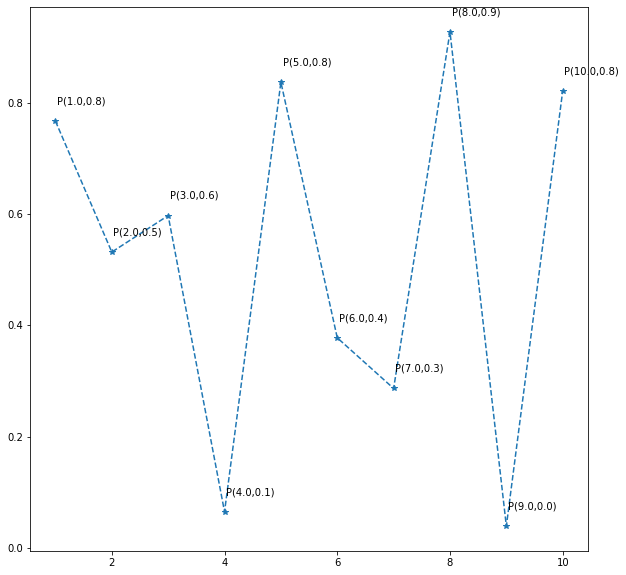 Generating annotations using a simple For loopplt.figure(figsize = (10,10))x = np.arange(1,11)y = np.random.random(10)y = np.random.random(10)plt.plot(x,y, marker = ‘*’, linestyle = ‘–‘)for i in range(len(x)): xi = “{:.1f}”.format(x[i]) yi = “{:.1f}”.format(y[i]) s = str(“P(” + str(xi) + ‘,’ + str(yi) + ‘)’ ) plt.text(x[i] + 0.03, y[i] + 0.03, s)
Multi-line plot & addition of legends:
When there are two or more lines, it?s always a good practice to use legends to specify each line.
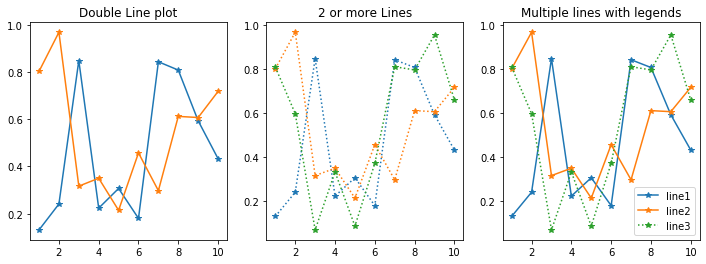 fig, (ax1, ax2, ax3) = plt.subplots(1,3, figsize = (12,4))x = np.arange(1,11)y1 = np.random.random(10)y2 = np.random.random(10)y3 = np.random.random(10)ax1.plot(x, y1, marker = ‘*’)ax1.plot(x, y2, marker = ‘*’)ax1.set_title(‘Double Line plot’)ax2.plot(x, y1, marker = ‘*’, linestyle = ‘:’)ax2.plot(x, y2, marker = ‘*’, linestyle = ‘:’)ax2.plot(x, y3, marker = ‘*’, linestyle = ‘:’)ax2.set_title(‘2 or more Lines’)ax3.plot(x, y1, marker = ‘*’, label = ‘line1’)ax3.plot(x, y2, marker = ‘*’ , label = ‘line2’)ax3.plot(x, y3, marker = ‘*’, linestyle = ‘:’, label = ‘line3’)ax3.set_title(‘Multiple lines with legends’)plt.legend()plt.show()
Hope this was helpful!
See you with another story tomorrow 🙂
Sources:
http://python-graph-gallery.com/line-chart/

