Lessons Learned on Web Development, Data Visualization, and Beyond
Motivation
Back in my undergraduate days, I did a LOT of mathematical proofs (e.g. Linear Algebra, Real Analysis, and my all time favorite/nightmare Measure Theory). In addition to learning how to think, I also learned to recognize many, and I mean many Greek and Hebrew letters.
However, as I took on more empirical work in graduate school, I realized that data visualization was often far more effective in communication than LaTeX alone. From crafting what information to convey to my readers, I learned that the art of presentation is far more important than I originally thought.
Luckily, I have always been a rather visual learner, so when it comes to beautiful data visualizations, they always grabbed my attentions and propel me to learn more. I began to wonder how people published their beautiful works on web; I became a frequent visitor of Nathan Yau?s FlowingData blog; And I am continued to be in awe when discovering visualizations like this, this, and this.
After many moments of envy, I couldn?t resist but to learn how to create them myself. This post is about the journey that I took to piece the puzzles together. By presenting my lessons learned here, I hope it can inspire all those who are interested in learning web development and data visualization to get started!
Setting Learning Goals
For this learning project, one of the things that I did early on was to consult with experts on what essential skills to learn. Fortunately, I received a very detailed answer from Alexander Blocker, a statistician at Google. In his words:
Learning Goals
- Learn how to map your data and analysis to a RESTful API. Data scientists usually like to work with tabular data, often linked across tables by common identifiers and accessed via SQL. Translating this to a set of nouns and verbs in the REST style is a great step towards making your tools and results more widely usable.
- Learn basic AJAX so you can hit your RESTful API from client-side code. I find jQuery the nicest way to get started with this. Also, don?t get hung up on low-level DOM manipulation in Javascript. Learn Selectors and take advantage of all the hard work jQuery developers have put into the problem.
- Learn how to approach layout on the web. This means HTML + CSS. Twitter?s Bootstrap framework is a lovely, well-designed starting point.
- Learn how to build interactive graphics on the client side. D3.js is the most mature way to do this.
My favorite part of his answer is the following paragraphs:
Finally, a bit on mindset. I like to think of building web applications as another way to express your ideas, just like giving talks, writing papers, or distributing R[Python] packages. A working prototype based on a new algorithm or dataset is often far more compelling than a report or command-line tool, especially to non-data-scientists.
Your web apps don?t have to be completely polished and productionised to be useful in this capacity. But, you do need to communicate your work just as clearly in an interactive app as would in any other medium.
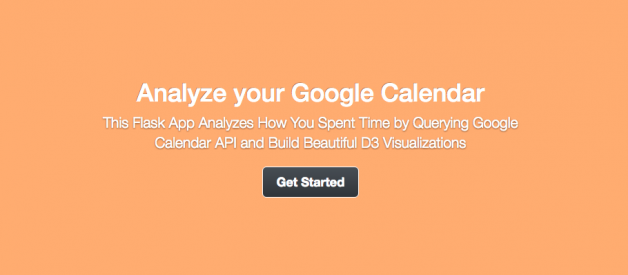
I knew the only way that I could learn how these technologies work together is to build something integral, useful and fun. After some planning, I decided to build a Calendar Visualizer that OAuth to my Google Calendar and display how I allocate and spend my spare time.
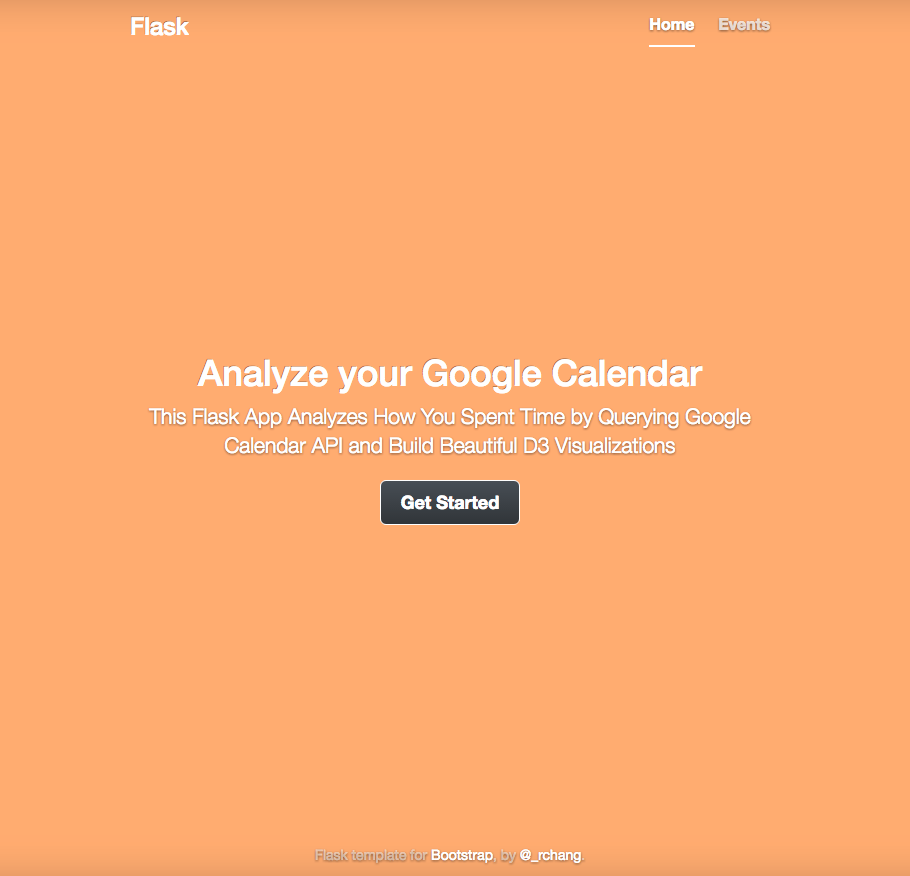 The landing page of my web application
Web Development 101 (with Flask)
When starting out, the first obstacle I ran into was to decide which language to use. I considered both Ruby and Python, but went with Python because I already have some familiarity with the language. Picking between frameworks such as Django and Flask was a bit harder, but eventually I chose Flask because the micro-framework feels more approachable to me ? I could build things bottom-up and extend my web application as needed.
What is a Web Framework?
Coming from a non-CS background, the first transition that I needed to make was to think beyond scientific computing, i.e. imperative style scripting. At first, I was confused by what a Framework meant or why one would need it. It?s not until reading Jeff Knupp?s well articulated post ?What is a Web Framework?? did I realize:
- At the end of the day, all a web application really does is sending data back (think HTML) to browsers/clients through Hypertext Transfer Protocol (HTTP)
- One of the main challenges of building a web application then is to figure out how to process each request and return the right response
- Web Frameworks make these challenges a lot easier because it abstracts away a lot of the lower level works that we otherwise have to do
The Big Picture
To hone in on the above points, here is a schematic that illustrates how a web application works in its essence. Client makes request through HTTP network, Server then processes this request and figures out the right response to return to the Browser. This model is called the client-server architecture.
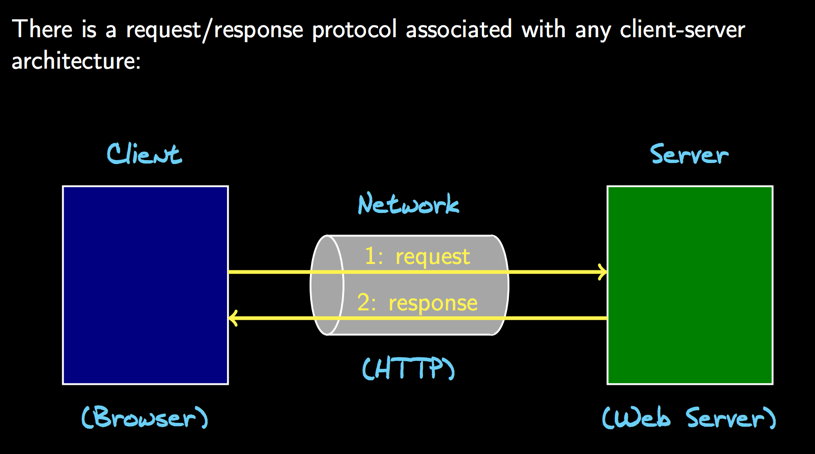 Image Credit: G.L. Heileman, Coursera MOOC, ?Web Application Architectures?
A More Granular Picture
We can zoom in further to take a closer look at the typical architecture of a modern web application:
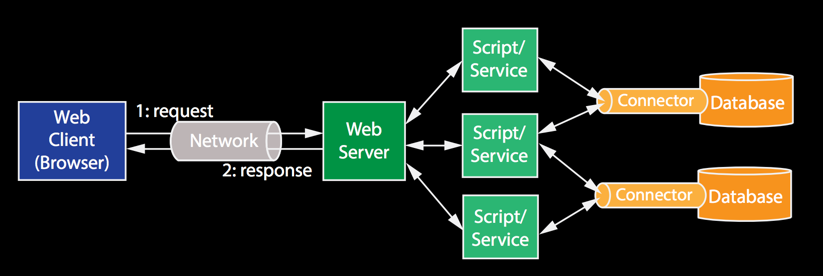 Image Credit: G.L. Heileman, Coursera MOOC, ?Web Application Architectures?
Generally speaking, there are three essential layers in a web application:
- Front-End Layer (Blue): This layer is where technologies such as HTML ,CSS, and Javascript create the look and feel of our application.
- Application Layer (Green): This is the middle layer where business and presentation logic work together to deliver the response back to the users
- Database Storage Layer (Orange): This layer is where data is stored and is what enables a data rich application
Depending on your interests and goals, you might develop more specific skills in one area than the other. Given that my goal was to see how everything worked together, I took a breadth-first search approach and learned just enough to see how each layer works. In the following sections, I will dive into each layer in more details and highlight some of the big ideas and lessons learned.
Application Layer
Let?s start our journey by revisiting the fundamental question ? How does a web server know what information to return for a given request? The key lies in the Application Layer. Web Frameworks like Flask enable us to leverage Routes and Templates which make the presentation logic so much easier.
Routes
In Flask, Routes are enabled by decorators. In case you don?t know what a decorator is, check out Simeon Franklin?s awesome post to learn more! Conceptually, the @route decorators notify the framework about the existence of specific URLs and the function meant to handle them. Flask calls our functions that get a request and return a response views.
When Flask processes an HTTP request it uses this information to figure out which views it should pass the request to. The function can then return data in a variety of formats (HTML, JSON, plain text) that will be used by Flask to create an HTTP response. Let us demonstrate this by an example:
A decorator that matches on /user
The decorator webapp.route, upon receiving a request from /user, evokes the view which returns a HTML table. This is what happened under the hood when a user visits the /user page (see screenshot below).
Big Idea / Lesson Learned: Routes are the fundamental building blocks that enables client-server interaction! To see another simple example how this works, see Philip Guo?s short but instructive tutorial.
Templates
The above example was rather simple, we could hardcode the entire HTML page inline. However, real HTML pages are often more complex, and coding contents inline is simply too tedious, error-prone, and repetitive. In addition, Flask?s philosophy is to make method definitions as simple and as self-explanatory as possible. What can we do? Here comes templates!
The most intuitive explanation of templates again come from Jeff Knupp:
HTML Templating is similar to using str.format(): the desired output is written with placeholders for dynamic values. These are later replaced by arguments to the str.format() function. Imagine writing an entire web page as a single string, marking dynamic data with braces, and calling str.format() at the end. Both Django templates and jinja2, the template engine Flask uses, are designed to be used in this way.
This design enables us to create scaffolds for different but similarly structured HTML pages. It makes presentation logic very customizable and reusable. Let?s revisit our view and see how a template can help:
Functionality wise, this view does the exact same thing as before, it returns the same HTML table. However, the only difference is that the method definition is now much more readable ? to render HTML. Where is the HTML code then? It is actually modularized in user.html:
user.html
Notice that this file does not look like our typical HTML page. It is, in fact, templatized:
- {{ }} represents placeholder: {{ info }} will be replaced by data that are being passed from user_dict.
- {} represents control flow: {% for info in user_dict %} paired with {% endfor %} will create a for loop to create multiple <td> tags
- Template Inheritance: Templates can extend or inherits from other templates, using {% extends ?base.html? %}; It can also include other children templates with {% include ?other.html? %}
All these constructs facilitate us to write flexible HTML templates, and allow us to separate what to present from how to present.
Big Idea / Lesson Learned: Templates do not change what is presented to the users, but it makes the how much more organized, customizable, and extensible. To learn more examples, check out this detailed Jinja template documentation.
Data Layer + RESTful APIs
We now see how routes and templates enable client-server interactions, but where do all the data come from? Introducing database ? the most common way to persistently store data.
Database, SQL, and CRUD operations
Depending on the scale, different databases might be more suitable for handling different traffics. One of the simplest databases is SQLite, where data is persisted in a single local file. However, it is generally not the right choice for data intensive applications (instead, MySQL is the more standard choice). Given that our application analyzes and visualizes events, let?s see how a database can help us to persist this data. First, let us define a data model named dim_events that keeps track of event date, event name, and its duration:
With the table created, we can execute SQL statements to populate the table and perform additional CRUD (Create/Read/Update/Delete) operations. When the application needs to query this data, our database is responsible for handing the data from the data layer to the application layer:
As an example, the show_all_events view needs to display all the events. And one particular way to surface this data is to execute a SQL query inside the view function. The code is simple, readable, but unfortunately problematic:
- Hardcoding SQL logic in the application code is error-prone, just like hardcoding HTML inline. Often, there will be schema updates, table migrations, or changes in business logic. All these changes could break the query.
- There could be security concerns, we generally do not want to expose our data models in the application code, because the application could suffered from malicious attacks such as SQL injections.
ORM and SQLAlchemy
How can we improve this? We need the concept of Object-Relational Mappers (ORM). My favorite explanation of ORM is from Full Stack Python:
An object-relational mapper (ORM) is a code library that automates the transfer of data stored in relational databases tables into objects that are more commonly used in application code. It allow developers to access data from a backend by writing Python code instead of SQL queries.
One of the most popular ORMs in Flask is SQLAlchemy. Instead of creating the dim_events table in SQLite directly, it allows us to initialize the same events table in Python as a Class:
Defining a Table via SQLAlchemy
More importantly, SQLAlchemy allows us to represent data models as Class instances, so interacting with databases in the application layer is now much more natural in the application code. The example below only uses all and filter operators (which is equivalent to SELECT * AND WHERE in SQL respectively), but SQLAlchemy is much more versatile than that!
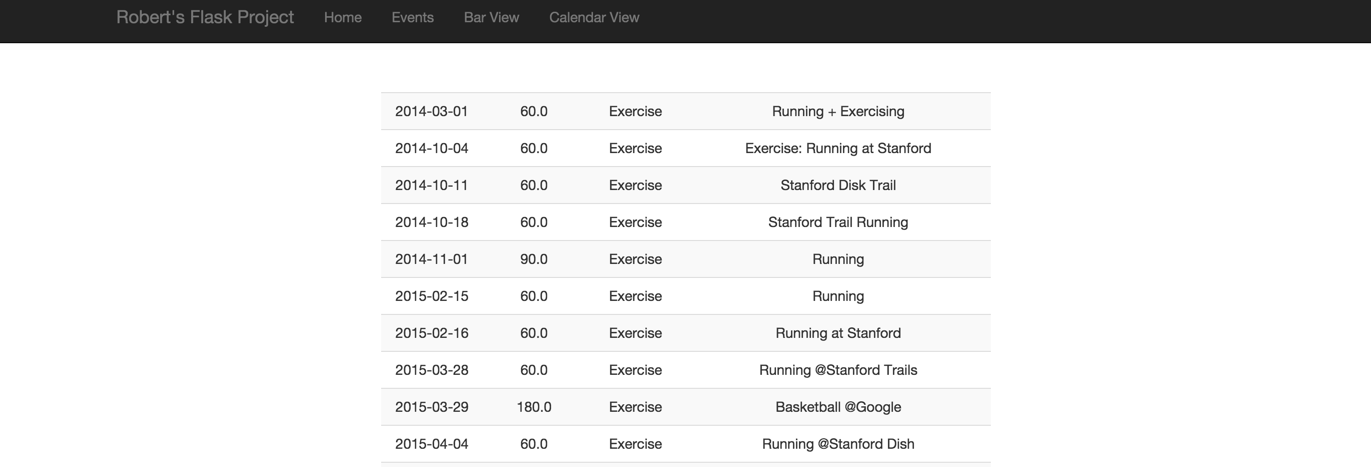
Let?s see all of these hard works in action when we visit /dbdisplay/Exercise:
Big Idea / Lesson Learn: A database enables data to persist in an application. The proper way to query data in the application code is to leverage ORM such as SQLAlchemy. To learn more, check out the official documentation & tutorial.
RESTful API endpoints
Often time, it is useful to expand data access beyond our own applications to third party developers (see here, here, and here). More openness enables more creative usage of data, which means more innovation. One of the most popular standards to expose proprietary data to the public is via RESTful APIs.
A good way to think about RESTful APIs is that they act as functions ? functions that take in specific parameters as inputs and output standardized data in a controlled manner. The entire execution of the ?function call? happens via HTTP: arguments are passed as part of the URL parameters, and data is returned by the function as a HTTP response.
With tools like SQLAlchemy, building API endpoints is actually not too different from what we have already done. Views take in the URLs and issue specific queries in order to return the results based on the parameters. Below are the two views that we have seen before, but slightly modified. Notice the only thing that really changes is the return type of the data is now in JSON.
A list of API endpoints
Let?s see how things work when we hit these API endpoints:
Big Idea / Lesson Learned: APIs are convenient endpoints for developers to expose proprietary data to the outside world in a controlled manner. The specification of the data request is often composed as parameters in the URL, data are returned via HTTP, and often are presented in JSON form. I highly recommend reading Miguel Grinberg?s long but engaging post to learn more.
Next up, we will see how everything (routes, templates, database, API endpoints) fits together to create what we are going after in the first place ? data visualizations.
Front End Layer
The front end layer is the closest layer to the end users, and requires a lot of design and creativity. For the scope of this post, we will focus on how to display data visualizations using D3.
Creating Interactive Charts with D3.js
First of all, if you don?t already know D3, I highly recommend Scott Murray?s Interactive Data Visualization, it was one of the most valuable resources for me to start learning D3! Like many others, my first exposures to D3 came from tutorials. Typically, a simple example would hardcode a fake dataset, and explain in length how to create a bar/pie/line chart out from it.
While they are educational, I always had little idea on how things really work in a real application, i.e. Where do data come from? As I gained more experiences, I learned that D3 actually offers a wide range of options to load data into the browser, one particular method is called d3.json.
A JS example to retrieve data into the browser using d3.json
This makeGraph function takes two arguments ? an URL and a callback function (not implemented in the above code snippet).
- The URL is where we will ask for data
- The callback function will execute once the data arrived (asynchronously)
The callback function will take that data, bind it with DOM elements, and display the actual visualizations on the browser. This is usually the place where we write our D3 visualization code.
Let us see this through by a more elaborate example. In my web app, there is a tab called ?Calendar View? that allows a user to display her activities in the form of calendar heatmaps:
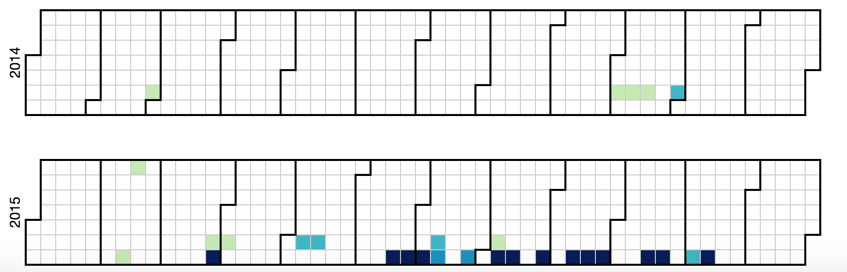 I tend to run on Saturdays and play basketballs on Sundays
For this visualization, each cell here represent a single day. The color intensity represents how much time I spent on a particular activity on that day. In the plot above, each highlighted block means that I did some form of exercise on that day. It?s obvious from the chart above that my New Year Resolution is to exercise more regularly in 2016.
Where does it fetch the data, and how does it display this information? How does one construct a calendar? Let?s deconstruct this step by step:
- First, when a user goes to the ?Calendar View? tab, the particular URL /calendar will trigger the view plot_d3_calendar. It will then render the calendar.html template ? a pattern that uses routes and templates.
Calendar View Decorator
- calendar.html contains all the things we need to render the HTML, but an important part of this file is a Javascript file called calendar.js, which will be executed as part of this rendering ? Notice the HTML file is templatized.
calendar.html
- In calendar.js, I defined an event listener and a callback function called makeCalendar. When a user clicks on a specific event button, the click event will trigger makeCalendar to query the API endpoints for data. The code in d3.json will be responsible for creating the D3 visualization ? Notice that we are hitting the API endpoint we built just earlier.
The part in calendar.js that renders the calendar visualization
For each of the visualization that is being rendered, that?s essentially what is happening under the hood:
https://www.youtube.com/watch?v=-vJXKNODlFQ
Big Idea / Lesson Learned: When a request triggers a view, the view will attempt to render the HTML and execute the Javascript file. The D3 code in the Javascript file will issue a query to the API endpoint, and returned data will be bind to actual DOM elements to be shown on the web browser. Routes, templates, databases, and APIs all work together to get this done! To learn more, here is another illustrative example that study BART data.
Beautify-ing UI Using Twitter Bootstrap
Now that we have all the essential components for a functional web application, the last touch is to beautify the look and feel of this application. During my time at Twitter, I noticed that a lot of the internal tools tend to have the same looks, then our designer pointed out to me Twitter Bootstrap:
A front-end toolkit for rapidly developing web applications. It is a collection of CSS and HTML conventions. It uses some of the latest browser techniques to provide you with stylish typography, forms, buttons, tables, grids, navigation and everything else you need in a super tiny resource.?
Twitter Bootstrap is extremely powerful because it enables us to upgrade the look and feel of my application very easily. Below is an example where headers and table formatting essentially come free because of Twitter Bootstrap:
Big Idea / Lesson Learned: If you are interested in Design and UI, don?t re-invent the wheels. There is no shortage of layouts, components, and widgets to play with in Twitter Bootstrap. To learn more, I recommend this tutorial.
Summary
In this blog post, I barely scratch the surface of web development, but the goal was never to be comprehensive. Rather, I am interested in sharing my experience and point other enthusiasts to great resources in order to learn more. A little effort goes a long way, I am now able to present my analyses in more expressive and interactive ways!
For Data Scientists, there are certainly more lightweight approaches to produce (interactive) data visualizations, using tools such as ggplot2, ggviz, or shiny. But I think learning how a web application works in general also make one a stronger DS. For example, if you ever need to figure out how data is logged in an application, knowing how web application tend to be built can help you so much in navigating the codebase to do data detective works. This knowledge also helps you to establish common languages with the engineers in more technical engineering discussions.
If you are inspired, there are many more resources written by programmers who are much more qualified than I am on this topic (see here and here).
Start Flasking and keep hacking!
I would like to thank Krist Wongsuphaswat, Robert Harris, Simeon Franklin and Tim Kwan for giving me valuable feedback on my post. All mistakes are mine, not theirs.
