An article by competitor price tracking software ? Prisync.
Price index formula is a way to normalize the average of price relatives within specific groups or classes of goods or services, throughout various different regions at various different time frames.
In the world of e-commerce, it?s a great way to compare how prices differ based on time periods or geographical locations. On a broader scale, price indices are used to measure an overall economy?s price level and or cost of living.
But on a much narrower scale, you can use price indices to help you position your price point within your eCommerce store.
Why consumer price indices should include the eCommerce industry?
The consumer price index (CPI) is a key indicator for banks to uncover the rate of inflation. However, until now, eCommerce has largely been ignored.
But this makes no sense, more and more people are going online to buy their purchases, so these statistics should be included, right?
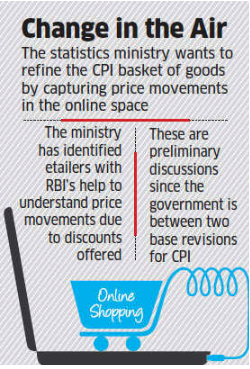
With so many transactions for goods and products happening online, it?s no wonder policymakers are moving closer to tracking the price movements in the online space.
Very similar to what we encourage eCommerce store owners to do on an individual level.
How to use price index formula in your own eCommerce store
As we mentioned, the ecommerce price index allows us to see price changes over a set period of time, for specific product categories in specific geographic locations.
This data is then used to measure inflations.
In order to successfully calculate consumer price index, a four-step process is involved.
- Fixing the market basket
- Calculate the baskets cost
- Compute the index
- Compute the inflation rate
Now if you?re new to the world of economics and eCommerce, some of these terms might seem confusing, but don?t worry we?ll go into more detail as to what each one pertains.
Fixing the market basket
If you?ve never heard of the phrase ?fixing the market basket? then in its simplest terms, it refers to all the goods that consumers buy within a specific reference population. For example, you might look at the rural population within Europe.
The CPI market basket includes a range of categories from specific overarching groups. To calculate this, market leaders use surveys to collect information from households to get a clear indication of of their expenses and how these align with purchases goods.
When all the data is collected, analysts are able to determine the importance of various items within specific categories.
You then fix these prices as an average to work out the subsequent costs.

For example, if you discover that every consumer buys 3 sets of headphones and one phone, you fix the market basket at 3 sets of headphones and 1 phone.
Calculating the basket?s cost
When you?ve fixed the market?s basket, it?s time to calculate the basket?s cost. This involves looking at current and previous prices for specific goods. Very similar to how you?d compare previous and current prices of your competitors products and goods.
However, do keep in mind, when analysts calculate the basket?s cost, they don?t change the quantity of the goods.
In our above example, the fixed market basket is what they use to calculate the cost. In this sense, the only variable they can use is price. Doing this allows us to isolate price so we?re only concerned with looking at the price changes of specific categories.
Let?s relook at our headphone and phone example.
If in 2017 headphones cost $10 and phones cost $100. The total cost for 3 sets of headphones and one phone comes to $130.

Now, let?s say in 2018 we now pay $20 for headphones and $200 for a phone. The total basket cost for these items is now $260.
We can see that the price level has increased from 2017 to 2018.
Computing the index
But what do you do with this information? So you?ve noticed that across the board, on a fixed market basket, prices for a specific category have increased. How do you actually use this information?
Well, now we actually need to calculate the ecommerce price index. But in order to do that, a base year should be defined. This acts as a benchmark to compare the rest of the years to.
Market analysts tend to use the same year across the board, to keep things accurate when comparing.
Worldbank, for example, reports CPI data with the base year of 2010. To calculate it, divide the overall price of the basket of goods in any given year by the same basket size in the base year. Then multiply this number by 100. You?ll now have your consumer price index (CPI).
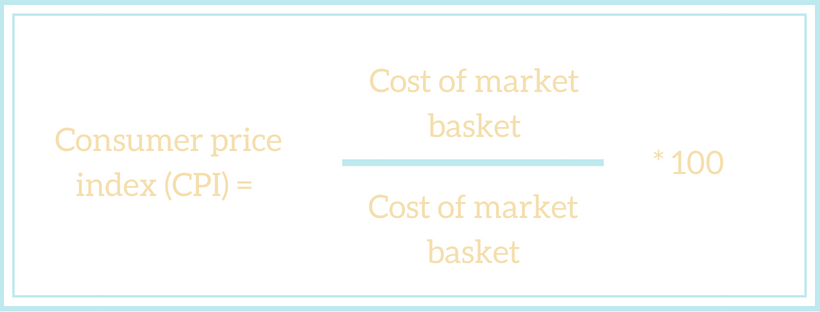
Note, the base year will always add up to 100. But during the changed months, you?ll be able to see how much it?s changed.
Back to our example,

If we take headphones and phone from the year 2017: we have to 130 by 130 then times by 100.
[130/130] x 100 = 100
But if we take 2018, we have to do
[260/130] x 100 = 200
So we now see the consumer price index has increased by 100.
Using CPI to calculate inflation
Inflation is defined as ?a situation of a sustained increase in the general price level in an economy. Inflation means an increase in the cost of living as the price of goods and services rise.?
Market analysts use CPI to understand inflation rate. You calculate inflation by looking at the percentage increase or decrease in the price index from one period to the preceding one.
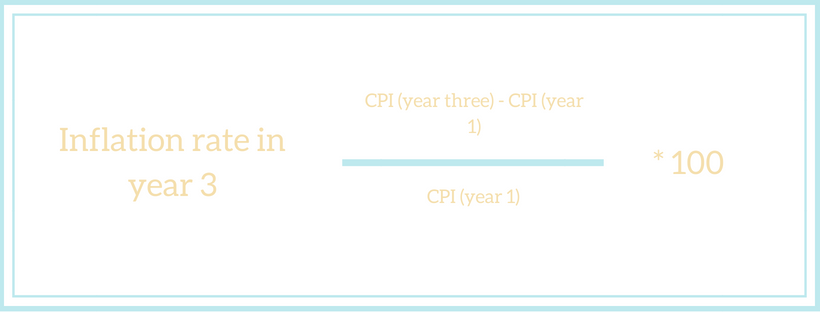
Using ecommerce price index formula to calculate competitor?s impact on your sales
You can use ecommerce price index formula to work out how much of an impact your competitors will have on your own sales targets.
In this section, we?re going to help you define who you actual competitors are, and use the price index to see who influences your sales the most.
We explained earlier in this article how market analysts look at price indices on a broader scale, but we also mentioned in the introduction that you can use these techniques on a narrower scale to understand your competitor in much better detail and see how their prices affect your own sales.
One use-case would be: you as a retailer looking at your monthly sales and looking for reasons why it increased or decreased.
When you match the price index to sales, you can get a clearer idea of historical sales and price data.
Calculating price index in your own eCommerce business
When you calculate your own price index in your e-commerce store, you?ll be able to see where your own product prices and your competitors intersect.
When you?ve filled in the table above, you need to divide the competitor?s price with your price and times that figure by 100%
For example,
5/3 x 100= 166%
And if you?re looking for the average ecommerce price index for any given product, add up all the price indexes for the product in question and then divide by number of competitors analysed.
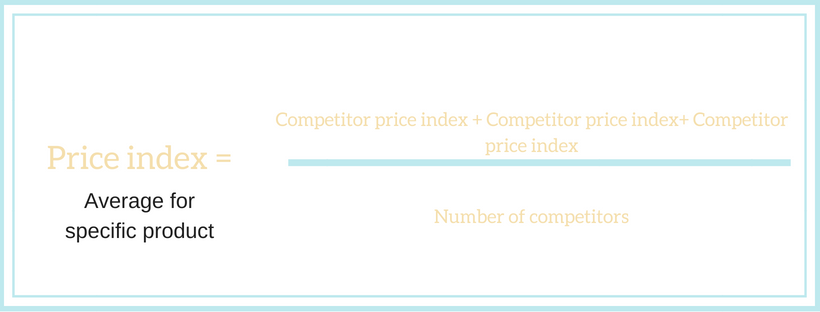
Then when you?ve done that, you need to work out the average price index. You do that through the following equation.
Conducting these calculations will present you with a load of data. It will be best to use a visual graph or chart to see the data and the various deviations.
You?ll be able to see your competitors? pricing over time as they change. If you also add your own sales metrics to the same chart, you?ll be able to see how your own sales are affected by the changes in your competitors? pricing.
You might, for example, discover that over time, your products have usually been more expensive than two of your competitors, but always cheaper than one of your competitors.
You might also discover that when one of your competitors increases their prices, you see an increase in your sales.
Ecommerce price index formula final thoughts
Although consumer price index formula definitely falls into the realms of more advanced pricing techniques, it?s a useful one to consider if you want to scale your eCommerce store and reach higher levels.
However, using ecommerce price index, whether it be on a narrow scale for your own store, or on a much larger scale by looking at regional or even global records, you?ll get a clearer idea of inflation and how your products are priced within a specific market.
Have you tried using price indices to price your products accurately? Leave a comment below.

This story is published in The Startup, Medium?s largest entrepreneurship publication followed by 343,876+ people.
Subscribe to receive our top stories here.

