The North Carolina General Assembly recently passed a new Congressional district map. While it happened, I was following very regular and map-filled updates on the topic from Stephen Wolf, a Daily Kos elections expert. He has done a partisan analysis of the map, forecasting a likely 8?5 split.
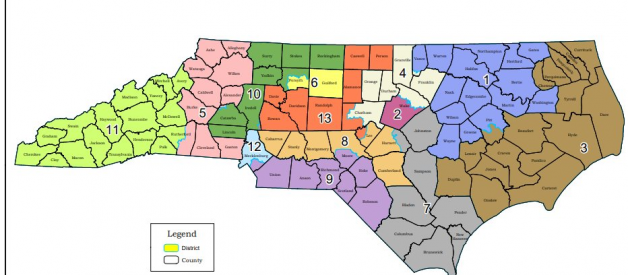
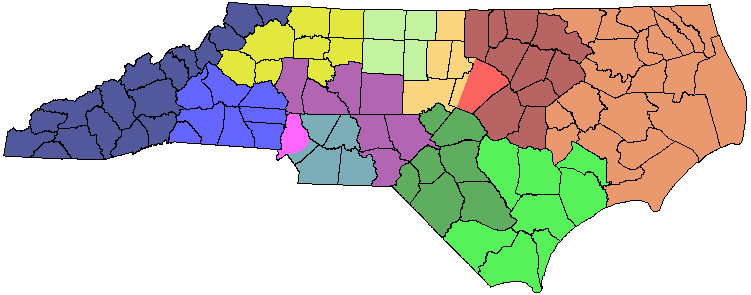
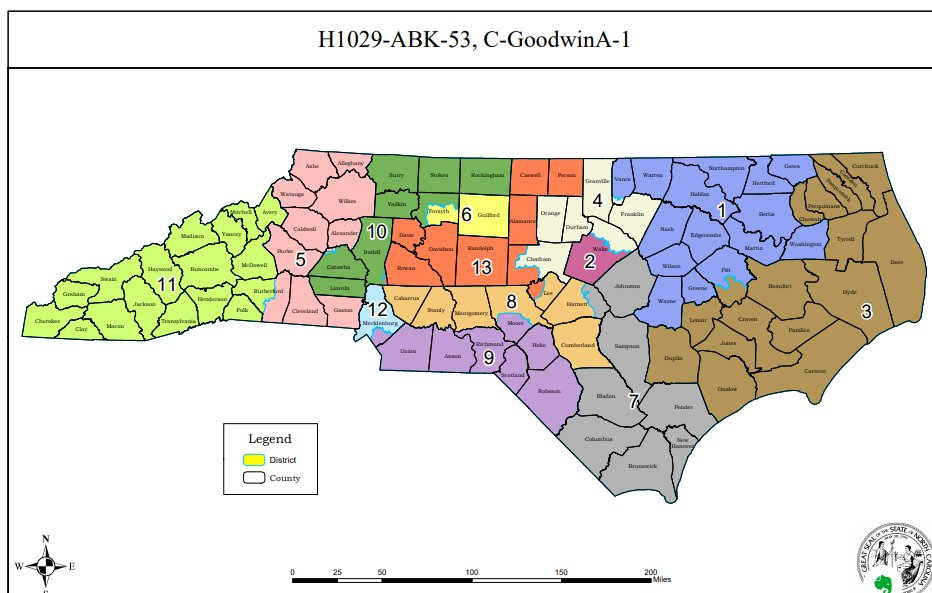 The map passed by the NC GA, which will be in effect for the upcoming 2020 congressional elections.
It?s worth noting, first, that when the map breaks county lines, there are some cases in which it makes districts less compact. It?s necessary to divide some counties in order to make district populations exactly match, but it?s possible to do this in ways that make districts more, rather than less, compact. For example, there is a very odd S-shaped boundary cutting through Chatham and Lee counties, and Pitt County is cut through the middle by a boundary that wiggles back and forth like a snake.
There are somewhat wiggly boundaries inside the largest counties ? Mecklenburg, Wake, and Forsyth ? though it?s worth noting that Wake and Mecklenburg must be split, as both counties have populations larger than a single congressional district. Kudos to the legislators for making the obvious step of including one district entirely inside both counties.
The map is? from a partisan perspective ? a major improvement on the previous gerrymander, and is advertised as likely to elect an 8R-5D split rather than the current highly non-representative 10R-3D split. It still looks very much like a gerrymander, however, and underlines the need for non-partisan drawing of maps.
Constellations of counties
The districts are based on counties, which ? as objective pre-existing political subdivisions ? makes logical sense. A majority of counties are kept as intact as possible, which is a feature of this map that differentiates it from many egregious gerrymanders seen in North Carolina in the past. If we draw each district as a constellation of counties, we get an interesting picture of the choices made by the Republican state legislature.
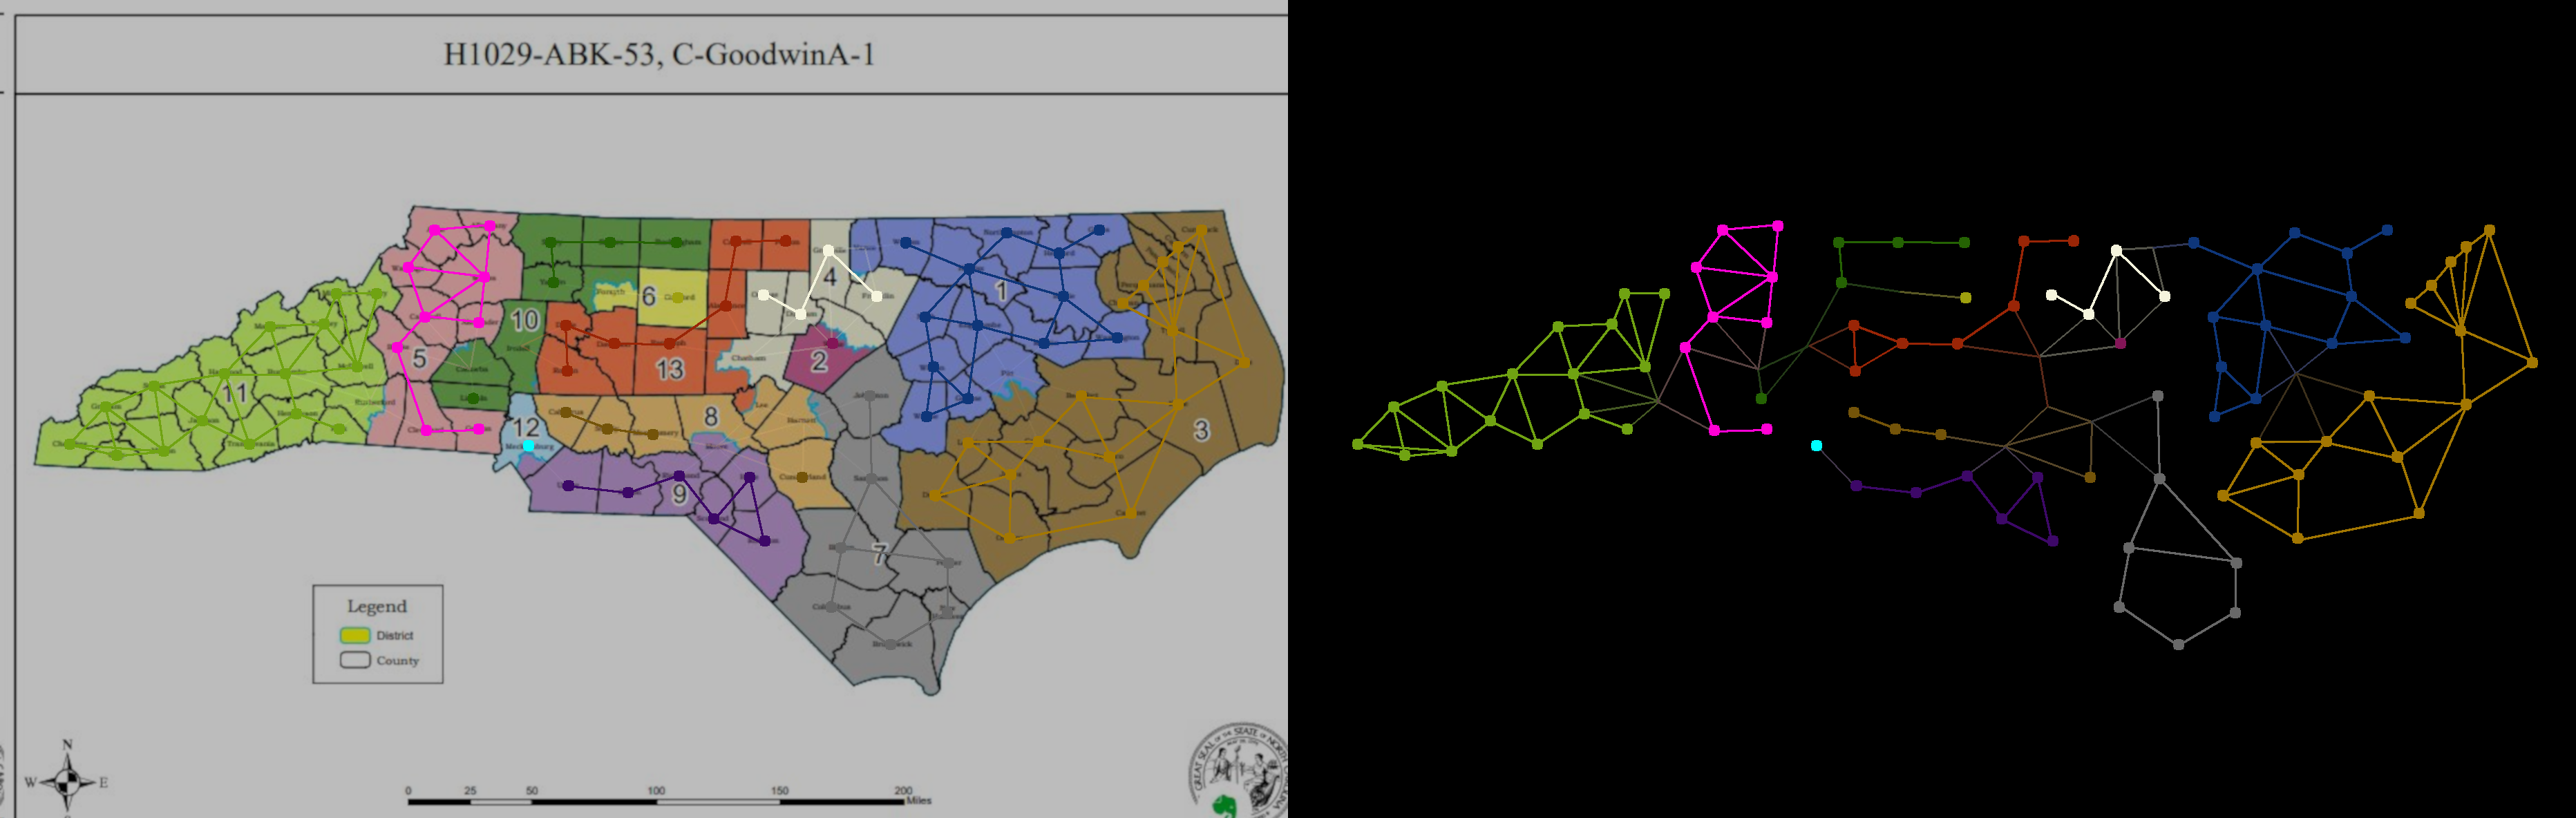 Counties that are divided as little as possible are marked with solid dots. Counties divided between districts are connected to both districts with dim lines. It may be difficult to see the portions of Catawba and Iredell counties that are excluded from District 10 in the left-hand map.
Some districts, like District 11, are compact and well-connected. Others, including Districts 4, 8, 9, 10 and 13, are largely built out of long chains of counties that share fewer common borders; in the case of 8 and 10, some of the counties in the middle of the chain are not complete. We can also identify outlying counties in Districts 1, 5, and 7 that are minimally connected to the rest of the district.
Here, we can see the chain structure fairly clearly. The Charlotte suburbs anchor five very linear chains of counties that reach all the way to the northern boundary of the state.
In an odd S-shape, District 1 curls around the northern coast of Albemarle Sound, while District 3 cautiously avoids Washington County. District 5 swoops around Lincoln County and most of Catawba County in order to reach the suburbs of Charlotte. District 13 pointedly swerves around Orange County.
The geography of the districts
If we superimpose the districts over maps showing the physical geography of the state, it very quickly becomes clear that the districts are not grouped on the basis of the natural geographic divisions of the state.
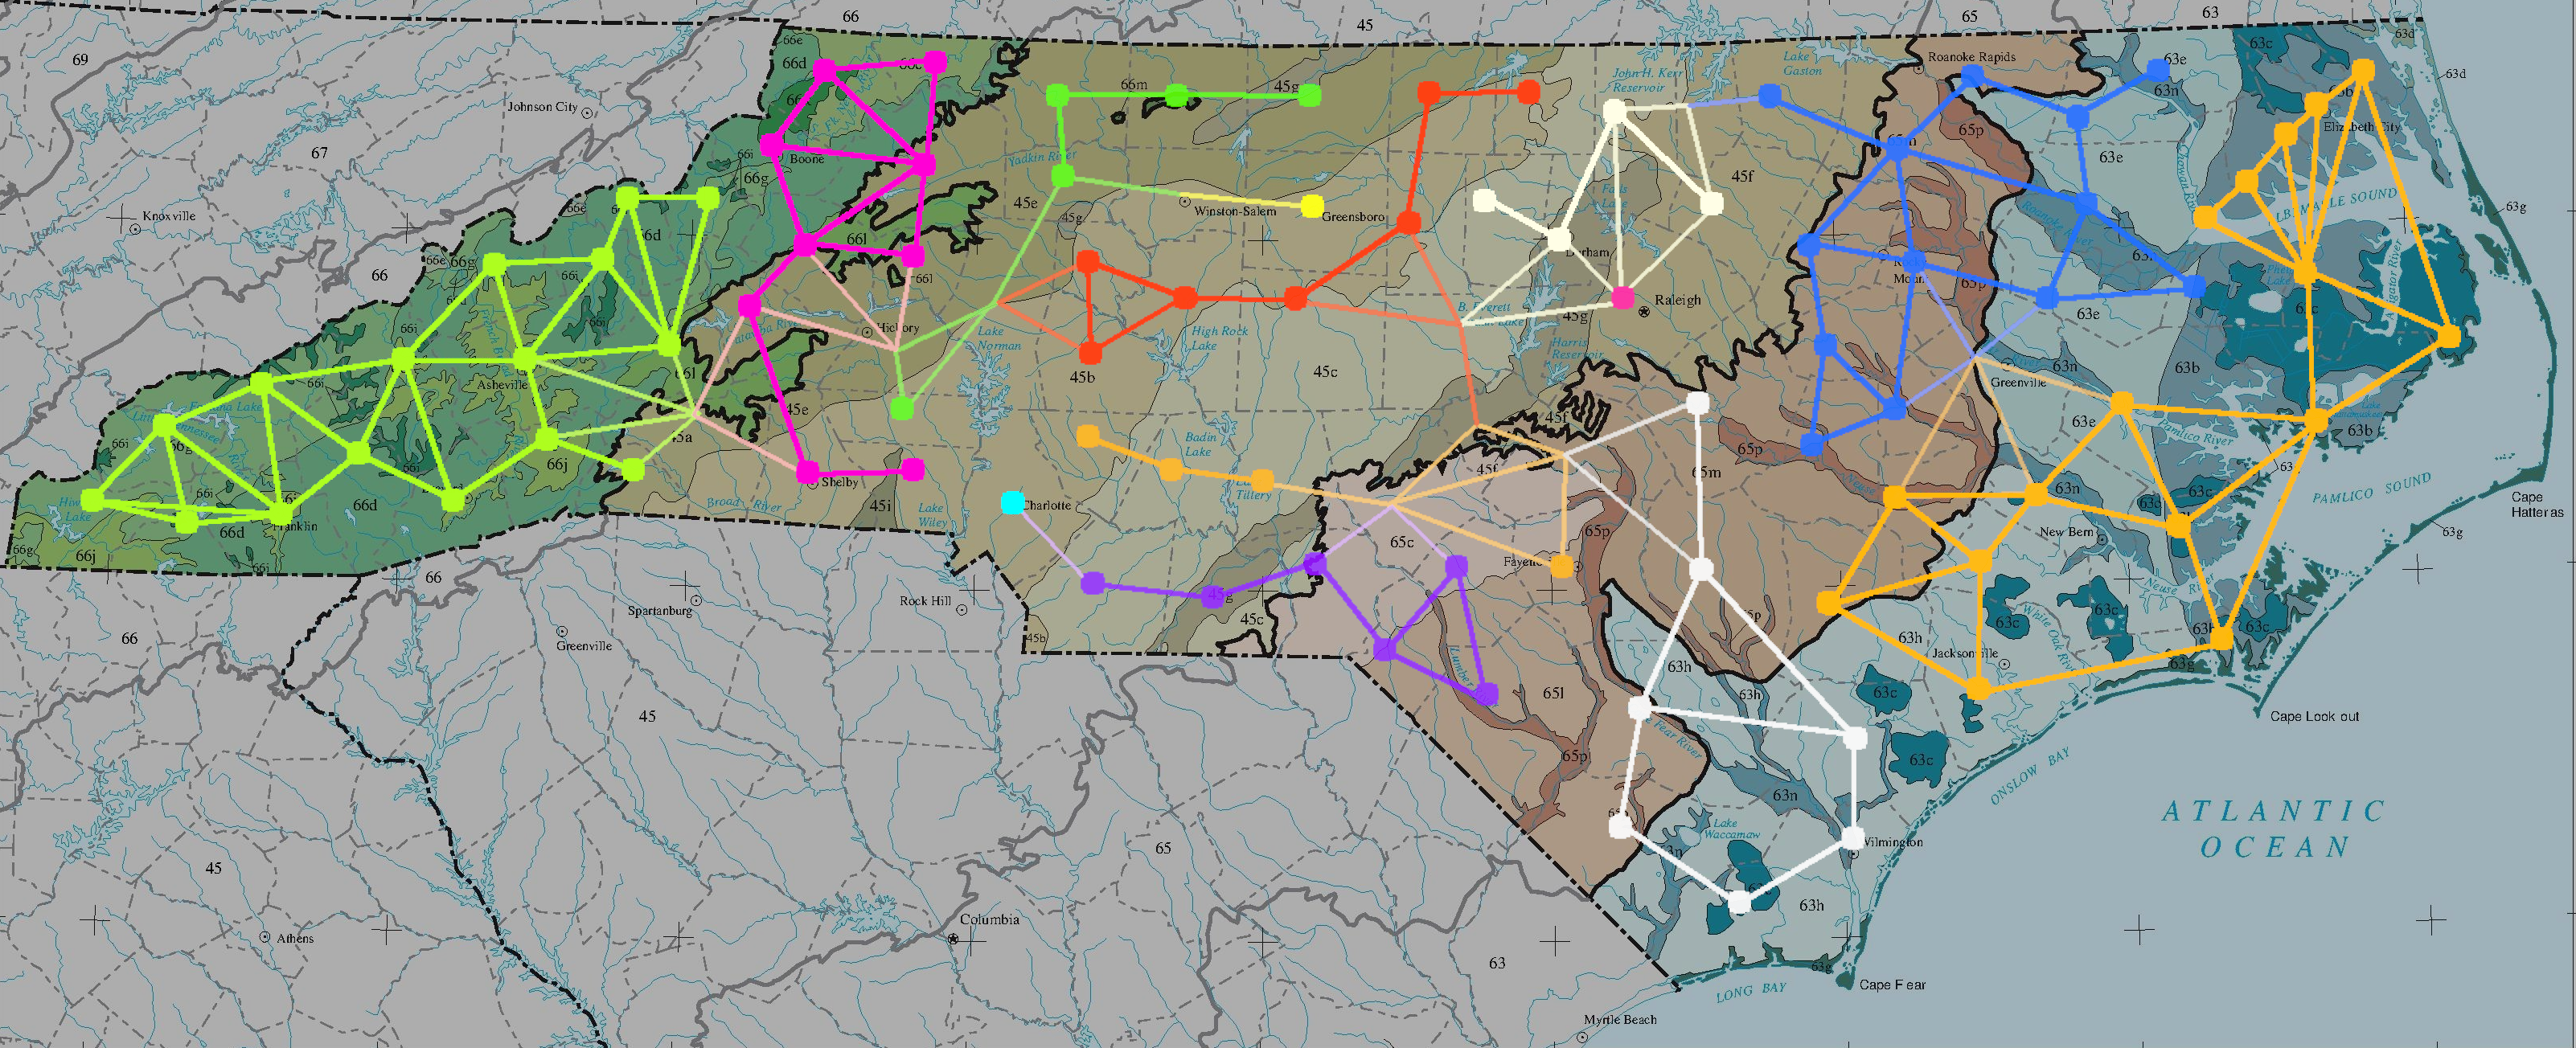
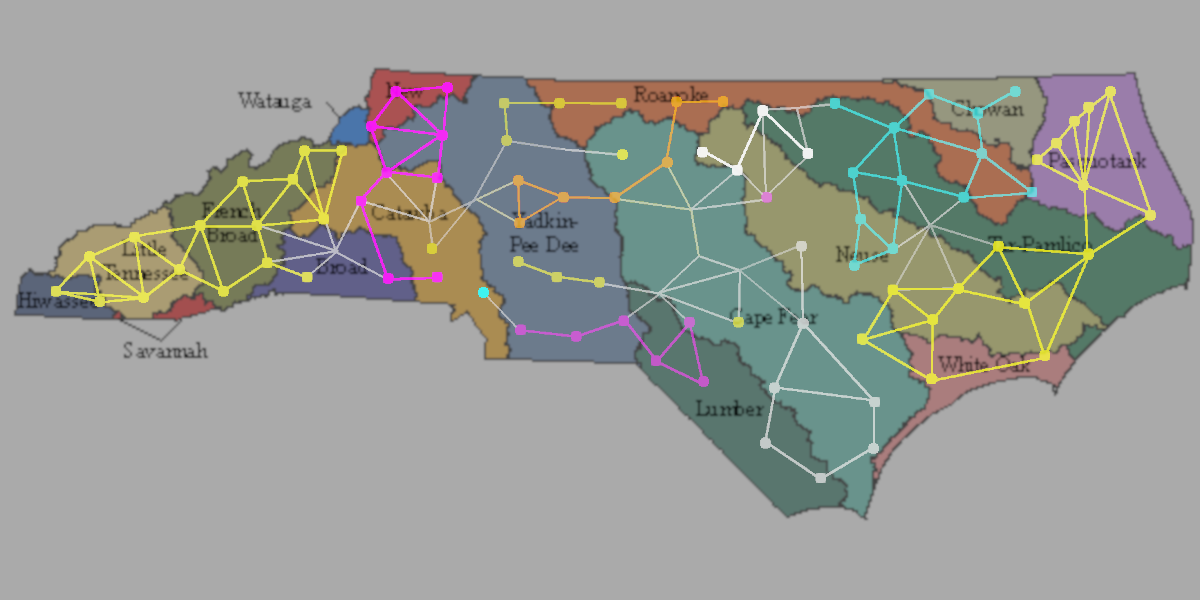 District constellations over river basins ? which historically naturally linked communities, and continues to link their ecological interests.
The District 5 borders three different states, sweeps across five different river basins, and spans a diverse range of communities from Appalachia to suburbia. District 1 similarly spans five different basins and a variety of ecologies, reaching from the southern coast of Albemarle Sound up into the hills of the Piedmont.
 District ?constellations? overlaid on an ecological map of North Carolina from here.
Many identifiable regions of the state are divided rather than kept together. The highlands, which can be fit tidily into one congressional district, are divided into two; the coastal counties, which could easily be fit into two districts, are divided into three.
The most egregious case of fragmentation happens around Charlotte. Charlotte and its suburbs account for one quarter of the state?s population, but almost half of its Congressional districts can be found in the region. This includes one central district, and five sprawling districts that strategically divide up Charlotte?s suburbs, attaching them to far-flung communities across half of the state.
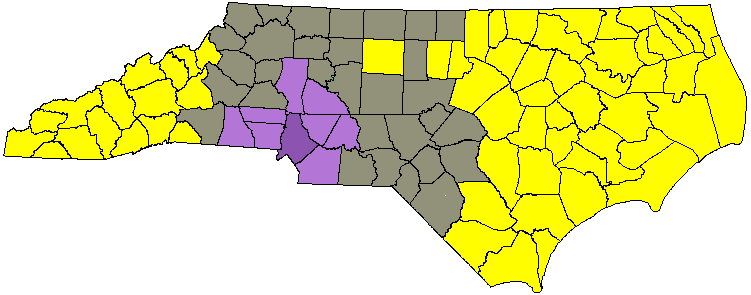
To illustrate exactly how much of the state is attached to Charlotte?s suburbs by this map, I?ve highlighted the Charlotte metropolitan area (purple) as well as the the counties that share Congressional districts with Charlotte?s suburbs gray).
Is this map a gerrymander?
A gerrymander is a division of political districts that deliberately favors one political party over another. In this case, this is a map that could easily elect 8 Republicans and 5 Democrats in an election where Democrats earn a majority of the vote, and displays a number of oddities. Those oddities cannot be explained by attempts to keep together regions of the state with common regional interests, which strongly suggests that the oddities are politically motivated.
 A county-level perspective on the districts built from the Charlotte suburbs.
Charlotte?s suburbs are spread between five districts that radiate outwards to connect with distant counties, instead of being contained in two or three districts consisting of the nearby counties that share similar regional interests. In Stephen Wolf?s analysis of the partisanship of these districts, all five of these districts are expected to elect Republicans. This directly links the partisan effects specifically to the oddities of the map.
What?s good about this map?
There are several things about this map that are objectively better than many previous maps. I will talk about two non-partisan factors and then explore the partisan factor.
First, it?s worth noting that before Republicans were forced to redraw the map in 2016, congressional districts commonly were not based on county lines at all. Counties being kept largely intact is a significant improvement on previous practice. The maps that were in effect for the 2002 and 2012 elections were particularly egregious examples.
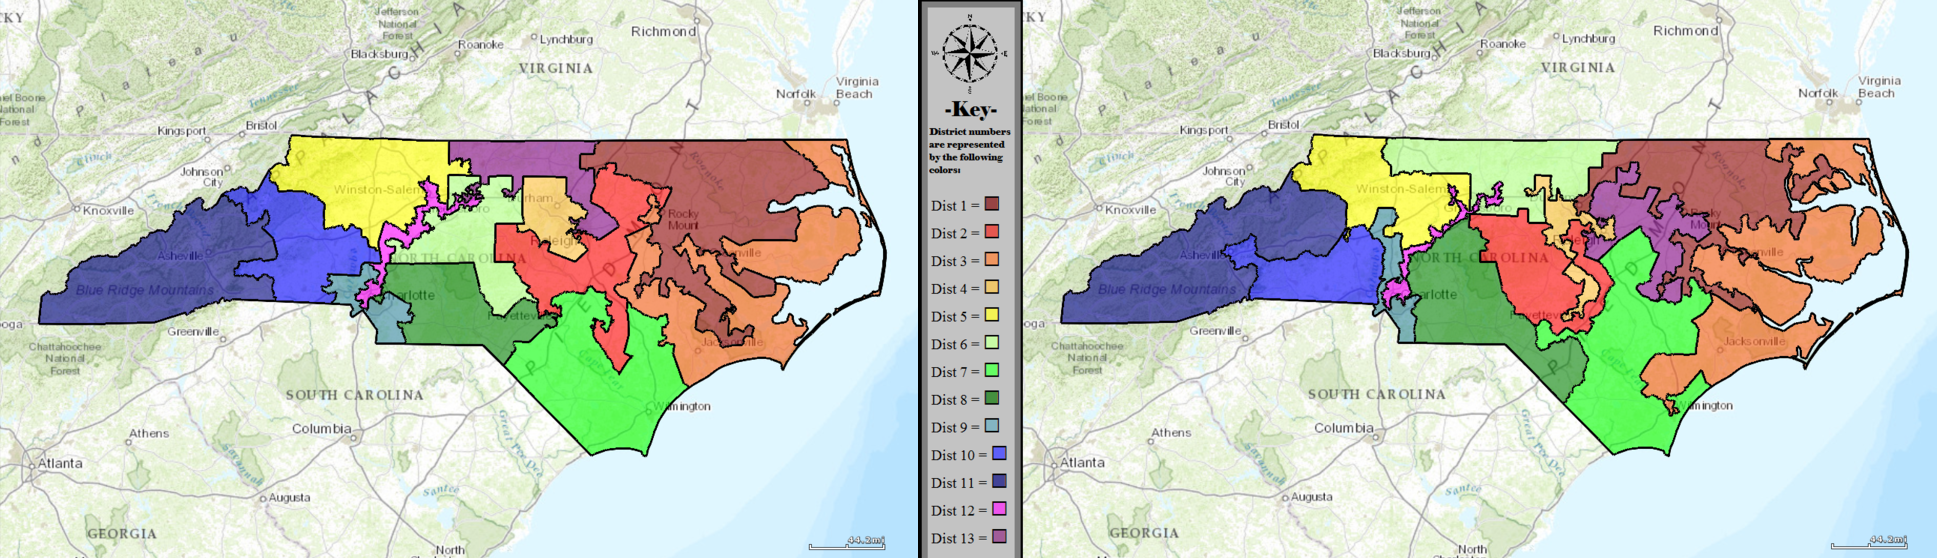 Maps in effect for 2002 elections (left, drawn by Democrats) and 2012 elections (right, drawn by Republicans).
Second, it does not divide as many of North Carolina?s larger cities and communities as previous maps. Since cities usually stay within the boundaries of a given county, the fact that cities are not often divided is mostly a consequence of the fact that the map is based primarily on whole counties, but one of the notable divisions of a county (Forsyth) has been done in a way that keeps the largest city in the county (Winston-Salem) intact.
This social compactness extends to the two major multi-county clusters of cities that share a community: The newly proposed 6th District puts the three traditional corner cities of the Triad together in one district, and the three corner cities of the Triangle are contained within two districts (2nd and 4th). The Charlotte metropolitan area may not have been kept together, but the other two major population centers were.
Third, this map is ? while clearly a partisan gerrymander ? a less egregious gerrymander by a significant degree. While the map still ties Charlotte?s suburbs to far-flung communities across the state, the districts are slightly less egregiously non-compact (physically and socially). The partisan impact is also significantly smaller; in partisan terms, this map is more closely comparable to past Democratic gerrymanders of the state.
A gerrymander designed to produce an 8R-5D split (R+3 delegation) in an election where voters are evenly divided between the two parties is less than half as egregious as a gerrymander designed to produce a 10R-3D split (R+7 delegation) under the same circumstances. A fairly drawn non-partisan map would often produce a 7R-6D or 6D-7R outcome in North Carolina as the state?s politics currently go.
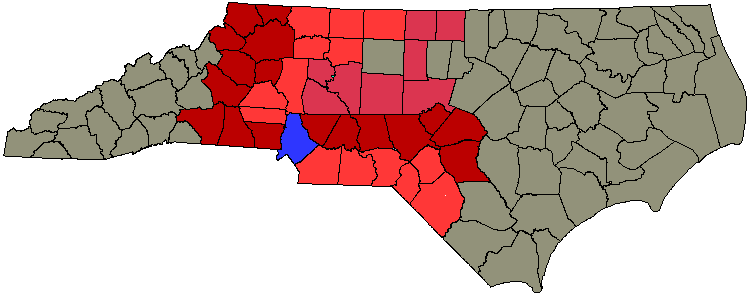
 The author?s own attempt at roughing out a fair map based on whole counties. Boundaries would require minor further adjustments.
A fair nonpartisan map would be better, but this map is not as bad ? and if the 2020 election is exceptionally good for Democrats, they may be able to win 6 or 7 seats.
Looking to the future
Whatever map is in place will only be in effect for a single election cycle, and Democrats could take control of one or both chambers of the North Carolina state legislature in 2020. In addition to the continued shifts in population between the counties, North Carolina is likely to gain an additional district in reapportionment following the census of 2020 due to population growth.
If history tells us anything, the party in power in North Carolina ? whether Democratic or Republican ? will want to draw their own maps with their own ends in mind. North Carolina?s congressional districts and state legislative districts have been repeatedly subjected to intensive gerrymandering. It?s important to put a system in place that will help prevent gerrymandering.
In this case, the correct course of action is to push for maps drawn by an independent commission ? a non-partisan commission with a transparent process and ordinary citizens, rather than politicians, in charge.

