Providing intuition to the Log Loss performance metric
Why Log Loss ?
When doing a classification model, you have a multitude of metrics of performance available to optimise your models, quantify their performances, compare them and improve them.
You may probably choose among the commonly used metrics from the confusion matrix ? such as Recall, Precision, F-Score or Accuracy.
You may also use a metric of loss, such as the Log Loss. In a Kaggle contest, an Australian telecom leader asks you to improve the reliability of their network. They chose to rank the participants? models with the Log Loss.
The Log Loss metric takes into account the probabilities underlying your models, and not only the final output of the classification. The bolder the probabilities, the better will be your Log Loss ? closer to zero. It is a measure of uncertainty (you may call it entropy), so a low Log Loss means a low uncertainty/entropy of your model. Log Loss is similar to the Accuracy, but it will favor models that distinguish more strongly the classes. Log Loss it useful to compare models not only on their output but on their probabilistic outcome.
Like any metric, you will need to interpret it. So you will need some reference values to compare it.
A good metric is at least better that the ?dumb?, by-chance guess, if you would have to guess with no information on the observations. In other words, a model should be at least better than the non-informative model.
The ?dumb?-guess depends on 2 factors :
- the number of classes
- the balance of classes : their prevalence in the observed dataset
In the case of the Log Loss metric, one usual ?well-known? metric is to say that 0.693 is the non-informative value. This figure is obtained by predicting p = 0.5 for any class of a binary problem. This is valid only for balanced binary problems. Because when prevalence of one class is of 10%, then you will predict p =0.1 for that class, always. This will be your baseline of dumb, by-chance prediction, because predicting 0.5 will be dumber.
I. The number of classes makes the dumb-LogLoss higher
In the balanced case (every class has the same prevalence), when you predict p = prevalence = 1 / N for every observation, the equation becomes simply :
Logloss = -log(1 / N)
N being the number of classes ; log being Ln , naperian logarithm for those who use that convention)
In the binary case, N = 2 : Logloss = – log(1/2) = 0.693
So the dumb-LogLosses are the following :
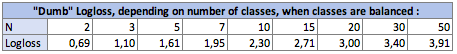
II. The prevalence of classes lowers the dumb-LogLoss, as you get further from the balanced case
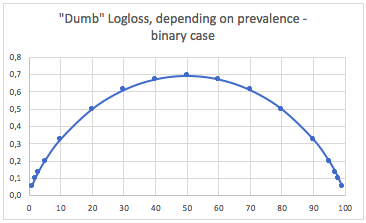
a. Binary classification case
In this case, we predict always p(i) = prevalence(i), and we obtain the following table :

So, when classes are very unbalanced (prevalence <2%), a Log Loss of 0.1 can actually be very bad ! Just the same way as an accuracy of 98% would be bad in that case. So maybe Log Loss would not be the best metric to use in that unbalanced case.
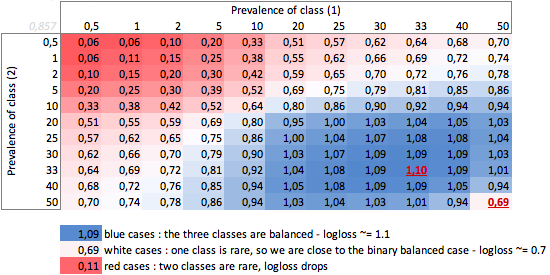
b. Three-class case
Dumb-LogLoss depending on prevalence ? three-class case :
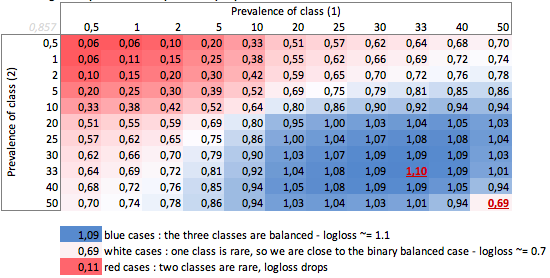
We can observe in the balanced three-class case, when each class has a prevalence of 33%, that Log Loss = 1.10.
Any other distribution of prevalence will make the Dumb-LogLoss drop.
* * CONCLUSION * *
Log Loss is hard to interpret. A Log Loss of 0.69 may be good in a multiclass problem, but very bad in a binary biased case.
Compute your dumb LogLoss
Depending of your case, you would better compute yourself the baseline of the problem, to check the meaning of your prediction.
Use other metrics for biased cases
In the biased cases, the Log Loss has the same problem than the Accuracy and other loss functions : it provides only a global measurement of your performance and it be harder to interpret than the Accuracy. So you would better use the usual metrics, to take into account minority classes : Recall, Precision, Specificity or better, F-score.
References
- Discussion on Stack Exchange: stats.stackexchange.com/questions/276067/whats-considered-a-good-log-loss/395774
- Visual explanation of Log Loss and entropy : https://towardsdatascience.com/understanding-binary-cross-entropy-log-loss-a-visual-explanation-a3ac6025181a

