An Entity Relationship Diagram or ER Diagram is a flowchart that illustrates how ?entities? relate to each other within a system.
An entity is a thing capable of an independent existence that can be uniquely identified. For example some aspects of the real world that can be distinguished from other aspects of the real world.
ER Diagrams are often used to design or debug relational databases in software engineering, business information systems, education and research.
A basic ER model is composed of entity types (which classify the things of interest) and specifies relationships that can exist between entities (instances of those entity types). ERDs or ER Models, they use a defined set of symbols such as rectangles, diamonds, ovals and connecting lines to depict the interconnectedness of entities, relationships and their attributes. They mirror grammatical structure, with entities as nouns and relationships as verbs.
Uses of entity relationship diagrams
- Database design: For example in software engineering, an ERD is often an initial step in determining requirements for an information systems project. It?s also later used to model a particular database or databases.
- Database troubleshooting: ERDs are used to analyze existing databases to find and resolve problems in logic or deployment, drawing the diagram should reveal where it?s going wrong.
- Business information systems: ERDs are used to design or analyze relational databases used in business processes. It can streamline processes, uncover information more easily and improve results.
- Business process re-engineering (BPR): ERDs help in analyzing databases used in business process re-engineering and in modeling a new database setup.
- Education: ERDs can be valuable in planning databases which store relational information for educational purposes and later retrieval.
- Research: ERD diagrams can play a key role in setting up useful databases to analyze the data.
Components of the ER Diagram
This model is based on three basic concepts:
- Entities
- Attributes
- Relationships
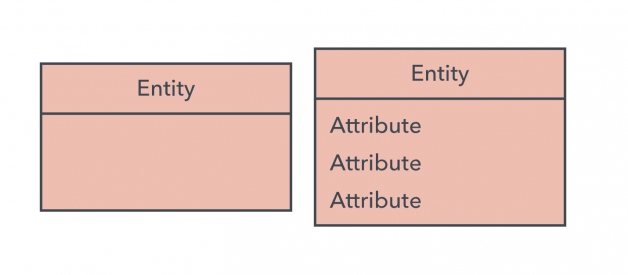
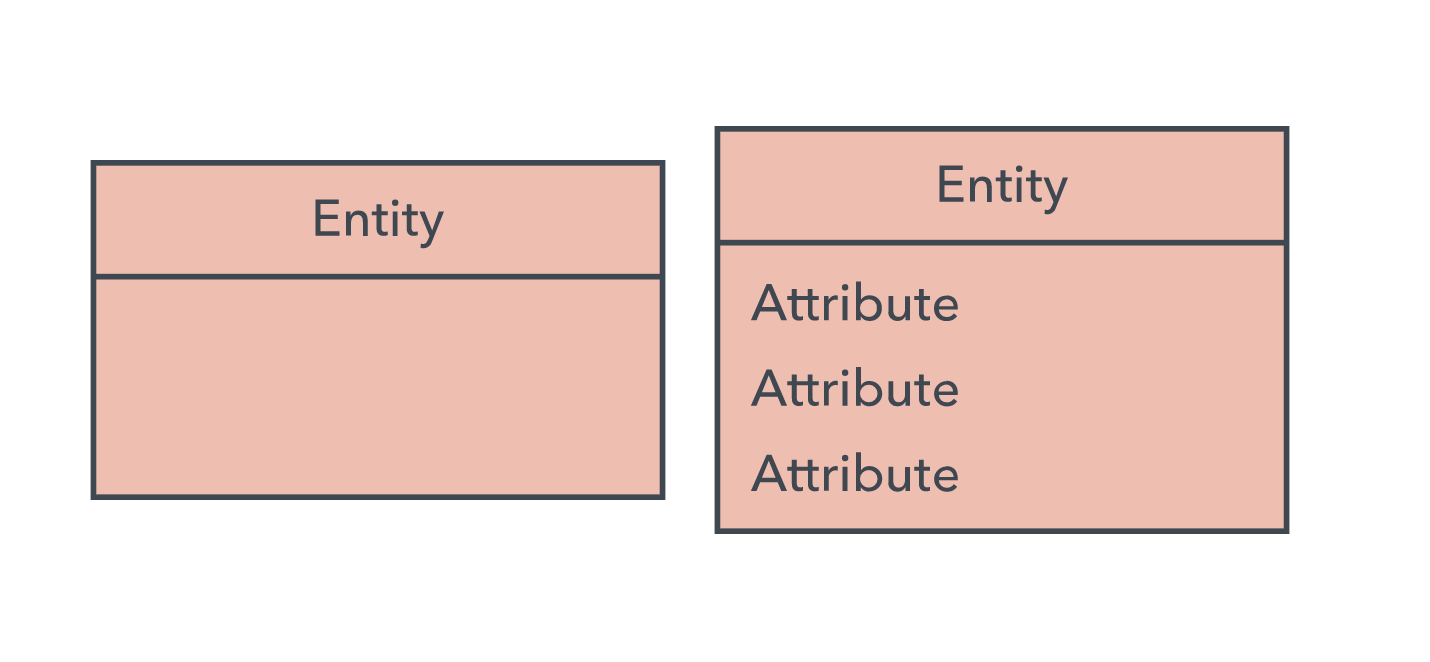
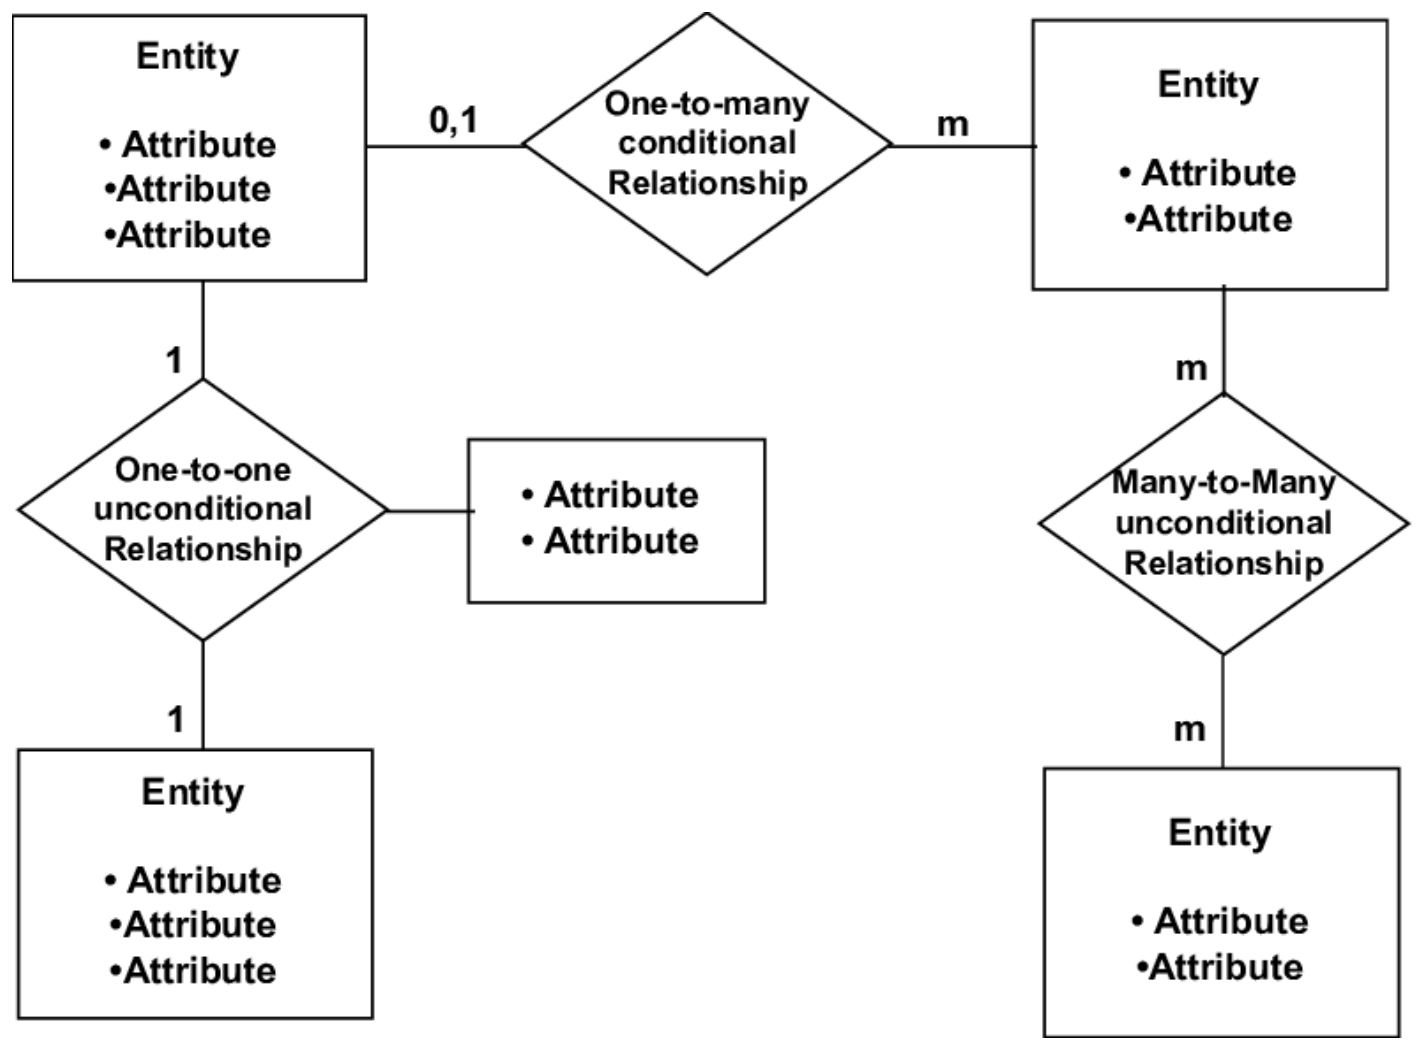
Entity
A thing ? such as a house, object, concept or event? that can have data stored about it.
- Examples: a customer, student, car or product.
- Typically shown as a rectangle.
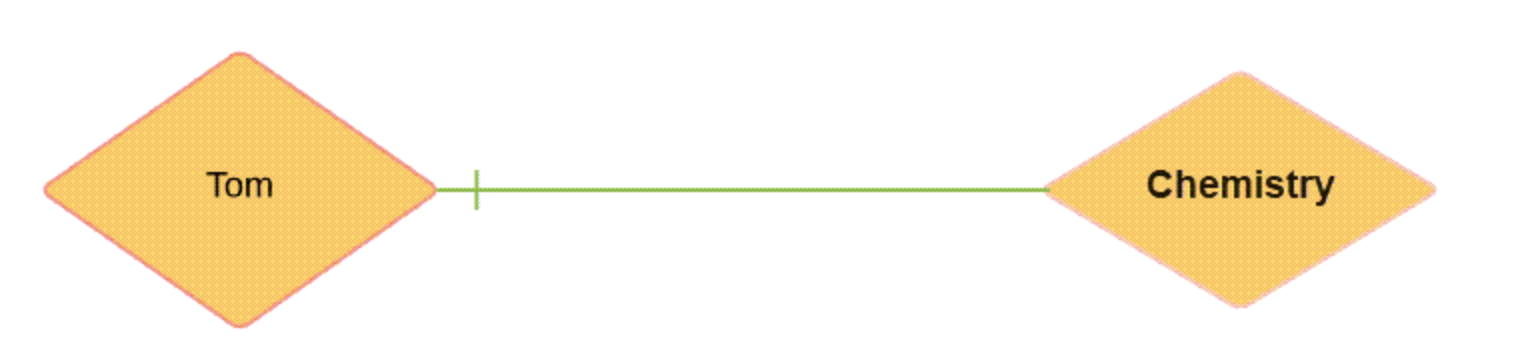
Relationship
How entities act upon each other or are associated with each other.
- For example, the named student might register for a course. The two entities would be the student and the course, and the relationship depicted is the act of enrolling, connecting the two entities in that way.
- Typically shown as diamonds or labels directly on the connecting lines.
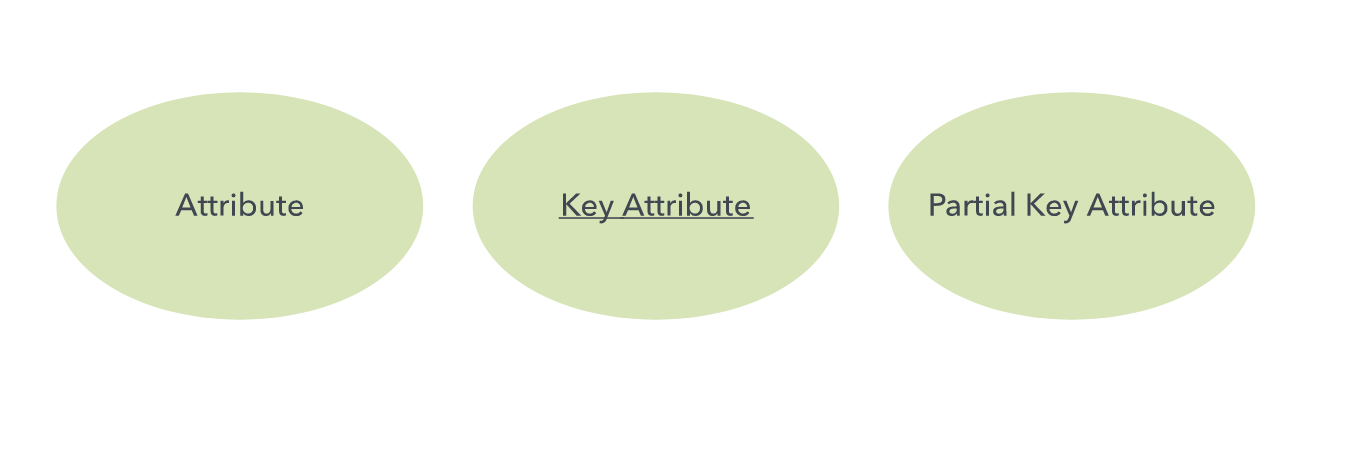
Attribute
A property or characteristic of an entity.
- Often shown as an oval or circle.
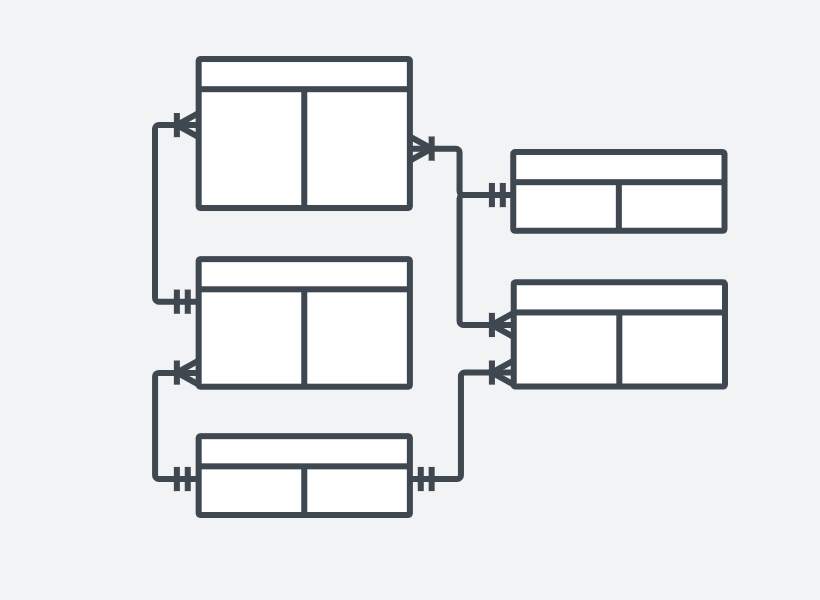
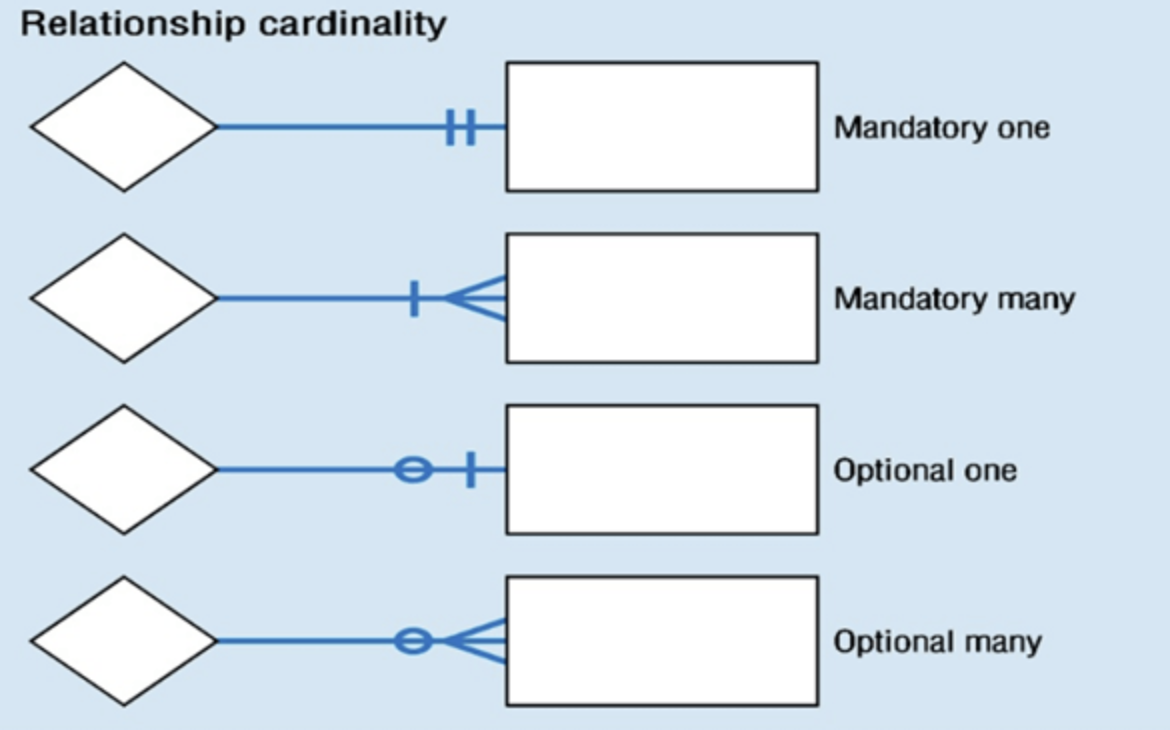
Cardinality
Defines the numerical attributes of the relationship between two entities or entity sets.
Different types of cardinal relationships are:
- One-to-One Relationships
- One-to-Many Relationships
- May to One Relationships
- Many-to-Many Relationships
Elements of an Entity-Relationship Diagram (ERD)
Conclusion: ER modeling helps you to analyze data requirements systematically to produce a well-designed database. It?s considered best practice to complete ER modeling before implementing your database.

?)
?)