![Using matplotlib in jupyter notebooks — comparing methods and some tips [Python]](https://911weknow.com/wp-content/uploads/2020/09/using-matplotlib-in-jupyter-notebooks-comparing-methods-and-some-tips-python-1-628x275.png)
This is just a quick post because I didn?t find one place that collects all the options and compares those as well as shares some practical tips and thought I?d contribute back to the community and share what I learned as I set to find what can be done. If you want to add plots to your Jupyter notebook and are wondering on interactive vs non-interactive and other tricks this is a good place to start.
 just a random plot
Before you start, please note that these actions need to be taken before importing the matplotlib library. Although in theory you can change backend while working that is risky.
Different methods of using matplotlib in notebooks:
- Option 1: Use %matplotlib notebook to get zoom-able & resize-able notebook. This is the best for quick tests where you need to work interactively.
BUG: only one zoomable notebook can be active. If you don?t deactivate (end interaction to) it, you can?t draw another and get weird bugs in the following cells. This is really bad if you have loops that generate plots in your code?
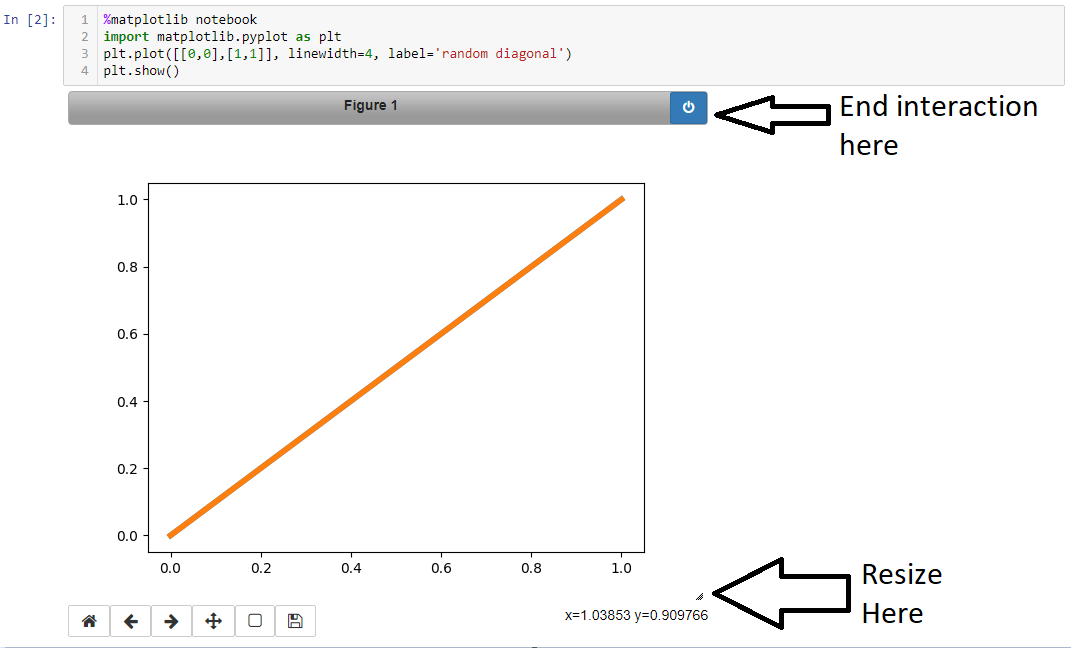 Example of %matplotlib notebook
- Option 2: Use %matplotlib ipympl – supposedly like %matplotlib notebook but kept more up to date, in my experience that is more or less the same and I am actually missing the ability to resize at the plot. The github for ipympl was last updated 5 month ago at the time of writing so although the official matplotlib documentation suggests the jupyter ecosystem is moving too fast and it is better to this this I recommend not to use ipympl
- Option 3: Use %matplotlibe inline – this only draws the images, not interactive / zoom-able but it works well. I recommend to change figure size to be bigger than the default in most cases (see notes below on how).
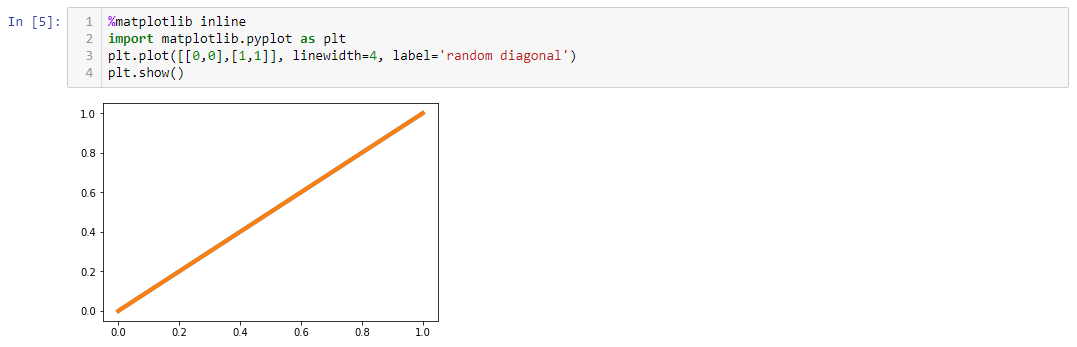 Example of %matplotlib inline with default figure size
- Option 4: Use import mpld3 and mpld3.enable_notebook() – this creates zoom-able (interactive) plots and supports more than one plot at the same time. You should set figure size manually (see below on how to do it) as figure sizes are not adjustable. Note that the interactive tools are hidden until you pass the mouse over the plot.Also, from my experience, You must state mpld3.enable_notebook() in every cell you plot something, otherwise it reverts to something that looks like %matplotlib inline mode.
BUG: mpld3 doesn?t support vertical lines (axvline) and draws those in the wrong place, IDK if there are other unsupported features
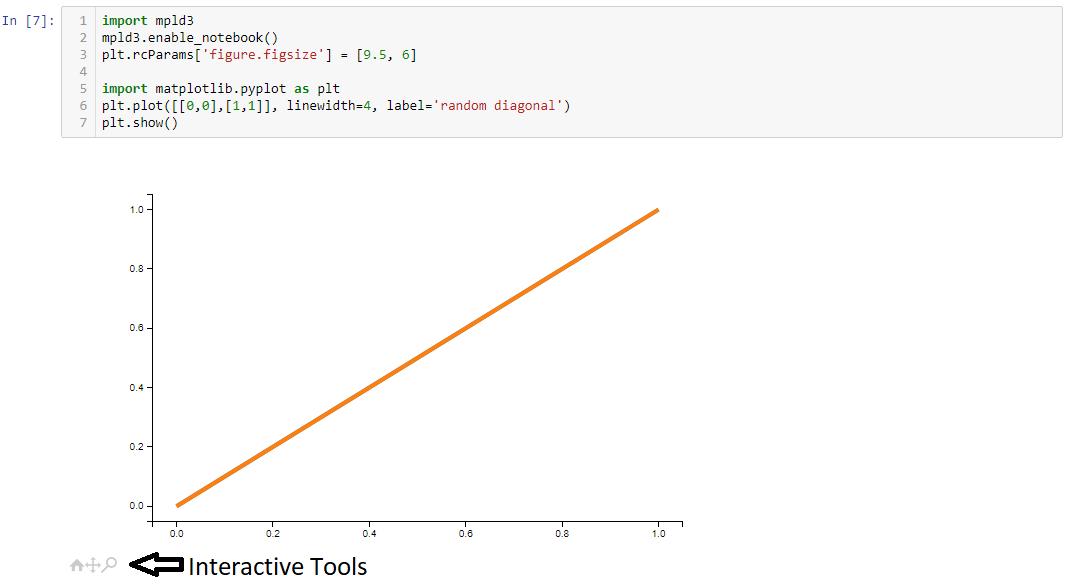 Example of using mpld3
Notes on sizes:
- notebook and ipympl create resize-able plots (suposedly, I actually am missing resizing in ipympl).
- When using %matplotlib inline or mpld3 you should adjust figure size using plt.rcParams[‘figure.figsize’] = [9.5, 6] The params are in the order width then height?
How to get more space for your plots in the Jupyter notebook:
Jupyter has a nice feature that automatically converts long outputs into a box with a scrollbar. Unfortunately many times you don?t actually want it, especially when you want to compare several plots. One way to disable the feature is to put the following in a separate cell and run it before you run the cell that generates long output

References:
- Matplotlib documentation on backends
- GitHub of ipympl (to be accurate the jupyter-matplotlib extension)
- Stack Exchange discussion on changing backends live ? note this was experimental in 2017 and I haven?t checked status on it
- Stack Exchange discussion on using %matplotlib notebook after %matplotlib inline
