First, what sort of research questions can Google data answer?
By Galen Stocking and Katerina Eva Matsa
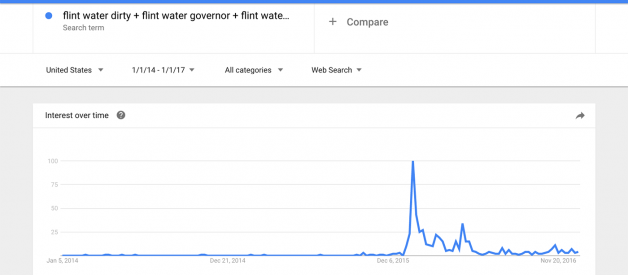
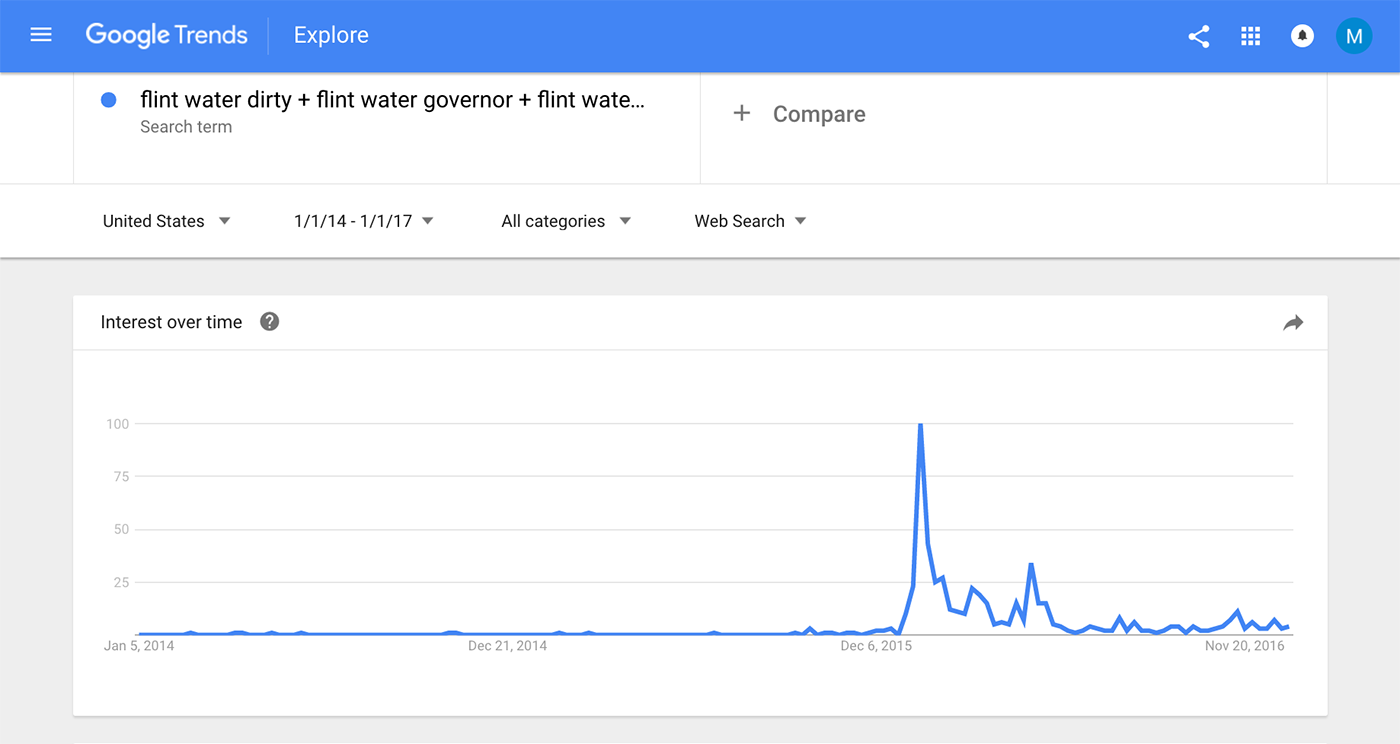
Researchers have used Google Trends data to investigate a number of questions, from exploring the course of influenza outbreaks to forecasting economic indicators. In Pew Research Center?s case, we looked at American Google users? search behavior around the water crisis in Flint, Michigan, with the goal of understanding what aggregated search behavior can tell us about how public interest shifts as a story unfolds. The geographic focus of the crisis, its unique keywords and its potential to relate to Americans? daily lives made it a prime candidate for study. In the nine months we spent digging into the data, we learned a great deal about the promise ? and potential pitfalls ? of using Google search data to answer questions about public attitudes and behaviors. Here are six questions researchers, journalists and others should ask themselves if they are considering using Google Trends data in their own work.
1 What sort of research questions can Google data answer?
Google search data aggregates billions of instances each day in which someone types a query into a search box. It?s important to keep in mind that each of these searches was conducted for its own reason (exploring a topic, clarifying a term, seeking evidence to bolster an argument), and not to answer a researcher?s questions. Still, the aggregated data can be useful in shedding light on certain research questions. In particular, the kinds of searches that users perform can be a good proxy for the public?s interests, concerns or intentions, but these searches do not necessarily represent users? opinions. For instance, high numbers of searches for ?immigration border wall cost? indicate that there is a high level of interest in that topic, but we cannot know if that interest reflects support, opposition or simple curiosity. Additionally, people perform searches when they want to find more information, suggesting that search results may favor events or issues that are newly in the public eye. For example, in our study about the Flint water crisis, we found that the majority of the cases of heightened search activity coincided with major events in the story and increased attention from news media or political figures.
2 Which Google tool is best for answering my question?
There are several different tools to explore Google search data: the public Google Trends website, the Google Trends API and the Google Health API. All of these allow researchers to perform the same basic functions, such as offering results based on geographic locations and distinct time periods, but they do have some major differences. The Trends API is available for journalists and academic researchers, while the Health API is only available to academic researchers. Both APIs require an application before gaining access, which is restricted to specific use cases. Researchers should weigh the benefits and limitations of each resource in light of their particular project. They should also consider adjusting the project to make best use of the tools available to them, using the public website, applying for access to the private Trends API, or considering another approach altogether.
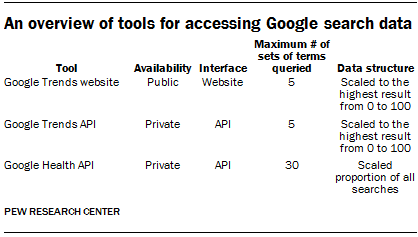
There are two other data-related differences between the Google Trends API and website and the Google Health API. For one, the Trends tools scale results from 0 to 100 based on the most popular term entered, while the Google Health API returns a scaled proportion based on all searches performed in a specified region and time period. Additionally, the Google Trends website and API allow users to compare five distinct sets of search terms simultaneously, while the Google Health API allows users to compare up to 30 distinct sets ? and, because the values are not scaled to the highest result, you can combine the results of multiple Health API queries if you have more than 30 terms. This presents challenges if researchers are trying to compare a broad set of terms against each other. For example, it?s challenging in the Google Trends interface to simultaneously query the names of all the United States presidents after World War II because there are indeed more than five; this is more practical in the Google Health API. One possible solution to comparing more than five terms in the Google Trends interface would be to create a set of queries that all share one single overlapping term (or set of terms) and then compare all the results in relation to that overlapping term.
Often, researchers aren?t interested in comparing more than five terms because they are not conceptually distinct. Each of these tools allows the researcher to make that comparison. Instead of querying results for each term individually, a researcher can combine multiple terms into one conceptually similar set using Boolean logic (e.g., combine three separate terms like ?flint water dirty,? ?flint water governor? and ?flint water obama? into one term: ?flint water dirty OR flint water governor OR flint water obama?). This is most useful when those individual terms are more niche or results are more sparse for some time periods ? combining them adds the results of each term ? and the availability of this method in each of these tools can help any researcher dive deeper into low-frequency topics.
3 What search terms can answer my question?
As you can imagine, identifying all the possible ways the public might search for information on a topic can be very difficult. For instance, when searching for information about inheritance taxes, some Google users may use the term ?death tax? while others could use the term ?estate tax? ? and still others may use a term researchers might never even imagine. Luckily, some of Google?s own tools can be extremely helpful in solving this problem, allowing you to identify the most salient search terms around a topic. We developed a process that can help you identify search terms that are a solid representation of the possible ways users may search around a topic. Here are the key steps:
Brainstorming
As with more or less every research project, brainstorming is a good place to start. You can generate a list of keywords that might be searched for in relation to the topic, but you can also organize the brainstorming session by discussing distinct topic areas around the main research question so that all aspects of the subject are covered. Part of this process may include calling upon an expert in the topic area, which can help you develop some of the ?inside baseball? knowledge needed, especially when dealing with a niche or technical topic.
News and social media coverage
Another step that we found helpful was to review news articles and social media conversations about the topic in question. Both can offer insights into how this topic is discussed, particularly the kinds of terminology used by experts, journalists and members of the public.
Tools
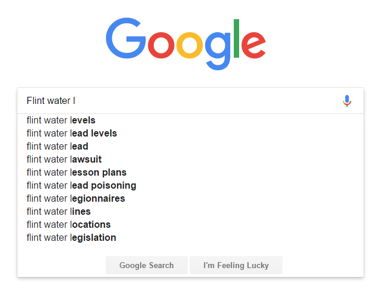
Google also provides tools that can help you expand the term list. Autocomplete can take the stem of terms already generated and identify distinct searches ? ranging from ?Flint water? to ?Flint water legionnaires.? The Related and Rising terms within Google Trends itself, as well as Google Correlate, both suggest related search terms based on search data, which can complement the terms already generated through brainstorming and a review of media coverage.
Conjugation
Google only returns exact matches for search terms (unless you search by topic), so conjugating verbs, nouns, adjectives and adverbs catches a wider net of terms that people might search by. For example, one of the terms on our early list was ?water lead test.? As we developed the list, we added ?water lead tested,? ?water lead testing? and ?water lead tests,? knowing that each of these could return different results that we could then group together to represent one query.
4 How do I understand the output?
The data returned from all three tools represents a proportion, not a sum total: Of all searches made (in that region, for that time period), X% were for what you queried. How the proportion is presented differs depending on the tool used.
In Google Trends the results are returned on a scale from 0 to 100, with 100 representing the highest proportion for the terms queried within the selected region and time frame and zero the lowest. For example, in a search for the term ?Flint water governor? across the U.S. week by week for the first half of 2016, Trends will assign the highest value (100) to the date with the highest volume (the week of Jan. 17 in the dummy data below). All other dates will then be represented as a fraction of that maximum. This process also applies to queries that contain multiple search terms. So, as seen in this same example, if both ?Flint water governor? and ?Flint water Obama? were in a query, 100 would be assigned to the highest week for either and then all results across both terms would be proportional to that point. Consequently, in interpreting results, it?s important to remember that we can make evaluations about the rate of change and comparisons among terms but we can?t assess the total number of searches for any term or group of terms.
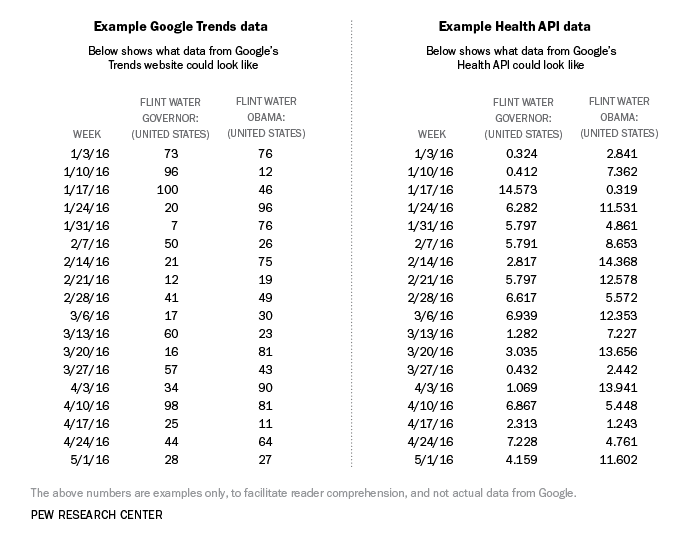
Results from the Health API data, on the other hand, are a scaled proportion of all searches for all terms. As you see on the right side of the table of dummy data above, the Health API results would not be on the same 0-to-100 scaled values as the Trends results. In this example, the Health API results indicate the proportion of searches about the term ?Flint water governor? and ?Flint water Obama? out of all searches that have taken place in the U.S. per week for this time range, all multiplied by a consistent factor to increase ease of use. This format not only can facilitate more in-depth analysis, or more precise comparison over longer time ranges, but also allows the researcher to input the terms in question without using one term as a constant. Therefore, comparisons among terms, geographies and time ranges are conducted more easily, though these advantages aren?t always necessary.
5 What do zero values mean?
The Google Health API does not give you a result if there are not enough searches above the privacy threshold matching your parameters. Instead, it provides a zero value, which ensures that an individual person?s searches can?t be uncovered. However, these zeros can cause problems for data analysis, since zero is likely not the true value for that point, and including it in any average will skew the estimate downward. One way to get around this is by changing the parameters of your search, such as by broadening your search terms, broadening the region (instead of state, use country), or adding more time (instead of days, use weeks or months). For our project using the Google Health API, zeros were most common when the geographic area was at the city level rather than state or national and when the category had the most technical and specific terms, such as ?lead testing e. coli.?
It is important to be aware that Google search data results are not based on the full population of search requests, but on a sample. While this may introduce only a small degree of error for common search terms, searches with a low overall volume can produce more variable results because of this sampling. We addressed this issue for our project (which included a number of rarely used search terms) by taking 50 samples of each query ? a technique made possible only because of we had access to the Health API. For those samples in which there were zero values, we chose to impute these values based on the mean of the 50 samples for that data point. This method eliminated zeros that from our testing that were proven to be a result of samples below the privacy threshold. However, in the case of the Google Trends website and API, the zero values have a totally different meaning, as explained earlier, and one should not attempt to impute these values.
6 How do I tell when changes over time are meaningful?
In general, there is a good deal of noise inherent in any behavioral and time-series data, including analyses of how the public?s searches for a particular topic increased or decreased over time. For example, a 3% difference from one week to another does not necessarily mean that there were meaningfully different levels of search activity in those two weeks. A number of techniques can help determine which changes are meaningful. Some of these techniques are: using standard deviation that is higher or lower than the overall mean to identify which time periods have a level of search meaningfully higher or lower than the time period prior; applying time series methods that can analyze autocorrelation; and applying what are known as changepoint models.
For our study on the Flint water crisis, we applied a three-step process. First, to eliminate noise, we used a smoothing technique called a generalized additive model (GAM). Second, we identified distinct ranges of time using a changepoint model with an R package (details on how we used this specific method are available here). Third, because we were interested in when search activity reached its highest points, we compared the peak of each period to the peak of the period before it, and if that peak was 30% higher than the previous one, it was tagged as a meaningful change.
Overall, what we learned from the project is much like what we learned from any research project using a new (to us) data source: It?s important to design the project with the strengths and limitations of the data source in mind. But if you do so carefully and creatively, and combine these new types of data with other kinds such as media coverage or even demographic data, you can get some great results out of it.
Galen Stocking is a research associate at Pew Research Center. He studies the nexus between the news media, technology, politics, and public opinion, mostly using advanced statistical methods and large datasets. He also holds a PhD in political science from the University of California, Santa Barbara.
Katerina Eva Matsa is a senior researcher at Pew Research Center. She is an expert on journalism and media, specifically the U.S. broadcasting sector, news consumption and politics and the role of technology in news.

