What is P-Value?
P-Value is a statistical test that determines the probability of extreme results of the statistical hypothesis test,taking the Null Hypothesis to be correct.
It is mostly used as an alternative to rejection points that provides the smallest level of significance at which the Null-Hypothesis would be rejected.
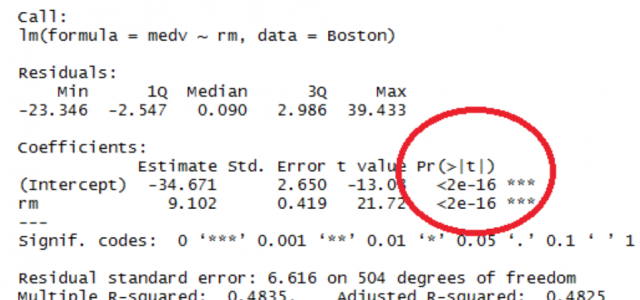
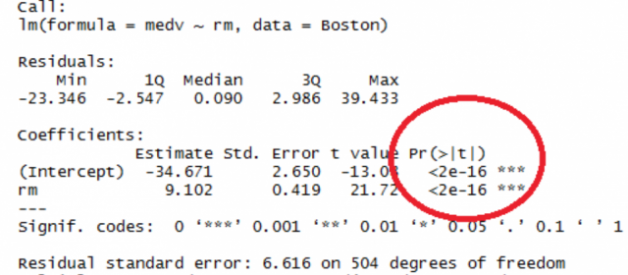
In R,when you apply the summary() function on the model stars or astrix appears beside the P-Value.The higher the number of stars Beside the P-Value the more significant the variable is.As shown in the image Below.

How to interpret P-Values for Linear Models?
The P-Value as you know provides probability of the hypothesis test,So in a regression model the P-Value for each independent variable tests the Null Hypothesis that there is ?No Correlation? between the independent and the dependent variable,this also helps to determine the relationship observed in the sample also exists in the larger data.
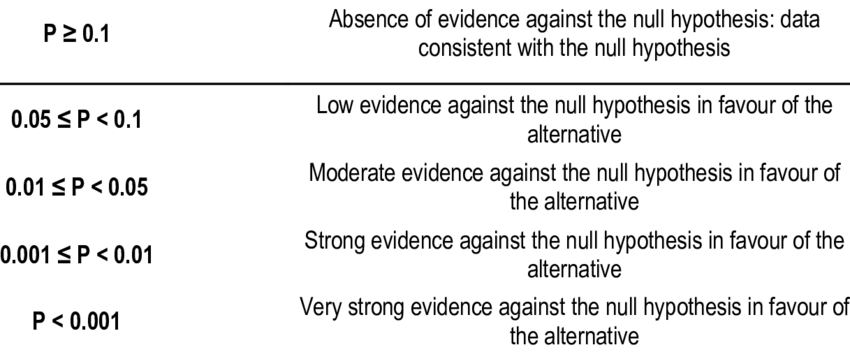
So if the P-Value is less than the significance level (usually 0.05) then your model fits the data well.
The significance level is the probability of rejecting the null hypothesis when it is true.

But why Should the P-Value be less than 0.05?
A significance level of 0.05 indicates a 5% risk of concluding that a difference exists between the variables when there is no actual difference.In other words, If the P-Value for a variable is less than your significance level,then the sample data provide enough evidence to reject the null hypothesis for the entire population. Alternatively, a P-Value that is greater than 0.05 indicates a weak evidence and fail to reject the null hypothesis.
For Maths behind P-Value,check the link( https://www.wallstreetmojo.com/p-value-formula/)
Like my article? Do give me a clap and share it,as that will boost my confidence.Also,I post new articles every sunday so stay connected for future articles of the basics of data science and machine learning series.
Also,if you want then connect with me on linkedIn.
 Photo by Alex on Unsplash


