Understanding Java Memory Model is an essential learning for serious Java developers who develop, deploy, monitor, test, and tune performance of a Java application. In this blog post, we are going to discuss on Java memory model and how each part of JVM memory contributes to run our programs.
First of all, check whether you understand the following diagram of JVM architecture. If you are not familiar with it, I highly suggest you to skim through my previous post (?Java Ecosystem (Part 1): Understanding JVM Architecture?) and refresh your knowledge.
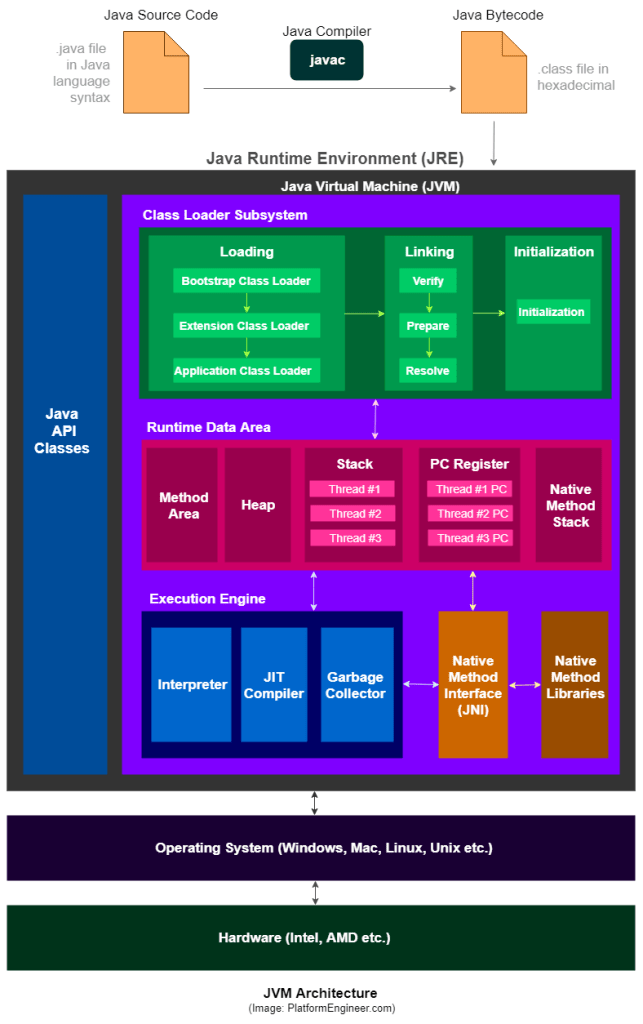 JVM Architecture
JVM Memory Model
You must have used some of the following JVM memory configurations when running resource-intensive Java programs.
- -XmsSetting ? initial Heap size
- -XmxSetting ? maximum Heap size
- -XX:NewSizeSetting ? new generation heap size
- -XX:MaxNewSizeSetting ? maximum New generation heap size
- -XX:MaxPermGenSetting ? maximum size of Permanent generation
- -XX:SurvivorRatioSetting ? new heap size ratios (e.g. if Young Gen size is 10m and memory switch is ?XX:SurvivorRatio=2, then 5m will be reserved for Eden space and 2.5m each for both Survivor spaces, default value = 8)
- -XX:NewRatio ? providing ratio of Old/New Gen sizes (default value = 2)
But have you ever wondered how your JVM resides on memory? Let me show it. Just like any other software, JVM consumes the available space on host OS memory.
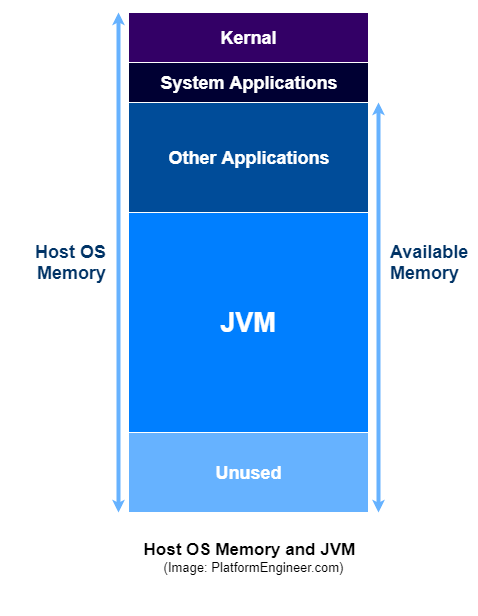 Host OS Memory and JVM
However, inside JVM, there exist separate memory spaces (Heap, Non-Heap, Cache) in order to store runtime data and compiled code.
1) Heap Memory
- Heap is divided into 2 parts ? Young Generation and Old Generation
- Heap is allocated when JVM starts up (Initial size: -Xms)
- Heap size increases/decreases while the application is running
- Maximum size: -Xmx
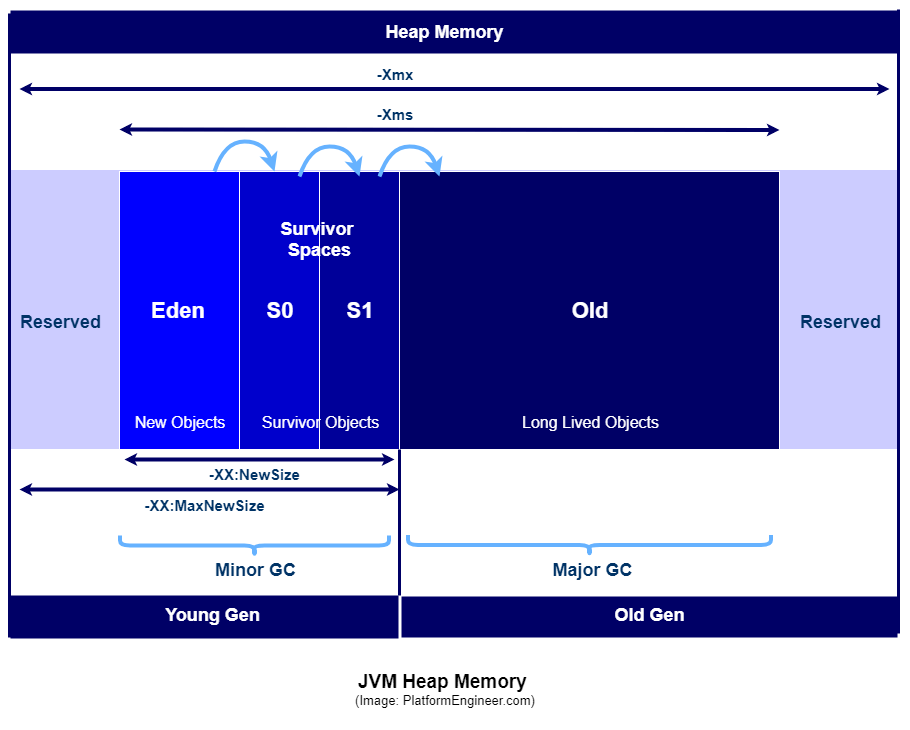 JVM Heap Memory
1.1) Young Generation
- This is reserved for containing newly-allocated objects
- Young Gen includes three parts ? Eden Memory and two Survivor Memory spaces (S0, S1)
- Most of the newly-created objects goes Eden space.
- When Eden space is filled with objects, Minor GC (a.k.a. Young Collection) is performed and all the survivor objects are moved to one of the survivor spaces.
- Minor GC also checks the survivor objects and move them to the other survivor space. So at a time, one of the survivor space is always empty.
- Objects that are survived after many cycles of GC, are moved to the Old generation memory space. Usually it?s done by setting a threshold for the age of the young generation objects before they become eligible to promote to Old generation.
1.2) Old Generation
- This is reserved for containing long lived objects that could survive after many rounds of Minor GC
- When Old Gen space is full, Major GC (a.k.a. Old Collection) is performed (usually takes longer time)
2) Non-Heap Memory
- This includes Permanent Generation (Replaced by Metaspace since Java 8)
- Perm Gen stores per-class structures such as runtime constant pool, field and method data, and the code for methods and constructors, as well as interned Strings
- Its size can be changed using -XX:PermSize and -XX:MaxPermSize
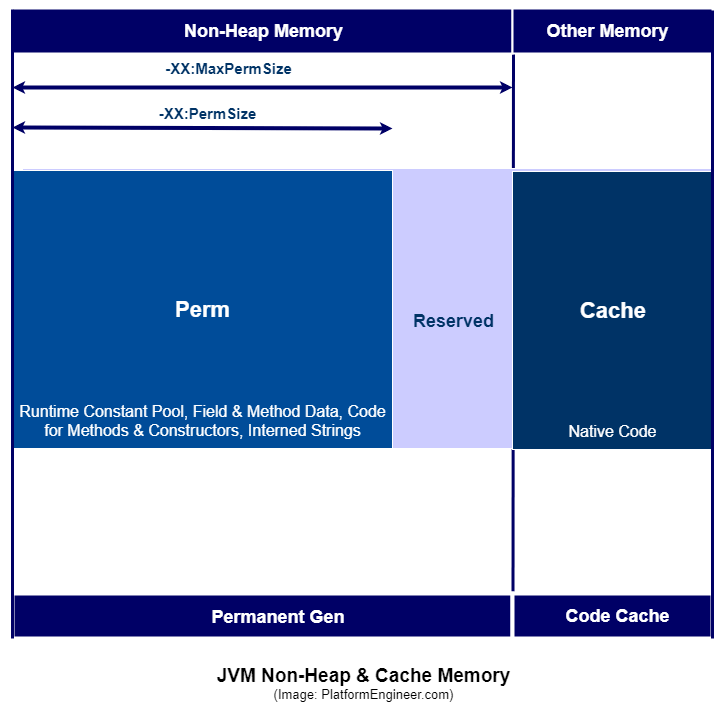 JVM Non-Heap & Cache Memory
3) Cache Memory
- This includes Code Cache
- Stores compiled code (i.e. native code) generated by JIT compiler, JVM internal structures, loaded profiler agent code and data, etc.
- When Code Cache exceeds a threshold, it gets flushed (and objects are not relocated by the GC).
Stack vs. Heap
So far I did not mention anything about Java Stack memory because I wanted to highlight its difference separately. First, take a look at the below image and check whether you know what?s happening here. I have already discussed on JVM Stack in my previous post.
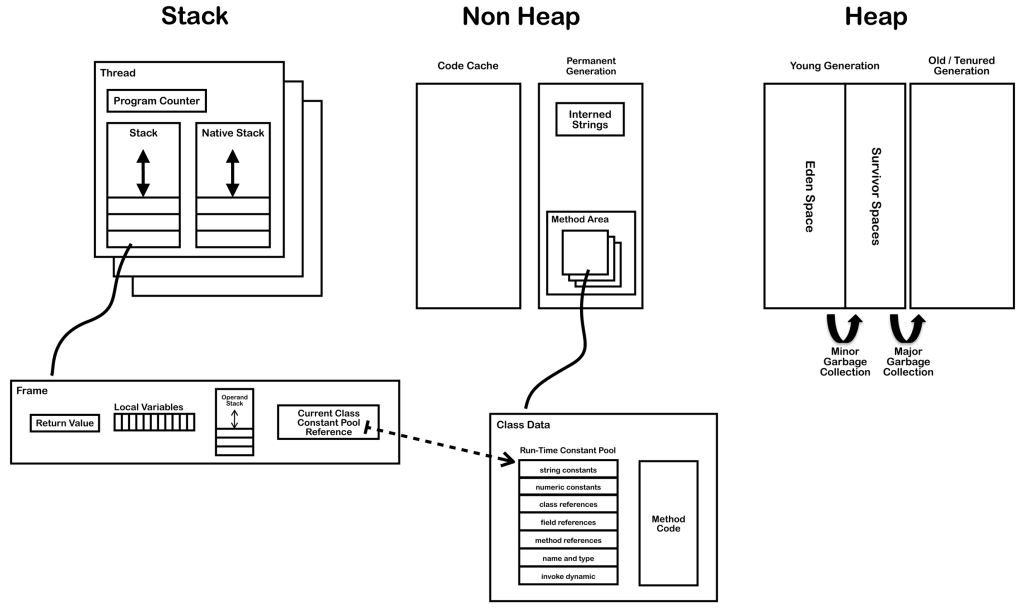 JVM Stack, Non-Heap, and Heap (Image: jamesdbloom.com)
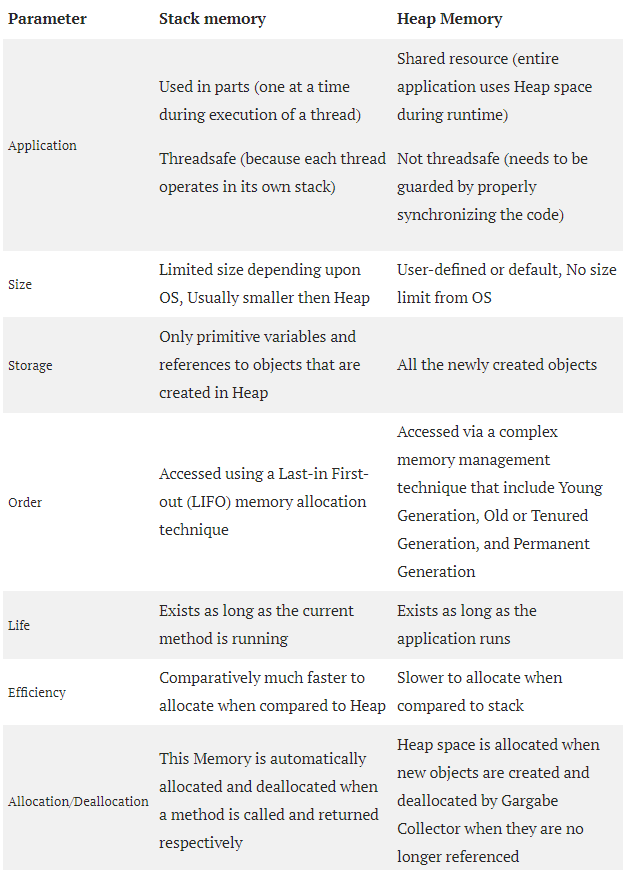
Anyway long story short, Java Stack memory is used for execution of a thread and it contains method specific values and references to other objects in Heap. Let?s put both Stack and Heap into a table and see their differences.
Here?s a nice example (from baeldung.com) on how Stack and Heap contribute to execute a simple program (Check the stack order with the code).
class Person { int pid; String name;// constructor, setters/getters}public class Driver { public static void main(String args) { int id = 23; String pName = “Jon”; Person p = null; p = new Person(id, pName); }}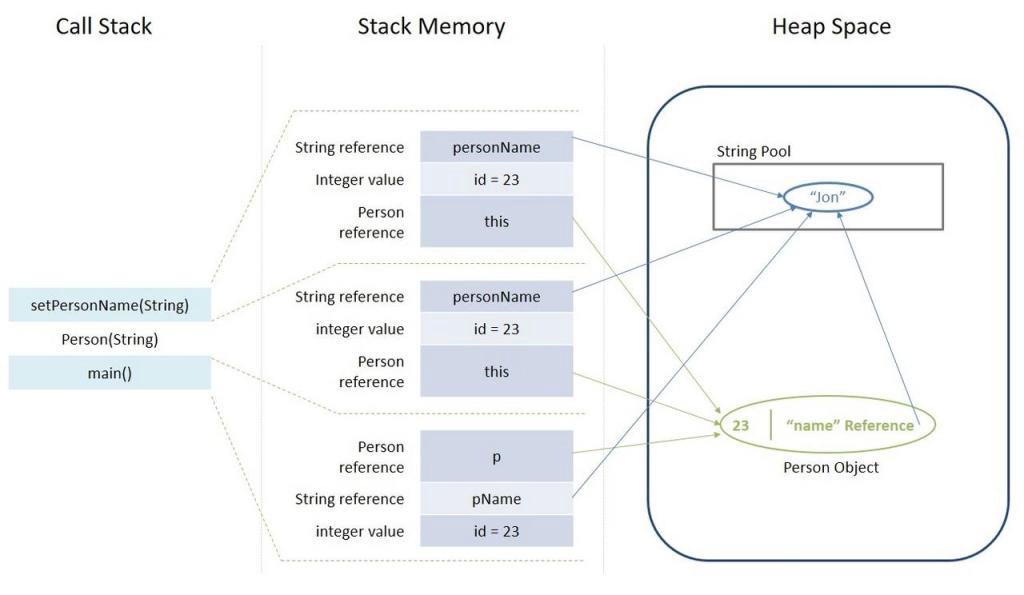 Stack Memory & Heap Space in Java (Image: baeldung.com)
Modifications
The above Java memory model is the most commonly-discussed implementation. However, the latest JVM versions have different modifications such as introducing the following new memory spaces.
- Keep Area ? a new memory space in the Young Generation to contain the most recently allocated objects. No GC is performed until the next Young Generation. This area prevents objects from being promoted just because they were allocated right before a young collection is started.
- Metaspace ? Since Java 8, Permanent Generation is replaced by Metaspace. It can auto increase its size (up to what the underlying OS provides) even though Perm Gen always has a fixed maximum size. As long as the classloader is alive, the metadata remains alive in the Metaspace and can?t be freed.
NOTE: You are always advised to go through the vendor docs to find out what works for your JVM version.
Memory Related Issues
When there is a critical memory issue, the JVM gets crashed and throws an error indication in your program output like below.
- java.lang.StackOverFlowError ? indicates that Stack Memory is full
- java.lang.OutOfMemoryError: Java heap space ? indicates that Heap Memory is full
- java.lang.OutOfMemoryError: GC Overhead limit exceeded ? indicates that GC has reached its overhead limit
- java.lang.OutOfMemoryError: Permgen space ? indicates that Permanent Generation space is full
- java.lang.OutOfMemoryError: Metaspace ? indicates that Metaspace is full (since Java 8)
- java.lang.OutOfMemoryError: Unable to create new native thread ? indicates that JVM native code can no longer create a new native thread from the underlying operating system because so many threads have been already created and they consume all the available memory for the JVM
- java.lang.OutOfMemoryError: request size bytes for reason ? indicates that swap memory space is fully consumed by application
- java.lang.OutOfMemoryError: Requested array size exceeds VM limit? indicates that our application uses an array size more than the allowed size for the underlying platform
However, what you have to thoroughly understand is that these outputs can only indicate the impact that the JVM had, not the actual error. The actual error and its root cause conditions can occur somewhere in your code (e.g. memory leak, GC issue, synchronization problem), resource allocation, or maybe even hardware setting. Therefore, I can?t advise you to simply increase the affected resource size to solve the problem. Maybe you will need to monitor resource usage, profile each category, go through heap dumps, check and debug/optimize your code etc. And if none of your efforts seems to work and/or your context knowledge indicates that you need more resources, go for it.
What?s Next
During my undergraduate research on JVM performance aspects, we found several approaches used by the industry to minimize the impact of performance faults like memory errors. Let?s discuss about Java Performance Management in-depth very soon. In the meantime, read the next blog post of this series in which I explain how Java Garbage Collection really works under the hood. Stay excited with this blog for more exciting posts!
References
- JVM Internals ? http://blog.jamesdbloom.com/JVMInternals.html
- Stack Memory and Heap Space in Java ? https://www.baeldung.com/java-stack-heap
- Java (JVM) Memory Model ? Memory Management in Java ? https://www.journaldev.com/2856/java-jvm-memory-model-memory-management-in-java
- Java Memory Management for Java Virtual Machine (JVM) ? https://betsol.com/2017/06/java-memory-management-for-java-virtual-machine-jvm/
