Every time I work on a project with visualisations, project managers usually react in horror when I say I?m not using D3. Why is there concern? Why would I choose to not use D3?
When answering these questions, we have to understand the context in which D3 was created. D3 was first released in 2011, and it was quite innovative at the time.
Normally what you would see, is libraries which provide graphs out of the box and with a massive list of options. This can work, but the problem is that each time someone has a new requirement, an option would have to be added and supported. Eventually you end up with what?s effectively a language where you use several objects to define a graph. D3 took a different approach, instead of giving you the full components, it gives you data-driven helper functions to create those components yourself.
At this time, libraries like jQuery and Backbone were popular. Creating your own graphs using these libraries would have been challenging, especially if you want them to be dynamic. Browsers were only just adopting new modern CSS standards like transitions, and more modern properties like flex box were still ages away from being implemented.
D3 solved a lot of these problems, and it was no doubt the easiest approach to implementing visualisations at the time. However, a lot has changed since then. We have new modern frameworks that use more flexible and expressive concepts such as virtual DOM, and CSS has so many new capabilities for layout and animations.
Rather than automatically jumping to D3, let me list a few reasons as to why you should reconsider your use of it.
I?ve worked with D3 numerous times over the past several years, and implemented all sort of visualisations with it. I understand the general concepts about D3, and I still struggle to work with it. Everyone I worked with, from juniors to senior developers, also struggle with it. What many people, including myself do, is that we find an example online that roughly matches what we?re looking for, and modify the example to suit our needs.
If we want to add some custom functionality, we?ll probably do some more searching, and find something that sort of looks correct, attempt to understand how it works, and keep modifying it until it does what we want it to do.
Does this sound familiar? On the other hand, developers these days are very familiar with virtual DOM libraries and they?re familiar with templating. Doesn?t it make more sense to leverage those skills, rather than introducing a library which requires an entirely different way of thinking?
It?s easier than you think
When you first think about creating your own charts from scratch, it?s common to feel worried and terrified. It might sound like a very complicated component to create, but it really isn?t when you break it down. Let?s take an example of a line chart. Here?s how you would do a line chart in D3:
// set the dimensions and margins of the graphvar margin = {top: 20, right: 20, bottom: 30, left: 50}, width = 960 – margin.left – margin.right, height = 500 – margin.top – margin.bottom;// parse the date / timevar parseTime = d3.timeParse(“%d-%b-%y”);// set the rangesvar x = d3.scaleTime().range([0, width]);var y = d3.scaleLinear().range([height, 0]);// define the linevar valueline = d3.line() .x(function(d) { return x(d.date); }) .y(function(d) { return y(d.close); });// append the svg object to the body of the page// appends a ‘group’ element to ‘svg’// moves the ‘group’ element to the top left marginvar svg = d3.select(“body”).append(“svg”) .attr(“width”, width + margin.left + margin.right) .attr(“height”, height + margin.top + margin.bottom) .append(“g”) .attr(“transform”, “translate(” + margin.left + “,” + margin.top + “)”);// Get the datad3.csv(“data.csv”, function(error, data) { if (error) throw error;// format the data data.forEach(function(d) { d.date = parseTime(d.date); d.close = +d.close; });// Scale the range of the data x.domain(d3.extent(data, function(d) { return d.date; })); y.domain([0, d3.max(data, function(d) { return d.close; })]);// Add the valueline path. svg.append(“path”) .data([data]) .attr(“class”, “line”) .attr(“d”, valueline);// Add the X Axis svg.append(“g”) .attr(“transform”, “translate(0,” + height + “)”) .call(d3.axisBottom(x));// Add the Y Axis svg.append(“g”) .call(d3.axisLeft(y));});
Source: bl.ocks.org
Here?s how I would do something like this using Preact:
/* @jsx h */let { Component, h, render } = preactfunction getTicks (count, max) { return […Array(count).keys()].map(d => { return max / (count – 1) * parseInt(d); });}class LineChart extends Component { render ({ data }) { let WIDTH = 500; let HEIGHT = 300; let TICK_COUNT = 5; let MAX_X = Math.max(…data.map(d => d.x)); let MAX_Y = Math.max(…data.map(d => d.y)); let x = val => val / MAX_X * WIDTH; let y = val => HEIGHT – val / MAX_Y * HEIGHT; let x_ticks = getTicks(TICK_COUNT, MAX_X); let y_ticks = getTicks(TICK_COUNT, MAX_Y).reverse(); let d = ` M${x(data[0].x)} ${y(data[0].y)} ${data.slice(1).map(d => { return `L${x(d.x)} ${y(d.y)}`; }).join(‘ ‘)} `; return ( <div class=”LineChart” style={{ width: WIDTH + ‘px’, height: HEIGHT + ‘px’ }} > <svg width={WIDTH} height={HEIGHT}> <path d={d} /> </svg> <div class=”x-axis”> {x_ticks.map(v => <div data-value={v}/>)} </div> <div class=”y-axis”> {y_ticks.map(v => <div data-value={v}/>)} </div> </div> ); }}let data = [ {x: 0, y: 10}, {x: 10, y: 40}, {x: 20, y: 30}, {x: 30, y: 70}, {x: 40, y: 0}];render(<LineChart data={data} />, document.querySelector(“#app”))
And the CSS:
body { margin: 0; padding: 0; font-family: sans-serif; font-size: 14px;}.LineChart { position: relative; padding-left: 40px; padding-bottom: 40px;}svg { fill: none; stroke: #33C7FF; display: block; stroke-width: 2px; border-left: 1px solid black; border-bottom: 1px solid black;}.x-axis { position: absolute; bottom: 0; height: 40px; left: 40px; right: 0; display: flex; justify-content: space-between;}.y-axis { position: absolute; top: 0; left: 0; width: 40px; bottom: 40px; display: flex; flex-direction: column; justify-content: space-between; align-items: flex-end;}.y-axis > div::after { margin-right: 4px; content: attr(data-value); color: black; display: inline-block;}.x-axis > div::after { margin-top: 4px; display: inline-block; content: attr(data-value); color: black;}
Source: JSFiddle
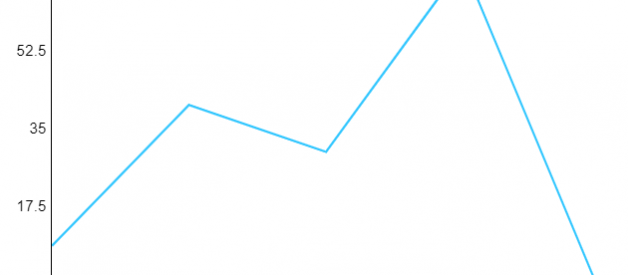
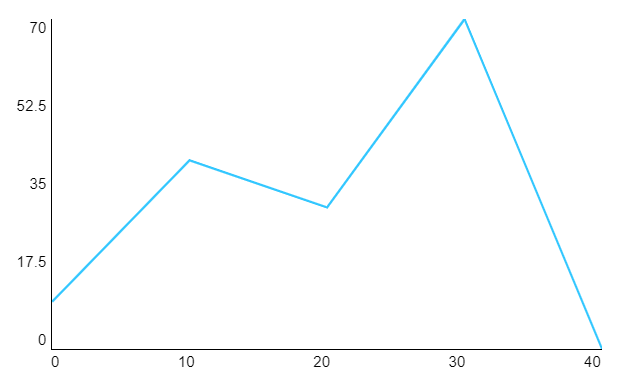 Simple Line Chart using Preact and CSS
There?s quite a bit of code, but I?m only using the tools already at my disposal, in this case, my view library which is Preact (can be anything though, React, Vue, Angular etc), and modern CSS tools like flexbox.
The D3 example requires learning many concepts about D3. The latter only requires using knowledge you already have about your view library. I would argue it?s easier to maintain than the D3 example, as anyone who knows the view library should be able to jump into the code base and start making modifications.
Don?t forget about the bundle size
Depending on the type of chart and how much tree-shaking can optimise your bundle, D3 at worst will be importing 70+ KB of code. This can have impacts on the loading of your site. So while it is true that you?re writing more code than the original D3 example, overall you?re distributing less code than if you had used D3.
In general, when using third party code, it?s always important to remember the costs of using that code. If you only require a single function from a library, would you import the entire library for that functionality? Yes, you shouldn?t always re-invent the wheel, but you have to consider the time to learn that library, the size it adds to your bundle, the license of that library, the support that library will have, the trustworthiness of the maintainers, the ability to fix bugs in a timely manner, etc.
Canvas and HTML are often better than SVG
If you?ve noticed in the example earlier, we used a combination of HTML and SVG. For some reason, people will try to implement entire charts using SVGs, but there?s really no need to. CSS is far more powerful than SVG these days.
For example, SVG doesn?t natively support text wrapping. If we wanted to do text-wrapping, we?d have to calculate it in JavaScript:
function wrap(text, width) { text.each(function() { var text = d3.select(this), words = text.text().split(/s+/).reverse(), word, line = , lineNumber = 0, lineHeight = 1.1, // ems y = text.attr(“y”), dy = parseFloat(text.attr(“dy”)), tspan = text.text(null) .append(“tspan”) .attr(“x”, 0) .attr(“y”, y) .attr(“dy”, dy + “em”); while (word = words.pop()) { line.push(word); tspan.text(line.join(” “)); if (tspan.node().getComputedTextLength() > width) { line.pop(); tspan.text(line.join(” “)); line = [word]; tspan = text.append(“tspan”) .attr(“x”, 0) .attr(“y”, y) .attr(“dy”, ++lineNumber * lineHeight + dy + “em”) .text(word); } } });}
Source: bl.ocks.org
With HTML on the other hand, as long as white-space is set to normal, it?ll just wrap naturally.
Elements such as circles and rectangles can be done in HTML and CSS. You can use transform and border-radius to create all kinds of shapes. If you wanted to do a bar chart in D3 with two rounded corners, you couldn?t use rect because it will round all four corners, instead of the two corners you wanted to round. Your only option would be using path.
The only reason I would use SVG tags, is because of the path tag. It?s still the only clean way of creating arbitrary shapes with no HTML equivalent.
If you need extra performance, there?s also the canvas tag to consider. With canvas you will have to code basic interactions yourself, but it comes with the benefit of not having the overhead of HTML or SVG which can consume memory and be slower to update. You can update the individual pixels on the canvas however you want, so you can optimise your visualisation and scale it. New browser APIs such as OffscreenCanvas will also help to boost performance when used inside Workers.
But Canvas doesn?t scale like SVG? [update]
A very common thing that I?ve heard quite often, is that canvas is not suitable for visualisations because it doesn?t scale as well as SVG. Under normal use of canvas, if you zoom in or zoom out of a page or use a browser which a higher DPI display, your canvas will come out pixelated and blurry.
This happens because when you create your canvas, you have to define how many pixels you want your canvas to draw with. When we set the attributes width and height it may look like we?re setting the CSS size, but we?re actually setting the size of the canvas drawing space. These are not the same thing.
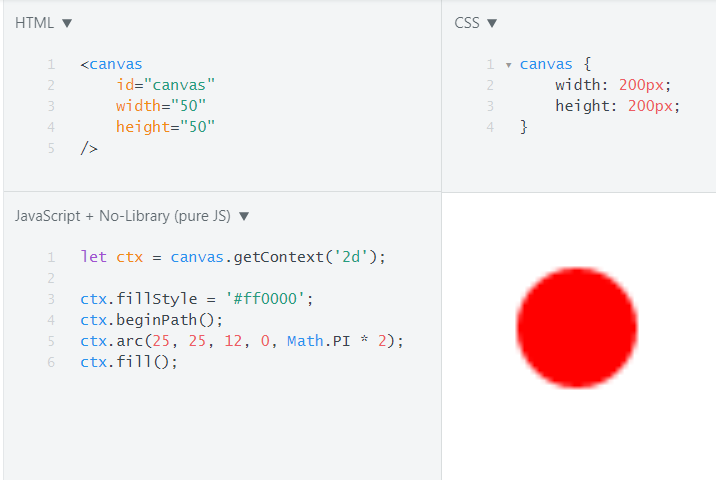 Canvas with a drawing space of 50×50 pixels, but stretched to 200×200 CSS pixels, causing pixelation.
Normally your CSS pixels would be set to the same size as your canvas drawing space, but when you zoom in/out with your browser, you?ll see the same issue again. The solution is to use window.devicePixelRatio and scale your canvas drawing space.
onResize() { let canvas = this.base.querySelector(‘canvas’); let ctx = canvas.getContext(‘2d’); let PIXEL_RATIO = window.devicePixelRatio; canvas.width = canvas.offsetWidth * PIXEL_RATIO; canvas.height = canvas.offsetHeight * PIXEL_RATIO; ctx.setTransform(PIXEL_RATIO, 0, 0, PIXEL_RATIO, 0, 0); this.props.onDraw(ctx, canvas.offsetWidth, canvas.offsetHeight);}
Source: JSFiddle
Using the pixel ratio, we can increase the drawing space for the canvas. But increasing the drawing space isn?t enough, we also need to tell the canvas that future drawing operations must be scaled to the pixel ratio. This will then solve all of the scaling problems.
Can you tell which ones are canvas, and which ones are SVG?
 Zoomed in browser, with a standard canvas, a pixel ratio aware canvas, and SVG.
Conclusion
As you can see, there?s numerous reasons as to why D3 is fairly outdated now for many common use cases. The web has evolved significantly since its release. If you?re doing simple charts like donuts, bar charts, line charts, scatter plots, etc, consider seeing if you can implement them using your existing framework. There?s nothing really that D3 will provide you for those use cases. In terms of maintenance, your code will likely be more maintainable rather than more difficult to maintain, and if you need to make any changes, it should be trivial to make those changes.
There?s no reason for product managers to feel concerned about not using D3, and you shouldn?t be concerned either.
Thanks for reading!
Updates
- [17th December 2018] Article updated to add ?But Canvas doesn?t scale like SVG?? section.
