

Event Tracing for Windows (ETW) is the mechanism Windows uses to trace and log system events. Attackers often clear event logs to cover their tracks. Though the act of clearing an event log itself generates an event, attackers who know ETW well may take advantage of tampering opportunities to cease the flow of logging temporarily or even permanently, without generating any event log entries in the process.
The Windows event log is the data source for many of the Palantir Critical Incident Response Team?s Alerting and Detection Strategies, so familiarity with event log tampering tradecraft is foundational to our success. We continually evaluate our assumptions regarding the integrity of our event data sources, document our blind spots, and adjust our implementation. The goal of this blog post is to share our knowledge with the community by covering ETW background and basics, stealthy event log tampering techniques, and detection strategies.
Introduction to ETW and event logging
The ETW architecture differentiates between event providers, event consumers, and event tracing sessions. Tracing sessions are responsible for collecting events from providers and for relaying them to log files and consumers. Sessions are created and configured by controllers like the built-in logman.exe command line utility. Here are some useful commands for exploring existing trace sessions and their respective ETW providers; note that these must usually be executed from an elevated context.
List all running trace sessions
> logman query -etsData Collector Set Type Status————————————————-Circular Kernel Context Logger Trace RunningAppModel Trace RunningScreenOnPowerStudyTraceSession Trace RunningDiagLog Trace RunningEventLog-Application Trace RunningEventLog-System Trace RunningLwtNetLog Trace RunningNtfsLog Trace RunningTileStore Trace RunningUBPM Trace RunningWdiContextLog Trace RunningWiFiSession Trace RunningUserNotPresentTraceSession Trace RunningDiagtrack-Listener Trace RunningMSDTC_TRACE_SESSION Trace RunningWindowsUpdate_trace_log Trace Running
List all providers that a trace session is subscribed to
> logman query “EventLog-Application” -etsName: EventLog-ApplicationStatus: RunningRoot Path: %systemdrive%PerfLogsAdminSegment: OffSchedules: OnSegment Max Size: 100 MB Name: EventLog-ApplicationEventLog-ApplicationType: TraceAppend: OffCircular: OffOverwrite: OffBuffer Size: 64Buffers Lost: 0Buffers Written: 242Buffer Flush Timer: 1Clock Type: SystemFile Mode: Real-time Provider:Name: Microsoft-Windows-SenseIRProvider Guid: {B6D775EF-1436-4FE6-BAD3-9E436319E218}Level: 255KeywordsAll: 0x0KeywordsAny: 0x8000000000000000 (Microsoft-Windows-SenseIR/Operational)Properties: 65Filter Type: 0 Provider:Name: Microsoft-Windows-WDAG-ServiceProvider Guid: {728B02D9-BF21-49F6-BE3F-91BC06F7467E}Level: 255KeywordsAll: 0x0KeywordsAny: 0x8000000000000000Properties: 65Filter Type: 0 … Provider:Name: Microsoft-Windows-PowerShellProvider Guid: {A0C1853B-5C40-4B15-8766-3CF1C58F985A}Level: 255KeywordsAll: 0x0KeywordsAny: 0x9000000000000000 (Microsoft-Windows-PowerShell/Operational,Microsoft-Windows-PowerShell/Admin)Properties: 65Filter Type: 0
This command details the configuration of the trace session itself, followed by the configuration of each provider that the session is subscribed to, including the following parameters:
- Name: The name of the provider. A provider only has a name if it has a registered manifest, but it always has a unique GUID.
- Provider GUID: The unique GUID for the provider. The GUID and/or name of a provider is useful when performing research or operations on a specific provider.
- Level: The logging level specified. Standard logging levels are: 0 ? Log Always; 1 ? Critical; 2 ? Error; 3 ? Warning; 4 ? Informational; 5 ? Verbose. Custom logging levels can also be defined, but levels 6?15 are reserved. More than one logging level can be captured by ORing respective levels; supplying 255 (0xFF) is the standard method of capturing all supported logging levels.
- KeywordsAll: Keywords are used to filter specific categories of events. While logging level is used to filter by event verbosity/importance, keywords allow filtering by event category. A keyword corresponds to a specific bit value. All indicates that, for a given keyword matched by KeywordsAny, further filtering should be performed based on the specific bitmask in KeywordsAll. This field is often set to zero. More information on All vs. Any can be found here.
- KeywordsAny: Enables filtering based on any combination of the keywords specified. This can be thought of as a logical OR where KeywordsAll is a subsequent application of a logical AND. The low 6 bytes refer to keywords specific to the provider. The high two bytes are reserved and defined in WinMeta.xml in the Windows SDK. For example, in event log-related trace sessions, you will see the high byte (specifically, the high nibble) set to a specific value. This corresponds to one or more event channels where the following channels are defined:
0x01 – Admin channel0x02 – Debug channel0x04 – Analytic channel0x08 – Operational channel
- Properties: This refers to optional ETW properties that can be specified when writing the event. The following values are currently supported (more information here):
0x001 – EVENT_ENABLE_PROPERTY_SID0x002 – EVENT_ENABLE_PROPERTY_TS_ID0x004 – EVENT_ENABLE_PROPERTY_STACK_TRACE0x008 – EVENT_ENABLE_PROPERTY_PSM_KEY0x010 – EVENT_ENABLE_PROPERTY_IGNORE_KEYWORD_00x020 – EVENT_ENABLE_PROPERTY_PROVIDER_GROUP0x040 – EVENT_ENABLE_PROPERTY_ENABLE_KEYWORD_00x080 – EVENT_ENABLE_PROPERTY_PROCESS_START_KEY0x100 – EVENT_ENABLE_PROPERTY_EVENT_KEY0x200 – EVENT_ENABLE_PROPERTY_EXCLUDE_INPRIVATE
From a detection perspective, EVENT_ENABLE_PROPERTY_SID, EVENT_ENABLE_PROPERTY_TS_ID, EVENT_ENABLE_PROPERTY_PROCESS_START_KEY are valuable fields to collect. For example, EVENT_ENABLE_PROPERTY_PROCESS_START_KEY generates a value that uniquely identifies a process. Note that Process IDs are not unique identifiers for a process instance.
- Filter Type: Providers can optionally choose to implement additional filtering; supported filters are defined in the provider manifest. In practice, none of the built-in providers implement filters as confirmed by running TdhEnumerateProviderFilters over all registered providers. There are some predefined filter types defined in eventprov.h (in the Windows SDK):
0x00000000 – EVENT_FILTER_TYPE_NONE0x80000000 – EVENT_FILTER_TYPE_SCHEMATIZED0x80000001 – EVENT_FILTER_TYPE_SYSTEM_FLAGS0x80000002 – EVENT_FILTER_TYPE_TRACEHANDLE0x80000004 – EVENT_FILTER_TYPE_PID0x80000008 – EVENT_FILTER_TYPE_EXECUTABLE_NAME0x80000010 – EVENT_FILTER_TYPE_PACKAGE_ID0x80000020 – EVENT_FILTER_TYPE_PACKAGE_APP_ID0x80000100 – EVENT_FILTER_TYPE_PAYLOAD0x80000200 – EVENT_FILTER_TYPE_EVENT_ID0x80000400 – EVENT_FILTER_TYPE_EVENT_NAME0x80001000 – EVENT_FILTER_TYPE_STACKWALK0x80002000 – EVENT_FILTER_TYPE_STACKWALK_NAME0x80004000 – EVENT_FILTER_TYPE_STACKWALK_LEVEL_KW
Enumerating all registered ETW providers
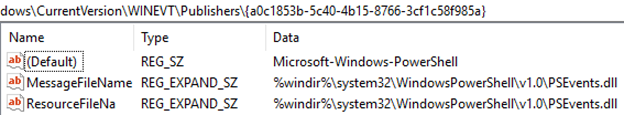
The logman query providers command lists all registered ETW providers, supplying their name and GUID. An ETW provider is registered if it has a binary manifest stored in the HKLMSOFTWAREMicrosoftWindowsCurrentVersionWINEVTPublishers{PROVIDER_GUID} registry key. For example, the Microsoft-Windows-PowerShell provider has the following registry values:
ETW and the event log know how to properly parse and display event information to a user based on binary-serialized information in the WEVT_TEMPLATE resource present in the binaries listed in the ResourceFileName registry value. This resource is a binary representation of an instrumentation manifest (i.e., the schema for an ETW provider). The binary structure of WEVT_TEMPLATE is under-documented, but there are at least two tools available to assist in parsing and recovering event schema, WEPExplorer and Perfview.
Viewing an individual provider
The logman tool prints basic information about a provider. For example:
The listings shows supported keywords and logging values, as well as all processes that are registered to emit events via this provider. This output is useful for understanding how existing trace sessions filter on providers. It is also useful for initial discovery of potentially interesting information that could be gathered from via an ETW trace.
Notably, the PowerShell provider appears to support logging to the event log based on the existence of the reserved keywords in the high nibble of the defined keywords. Not all ETW providers are designed to be ingested into the event log; rather, many ETW providers are intended to be used solely for low-level tracing, debugging, and more recently-developed security telemetry purposes. For example, Windows Defender Advanced Threat Protection relies heavily upon ETW as a supplemental detection data source.
Viewing all providers that a specific process is sending events to
Another method for discovering potentially interesting providers is to view all providers to which events are written from a specific process. For example, the following listing shows all providers relevant to MsMpEng.exe (the Windows Defender service, running as pid 5244 in this example):
Entries listed with GUID are providers lacking a manifest. They will typically be related to WPP or TraceLogging, both of which are beyond the scope of this blog post. It is possible to retrieve provider names and event metadata for these providers types. For example, here are some of the resolved provider names from the unnamed providers above:
- 05F95EFE-7F75?49C7-A994?60A55CC09571Microsoft.Windows.Kernel.KernelBase
- 072665FB-8953?5A85?931D-D06AEAB3D109Microsoft.Windows.ProcessLifetimeManage
- 7AF898D7?7E0E-518D-5F96-B1E79239484CMicrosoft.Windows.Defender
Event provider internals
Looking at ETW-replated code snippets in built-in Windows binaries can help you understand how ETW events are constructed and how they surface in event logs. Below, we highlight two code samples, System.Management.Automation.dll (the core PowerShell assembly) and amsi.dll.
System.Management.Automation.dll event tracing
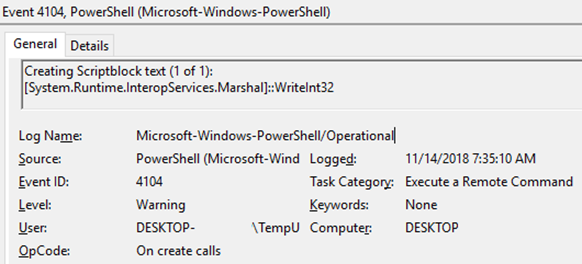
One of the great security features of PowerShell version 5 is scriptblock autologging; when enabled, script content is automatically logged to the Microsoft-Windows-PowerShell/Operational event log with event ID 4104 (warning level) if the scriptblock contains any suspicious terms. The following C# code is executed to generate the event log:
From PowerShell
The LogOperationalWarning method is implemented as follows:
From PowerShell
The WriteEvent method is implemented as follows:
From PowerShell
Finally, the event information is marshaled and EventWriteTransfer is called, supplying the Microsoft-Windows-PowerShell provider with event data.
The relevant data supplied to EventWriteTransfer is as follows:
- Microsoft-Windows-PowerShell provider GUID: {A0C1853B-5C40-4b15-8766-3CF1C58F985A}
- Event ID: PSEventId.ScriptBlock_Compile_Detail – 4104
- Channel value: PSChannel.Operational – 16Again, the usage of a channel value indicates that the provider is intended to be used with the event log. The operational channel definition for the PowerShell ETW manifest can be seen here. When an explicit channel value is not supplied, Message Compiler (mc.exe) will assign a default value starting at 16. Since the operational channel was defined first, it was assigned 16.
- Opcode value: PSOpcode.Create – 15
- Logging level: PSLevel.Warning – 3
- Task value: PSTask.CommandStart – 102
- Keyword value: PSKeyword.UseAlwaysAnalytic – 0x4000000000000000This value is later translated to 0 as seen in the code block above. Normally, this event would not be logged but because the Application event log trace session specifies the EVENT_ENABLE_PROPERTY_ENABLE_KEYWORD_0 Enable flag for all of its providers which will log the event despite a keyword value not being specified.
- Event data: the scriptblock contents and event fields
Upon receiving the event from the PowerShell ETW provider, the event log service parses the binary WEVT_TEMPLATE schema (original XML schema) and presents human-readable, parsed event properties/fields:
amsi.dll event tracing
You may have observed that Windows 10 has an AMSI/Operational event log that is typically empty. To understand why events are not logged to this event log, you would first have to inspect how data is fed to the AMSI ETW provider (Microsoft-Antimalware-Scan-Interface – {2A576B87-09A7-520E-C21A-4942F0271D67}) and then observe how the Application event log trace session (EventLog-Application) subscribes to the AMSI ETW provider. Let?s start by looking at the provider registration in the Application event log. The following PowerShell cmdlet will supply us with this information:
> Get-EtwTraceProvider -SessionName EventLog-Application -Guid ‘{2A576B87-09A7-520E-C21A-4942F0271D67}’SessionName : EventLog-ApplicationGuid : {2A576B87-09A7-520E-C21A-4942F0271D67}Level : 255MatchAnyKeyword : 0x8000000000000000MatchAllKeyword : 0x0EnableProperty : {EVENT_ENABLE_PROPERTY_ENABLE_KEYWORD_0, EVENT_ENABLE_PROPERTY_SID}
The following properties should be noted:
- Operational channel events (as indicated by 0x8000000000000000 in the MatchAnyKeyword value) are captured.
- All logging levels are captured.
- Events should be captured even if an event keyword value is zero as indicated by the EVENT_ENABLE_PROPERTY_ENABLE_KEYWORD_0 flag.
This information on its own does not explain why AMSI events are not logged, but it supplies needed context upon inspecting how amsi.dll writes events to ETW. By loading amsi.dl into IDA, we can see that there was a single call to the EventWrite function within the internal CAmsiAntimalware::GenerateEtwEvent function:
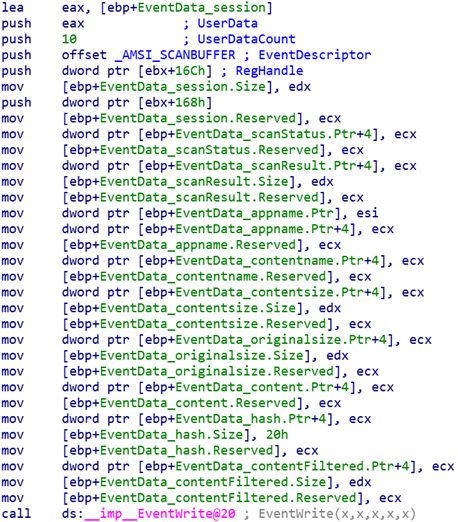
The relevant portion of the call to EventWrite is the EventDescriptor argument. Upon applying the EVENT_DESCRIPTOR structure type to _AMSI_SCANBUFFER, the following information was interpreted:
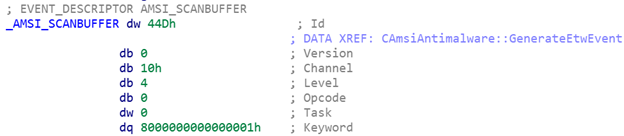
The EVENT_DESCRIPTOR context gives us the relevant information:
- Event ID: 1101 (0x44D)This events details can be extracted from a recovered manifest as seen here.
- Channel: 16 (0x10) referring to the operational event log channel
- Level: 4 (Informational)
- Keyword: 0x8000000000000001 (AMSI/Operational OR Event1). These values are interpreted by running the logman query providers Microsoft-Antimalware-Scan-Interface command.
We now understand that 1101 events not logged to the Application event log because it only considers events where the keyword value matches 0x8000000000000000. In order to fix this issue and get events pumping into the event log, either the Application event log trace session would need to be modified (not recommended and requires SYSTEM privileges) or you could create your own persistent trace session (e.g., an autologger) to capture AMSI events in the event log. The following PowerShell script creates such a trace session:
$AutoLoggerGuid = “{$((New-Guid).Guid)}”New-AutologgerConfig -Name MyCustomAutoLogger -Guid $AutoLoggerGuid -Start EnabledAdd-EtwTraceProvider -AutologgerName MyCustomAutoLogger -Guid ‘{2A576B87-09A7-520E-C21A-4942F0271D67}’ -Level 0xff -MatchAnyKeyword 0x80000000000001 -Property 0x41
After running the above command, reboot, and the AMSI event log will begin to populate.
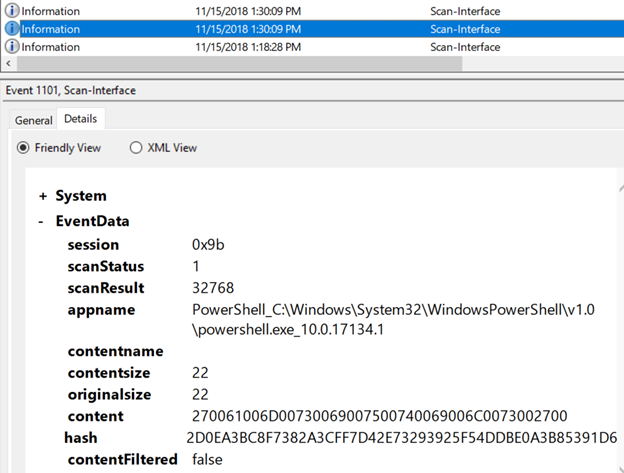
Some additional reverse engineering showed that the scanResult field refers to the AMSI_RESULT enum where, in this case, 32768 maps to AMSI_RESULT_DETECTED, indicating that the buffer (the Unicode encoded buffer in the content field) was determined to be malicious.
Without knowledge of ETW internals, a defender would not have been able to determine that additional data sources (the AMSI log in this case) can be fed into the event log. One would have to resort to speculation as to how the AMSI event became to be misconfigured and whether or not the misconfiguration was intentional.
ETW tampering techniques
If the goal of an attacker is to subvert event logging, ETW provides a stealthy mechanism to affect logging without itself generating an event log trail. Below is a non-exhaustive list of tampering techniques that an attacker can use to cut off the supply of events to a specific event log.
Tampering techniques can generally be broken down into two categories:
- Persistent, requiring reboot ? i.e., a reboot must occur before the attack takes effect. Changes can be reverted, but would require another reboot. These attacks involve altering autologger settings ? persistent ETW trace sessions with settings in the registry. There are more types of persistent attacks than ephemeral attacks, and they are usually more straightforward to detect.
- Ephemeral ? i.e., where the attack can take place without a reboot.
Autologger provider removal
Tampering category: Persistent, requiring rebootMinimum permissions required: AdministratorDetection artifacts: Registry key deletion: HKLMSYSTEMCurrentControlSetControlWMIAutologgerAUTOLOGGER_NAME{PROVIDER_GUID}Description: This technique involves the removal of a provider entry from a configured autologger. Removing a provider registration from an autologger will cause events to cease to flow to the respective trace session. Example: The following PowerShell code disables Microsoft-Windows-PowerShell event logging:
Remove-EtwTraceProvider -AutologgerName EventLog-Application -Guid ‘{A0C1853B-5C40-4B15-8766-3CF1C58F985A}’
In the above example, A0C1853B-5C40-4B15-8766-3CF1C58F985A refers to the Microsoft-Windows-PowerShell ETW provider. This command will end up deleting the HKLMSystemCurrentControlSetControlWMIAutologgerEventLog-Application{a0c1853b-5c40-4b15-8766-3cf1c58f985a} registry key.
Provider ?Enable? property modification
Tampering category: Persistent, requiring rebootMinimum permissions required: AdministratorDetection artifacts: Registry value modification: HKLMSYSTEMCurrentControlSetControlWMIAutologgerAUTOLOGGER_NAME{PROVIDER_GUID} – EnableProperty (REG_DWORD)Description: This technique involves alerting the Enable keyword of an autologger session. For example, by default, all ETW provider entries in the EventLog-Application autologger session are set to 0x41 which translates to EVENT_ENABLE_PROPERTY_SID and EVENT_ENABLE_PROPERTY_ENABLE_KEYWORD_0. EVENT_ENABLE_PROPERTY_ENABLE_KEYWORD_0 is not documented; it specifies that any events generated for a provider should be logged even if the keyword value is set to 0. An attacker could swap out EVENT_ENABLE_PROPERTY_ENABLE_KEYWORD_0 for EVENT_ENABLE_PROPERTY_IGNORE_KEYWORD_0, resulting in a value of 0x11, which would result in all events where the keyword is 0 to not be logged. For example, PowerShell eventing supplies a 0 keyword value with its events, resulting in no logging to the PowerShell event log.Example: The following PowerShell code disables Microsoft-Windows-PowerShell event logging:
Set-EtwTraceProvider -Guid ‘{A0C1853B-5C40-4B15-8766-3CF1C58F985A}’ -AutologgerName ‘EventLog-Application’ -Property 0x11
In the above example, A0C1853B-5C40-4B15-8766-3CF1C58F985A refers to the Microsoft-Windows-PowerShell ETW provider. This command will end up setting HKLMSystemCurrentControlSetControlWMIAutologgerEventLog-Application{a0c1853b-5c40-4b15-8766-3cf1c58f985a}EnableProperty to 0x11. Upon rebooting, events will cease to be reported to the PowerShell event log. An attacker is not constrained to using just the Set-EtwTraceProvider cmdlet to carry out this attack. An attacker could just modify the value directly in the registry. Set-EtwTraceProvider offers a convenient autologger configuration abstraction.Alternative detection artifacts/ideas: If possible, it is advisable to monitor for modifications of values within the HKLMSYSTEMCurrentControlSetControlWMIAutologgerAUTOLOGGER_NAME{PROVIDER_GUID} registry key. Note that modifying EnableProperty is just one specific example and that an attacker can alter ETW providers in other ways, too.
ETW provider removal from a trace session
Tampering category: EphemeralMinimum permissions required: SYSTEMDetection artifacts: Unfortunately, no file, registry, or event log artifacts are associated with this event. While the technique example below indicates that logman.exe was used to perform the attack, an attacker can obfuscate their techniques by using Win32 APIs directly, WMI, DCOM, PowerShell, etc. Description: This technique involves removing an ETW provider from a trace session, cutting off its ability to supply a targeted event log with events until a reboot occurs, or until the attacker restores the provider. While an attacker must have SYSTEM privileges to perform this attack, it is unlikely that defenders will notice such an attack if they rely on event logs for threat detection. Example: The following PowerShell code immediately disables Microsoft-Windows-PowerShell event logging until a reboot occurs or the attacker restores the ETW provider:
logman update trace EventLog-Application –p Microsoft-Windows-PowerShell -ets
Alternative detection artifacts/ideas:
- Event ID 12 within the Microsoft-Windows-Kernel-EventTracing/Analytic log indicates when a trace session is modified, but it doesn?t supply the provider name or GUID that was removed, so it would be difficult to confidently determine whether or not something suspicious occurred using this event.
- There have been several references thus far to the ETW PowerShell cmdlets housed in the EventTracingManagement module, which itself is a CDXML-based module. This means that all the cmdlets in the EventTracingManagement are backed by WMI classes. For example, the Get-EtwTraceProvider cmdlet is backed by the ROOT/Microsoft/Windows/EventTracingManagement:MSFT_EtwTraceProvider class. Considering ETW providers can be represented in the form of WMI class instances, you could craft a permanent WMI event subscription that logs all provider removals from a specific trace session to the event log. This code sample creates an NtEventLogEventConsumer instance that logs event ID 8 to the Application event log (source: WSH) any time a provider is removed from the Application event log trace session, EventLog-Application. The logged event looks like the following:

- The frequency at which providers are removed from Application event logs in large environments is not currently known. As as fallback, it is still advised to log the execution of logman.exe, wpr.exe, and PowerShell in your environment.
Conclusion
Identifying blind spots and assumptions in Alerting and Detection Strategies is a crucial step in ensuring the resilience of detections. Since ETW is at the core of the event logging infrastructure, gaining an in-depth understanding of ETW tampering attacks is a valuable way to increase the integrity of security-related data sources.
Further Reading
- ETW ? Overview
- Instrumenting Your Code with ETW
- Event Tracing for Windows: Reducing Everest to Pike?s Peak
- Use this not this: Logging / Event Tracing
- Writing an Instrumentation Manifest
- Event Tracing Functions
- Configuring and Starting an AutoLogger Session
- Event Tracing
- TraceLogging
Authors
Matt G.

