T interval is good for situations where the sample size is small and population standard deviation is unknown.
When the sample size comes to be very small (n?30), the Z-interval for calculating confidence interval becomes less reliable estimate. And here the T-interval comes into place.
Refer to Khan academy: Small sample size confidence intervals
T-Distribution
The full name is Student’s t-distribution, which is a _tweaked version of Normal Distribution_.
Refer to wiki: Student?s t-distribution
When the sample size is small, the Normal distribution will no longer be a good fit for estimating the population.So we introduced the tweaked version of Normal Distribution for a small sample sized sampling data, which we called T-distribution.
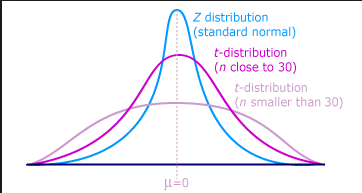
T-distribution vs. Normal distribution
They have the same centre: Sample Mean.But the tail of t-distribution is ?fatter? than the Normal distribution.
Conditions for a valid T Interval
The conditions we need for inference on one proportion are:
- Random:
The data needs to come from a random sample or randomized experiment.
- Normal:
The sample size is at least 30.
- Independent:
The independence condition says that when sampling without replacement, we can still treat each observation in the sample as independent as long as we sample less than 10%, percent of the population.
T-score
Refer to article: What is the T Score Formula?
A t score is one form of a Standardized Test Statistic (the other you?ll come across in elementary statistics is the z-score). The t score formula enables you to take an individual score and transform it into a standardized form>one which helps you to compare scores.You?ll want to use the t score formula when you don?t know the population standard deviation and you have a small sample (under 30).
The t score formula is:
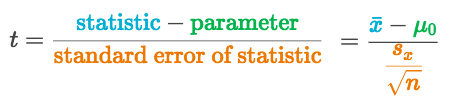
(x? is the _Sample Mean_, ?? is mean from _null hypothesis_, sx is the _Sample SD_, n is _Sample size_)
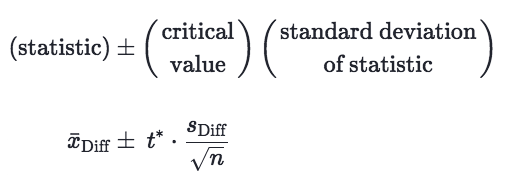
Understanding the formula
The statistic – parameter results the DISTANCE from Sample mean to _Population mean_.The Standard Error represents the DISTANCE from Sample SD to _population SD_.=> Therefore, dividing the Distance of mean by Distance of SD will results in a Normalized Distance for mean.
?? Back to previous note on: Standard Error
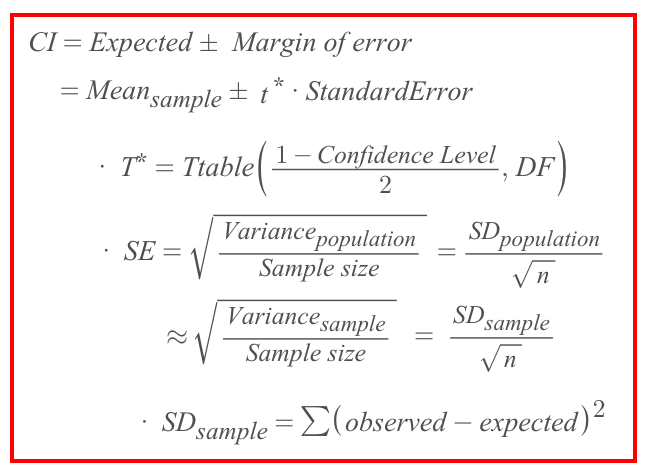
Formula of T-interval
The difference with Z-interval?s formula is instead of using Z* value, we’ll be using the T* value,and the calculation of Standard Error is different too.
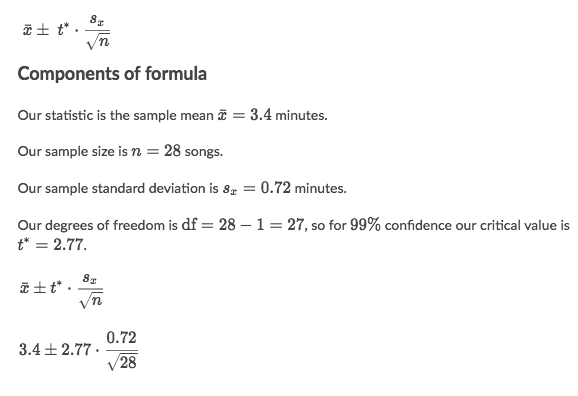
One-sample T interval
Example
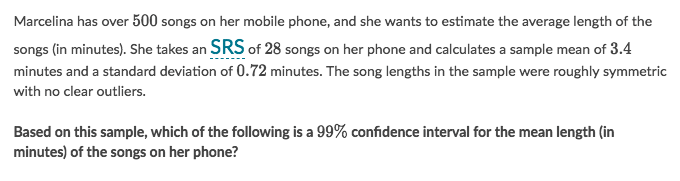
Solve:
T interval for paired data
Refer to article on Khan academy: Making a t interval for paired data
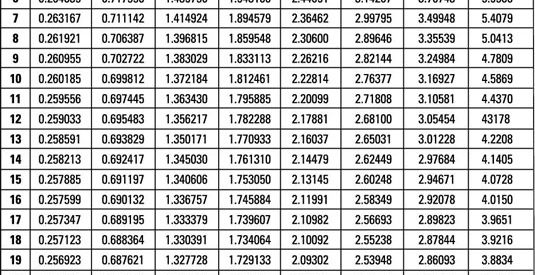
T-table
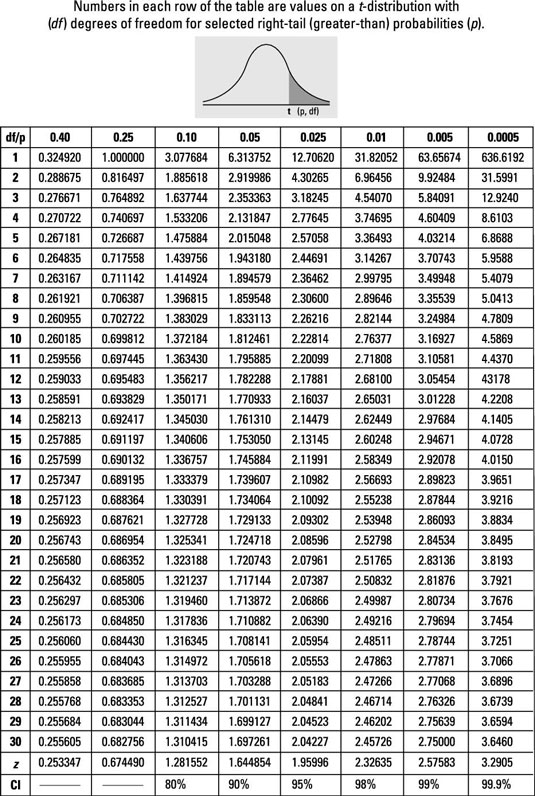
–


)
)