Recently, I learned about SOMs while applying for an internship. I thought I should share it with everyone since it is a very useful technique for clustering analysis, and exploring data. Also, we?ll discuss why it?s probably not the most popular technique for the same. Okay, let?s do this.
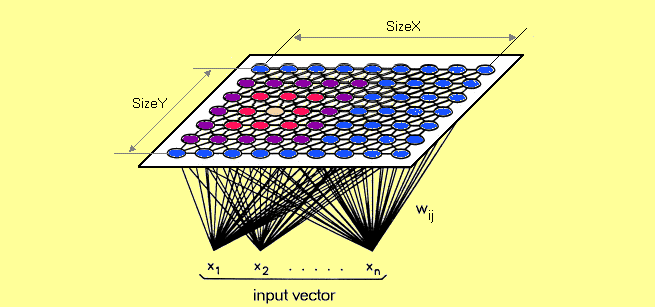
A self-organizing map (SOM) is a type of artificial neural network (ANN) that is trained using unsupervised learning to produce a low-dimensional (typically two-dimensional), discretized representation of the input space of the training samples, called a map, and is therefore a method to do dimensionality reduction. Self-organizing maps differ from other artificial neural networks as they apply competitive learning as opposed to error-correction learning (such as backpropagation with gradient descent), and in the sense that they use a neighborhood function to preserve the topological properties of the input space.
 Dimensionality reduction in SOM
SOM was introduced by Finnish professor Teuvo Kohonen in the 1980s is sometimes called a Kohonen map.
What really happens in SOM ?
Each data point in the data set recognizes themselves by competeting for representation. SOM mapping steps starts from initializing the weight vectors. From there a sample vector is selected randomly and the map of weight vectors is searched to find which weight best represents that sample. Each weight vector has neighboring weights that are close to it. The weight that is chosen is rewarded by being able to become more like that randomly selected sample vector. The neighbors of that weight are also rewarded by being able to become more like the chosen sample vector. This allows the map to grow and form different shapes. Most generally, they form square/rectangular/hexagonal/L shapes in 2D feature space.
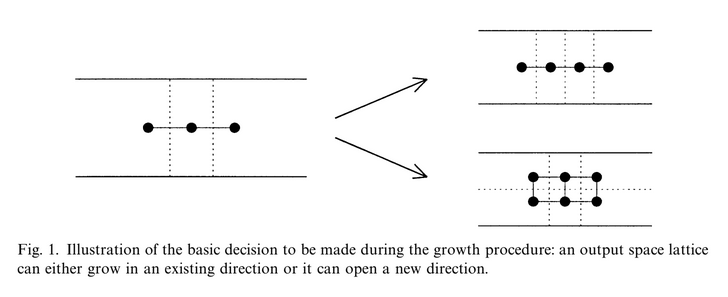 Referece: Applications of the growing self-organizing map, Th. Villmann, H.-U. Bauer, May 1998
The Algorithm:
- Each node?s weights are initialized.
- A vector is chosen at random from the set of training data.
- Every node is examined to calculate which one?s weights are most like the input vector. The winning node is commonly known as the Best Matching Unit (BMU).
- Then the neighbourhood of the BMU is calculated. The amount of neighbors decreases over time.
- The winning weight is rewarded with becoming more like the sample vector. The nighbors also become more like the sample vector. The closer a node is to the BMU, the more its weights get altered and the farther away the neighbor is from the BMU, the less it learns.
- Repeat step 2 for N iterations.
Best Matching Unit is a technique which calculates the distance from each weight to the sample vector, by running through all weight vectors. The weight with the shortest distance is the winner. There are numerous ways to determine the distance, however, the most commonly used method is the Euclidean Distance, and that?s what is used in the following implementation.
Implementation:
Coming to implementation part, there are various Python libraries (minisom, sompy) out there which you could directly use to implement SOM. You could also write your own implementation of it. I?ve implemented both on the iris dataset. Here are the results:
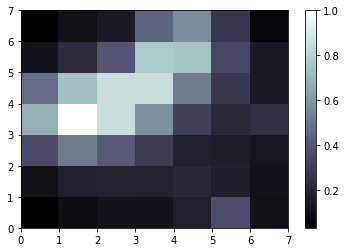 In simpler terms, the darker parts represent clusters, while the lighter parts represent the division of the clusters.
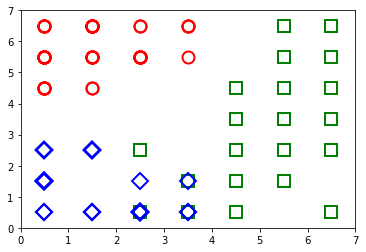 (Red Circles , Iris-setosa), (Green, Iris-versicolor) , (Blue, Iris-virginica)
Inference:
If the average distance is high, then the surrounding weights are very different and a light color is assigned to the location of the weight. If the average distance is low, a darker color is assigned. The resulting maps show that the concentration of different clusters of species are more predominant in three zones. First figure tells us only about where the density of species is greater (darker regions) or less (lighter regions). The second visualisation tells us how they are specifically clustered.
Cons of Kohonen Maps:
- It does not build a generative model for the data, i.e, the model does not understand how data is created.
- It does not behave so gently when using categorical data, even worse for mixed types data.
- The time for preparing model is slow, hard to train against slowly evolving data
Reference:
Reading material:
Applications of the growing self-organizing map, Th. Villmann, H.-U. Bauer, May 1998
https://en.wikipedia.org/wiki/Self-organizing_map
Application:
http://blog.yhat.com/posts/self-organizing-maps-2.html
http://www.pitt.edu/~is2470pb/Spring05/FinalProjects/Group1a/tutorial/som.html
http://www.ai-junkie.com/ann/som/som1.html
Code:
Please find my code here.
https://github.com/abhinavralhan/kohonen-maps
Feel free to contact me for any feedback/query/corrections here.

