Key aspects necessary for creating production-ready code
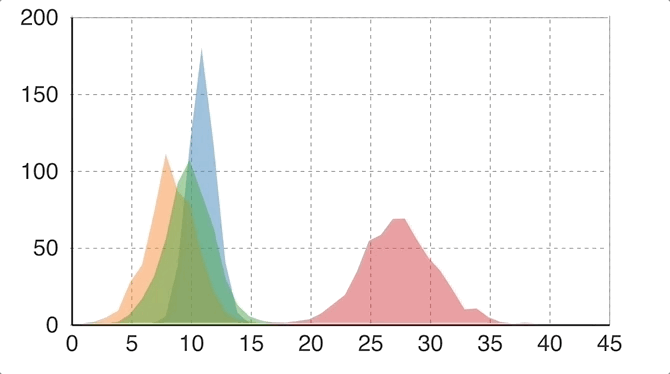 Real-time pizza delivery lead-time frequency distribution (fictional data)
This article shows you how to build reactive charts inside an Angular 8 application using the D3 JavaScript framework.
While there are a number of good articles and discussion threads covering this topic (some listed in the references), I have attempted to bring together all the key aspects necessary for creating production-ready code.
- GitHub repo
- Live demo
Why D3 on Top of Angular?
D3?s (Data-Driven-Documents) core capability is to manipulate DOM elements in response to dynamic application data. But, so it is for Angular, React, jQuery, and a host of other frameworks.
The motivation to use the D3 (or similar) framework with Angular is to provide the following data visualization capabilities:
- Dynamically creating and removing graphical elements from the DOM.
- Binding application data to graphical elements.
- Transforming user data to chart and shape coordinates.
- Animating graphical elements using transitions and interpolation.
- Advanced mathematical functions.
Given these D3 capabilities and lack of equivalent features in Angular, we proceed with mixing the two with an abundance of caution.
Collaborate Without Competing
Angular frowns upon direct DOM manipulation using the native DOM API or other frameworks. There is a risk of breakage when application code directly acts on a DOM element that is already being modified by Angular.
Designing the components to isolate the sections of the DOM managed by Angular vs. D3 mitigates some of the risk.
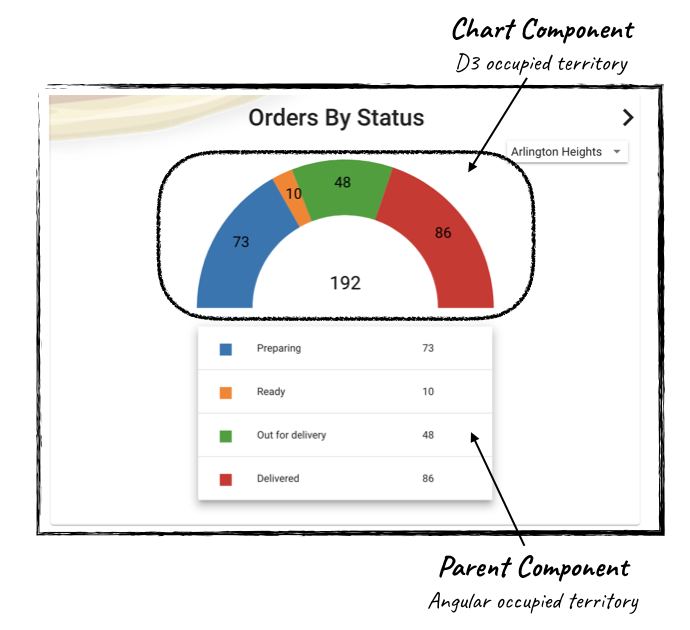
The parent component delivers the chart peripherals and hosts the chart component inside one dedicated container.
Everything inside that container is then managed by the child component using D3 alone. This eliminates the possibility of both frameworks trying to modify the same DOM element (except in the case of a coding blunder!).
Installation
The code and techniques in this article apply to the following framework versions.
- Angular 8.2.9
- D3 5.12.0
- TypeScript compiler target: es2015
Review package.json and tsconfig.json in the project repository for the complete set of dependencies and options.
Assuming you have already created an Angular 8 application, do the following in the project home directory:
npm install d3 –savenpm install @types/d3 –save-dev
Code
Create the chart component
Create an Angular component to host the chart functionality.
ng generate component app-area-chart
Import D3 into this component.
import * as d3 from ‘d3’;
Accept input data
D3 charts can accept data in various shapes. However, all our example area chart needs is a few arrays of numbers, each representing a component of delivery lead times for a fictional pizza franchise.
Pre-process data
The first step in receiving data is to transform it to chart/shape parameters.
In our area chart example, this involves taking the raw lead times, converting them first to a frequency distribution and then to a chart area path element (a set of points that covers the area with color and other information).
D3 provides functions to do this for each type of chart (d3.pie(), d3.histogram, d3.area(), and so on).
// Histogram function to transform an array of numbers// to a frequency distribution with 60 intervalsthis.histogram = d3.histogram() .value((datum) => datum) .domain([0, 45]) .thresholds(this.x.ticks(60));…// data for this particular chart is a matrix with 4 rows// each row contains lead times for each stage in pizza delivery// first row for Preparation, second for Waiting, // third for In Transit and the last one for total delivery time// Each row is processed and placed in an array of bins for // the frequency distribution.private processData(data) { this.bins = ; data.forEach((row) => { this.bins.push(this.histogram(row)) });}
Create the chart elements
Using D3, add SVG and other graphic elements to the DOM.
…// Set the color scale this.colorScale = d3.scaleOrdinal(d3.schemeCategory10);// SVG elementthis.svg = d3.select(this.hostElement).append(‘svg’) .attr(‘width’, ‘100%’) .attr(‘height’, ‘100%’) .attr(‘viewBox’, ‘0 0 ‘ + viewBoxWidth + ‘ ‘ + viewBoxHeight);// Group element with origin at top left of SVG areathis.g = this.svg.append(“g”) .attr(“transform”, “translate(0,0)”);// X and Y Axis for area chartsthis.x = d3.scaleLinear() .domain([0, 45]) .range([30, 170]);…this.y = d3.scaleLinear() .domain([0, 200]) .range([90, 10]);//See code on github for formatting axis labels and ticks…// Area function to convert the frequency distributions// to an area in the chart. Makes use of X and Y axis functions// to transform the interval range and size to chart dimensionsthis.area = d3.area() .x((datum: any) => this.x((datum.x0+datum.x1)/2)) .y0(this.y(0)) .y((datum: any) => this.y(datum.length);…// Create one area for each bin // – each bin represents the frequency distribution // for each type of lead timethis.bins.forEach((row, index) => { this.paths.push( this.g.append(‘path’) .datum(row) .attr(‘fill’, this.colorScale(” + index)) .attr(“stroke-width”, 0.1) .attr(‘opacity’, 0.5) .attr(‘d’, (datum: any) => this.area(datum)) );});
Make it responsive
Incorporate the following to make the chart responsive to device dimensions and orientation:
- Use the SVG viewBox attribute while creating the SVG element.
- Specify all dimensions for elements inside the SVG in relation to the viewBox width and height.
- Ensure that the hosting container in the parent component is responsive.
// Another look at creation of SVG element // Use of viewBox ensures chart is responsive let viewBoxHeight = 100;let viewBoxWidth = 200;this.svg = d3.select(this.hostElement).append(‘svg’) .attr(‘width’, ‘100%’) .attr(‘height’, ‘100%’) .attr(‘viewBox’, ‘0 0 ‘ + viewBoxWidth + ‘ ‘ + viewBoxHeight);
Make it reactive
Input can be accepted into a component instance variable with the @Input decoration. The chart can react to data changes injected by the host component by implementing the Angular OnChanges interface.
@Input() data: number;ngOnChanges(changes: SimpleChanges) { if(changes.data) { this.updateChart(changes.data.currentValue); }}updateChart(data: number) { //redirect to createChart if first call}createChart(data: number) { …}
Once a change is detected, receive and reprocess the raw data using the same D3 histogram function used for creating the chart and bind the data to existing area paths. Add animation for a smooth transition effect.
this.paths.forEach((path, index) => { path.datum(this.bins[index]) .transition() .duration(1000) .attr(‘d’, (datum: any) => this.area(datum)) );});
While the above is sufficient to update an area chart with smooth transition, animating other chart shapes can be more involved.
More on animation
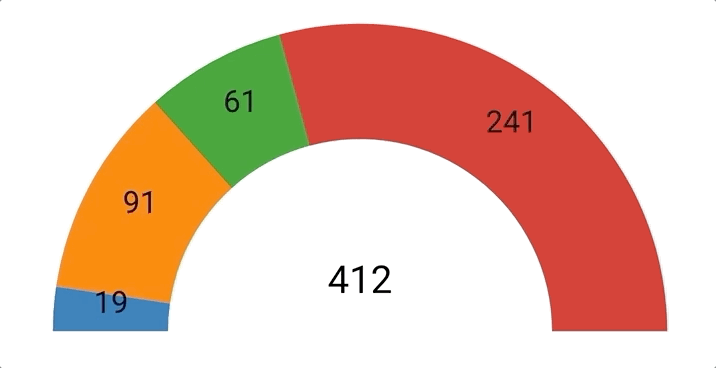
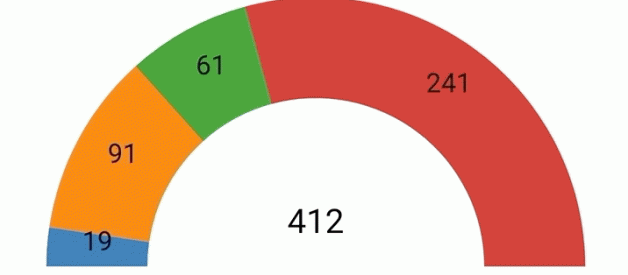
Another example in the demo is a donut chart that shows the count of orders in each status.
The pie and donut charts have their own pre-processing function. We create the charts using a similar approach as the earlier example:
// Pie function – transforms raw data to arc segment parameterspie = d3.pie() .startAngle(-0.5 * Math.PI) .endAngle(0.5 * Math.PI) .sort(null) .value((d: number) => d);…this.pieData = this.pie(data);…// Arc generatorthis.arc = d3.arc() .innerRadius(this.innerRadius) .outerRadius(this.radius);// Add slicesthis.slices = this.g.selectAll(‘allSlices’) .data(this.pieData) .enter() …
Once new data arrives, rebind the data to the pie slices and related elements to update the chart.
// Rebind data to slices and enable transition to new dimensionsthis.slices = this.slices.data(this.pieData);this.slices.transition().duration(750) .attrTween(“d”, this.arcTween);// Rebind data to labels and enable translation from // current centroid to the next centroidthis.labels.data(this.pieData);this.labels.each((datum, index, n) => { d3.select(n[index]) .text(this.labelValueFn(this.rawData[index]));});this.labels.transition() .duration(750) .attrTween(“transform”, this.labelTween);
The animation of pie/donut charts requires ?interpolation?. Given the shape data for the current and future state after update, the D3 ?tween? functions help compute a set of intermediate shape data sets.
This is called interpolation. The intermediate data sets (interpolations) are used by the D3 transitions to morph the chart element slowly from its current state on its way to the target state.
// Creates an “interpolator” for animated transition for arc slices.// Given previous and new arc states,// Generates a series of arcs ‘tween the start and end statesarcTween = (datum, index) => { const interpolation = d3.interpolate(this.pieDataPrevious[index], datum); this.pieDataPrevious[index] = interpolation(0); return (t) => { return this.arc(interpolation(t)); } }
The label tweening function interpolates the intermediate centroid positions, based on previous and current raw data values.
// Creates an “interpolator” for animated transition for arc labels// Given previous and new label positions,// generates a series of centroids ‘tween start and end statelabelTween = (datum, index) => { const interpolation = d3.interpolate( this.pieDataPrevious[index], datum ); this.pieDataPrevious[index] = interpolation(0); return (t) => { return ‘translate(‘ + this.arc.centroid(interpolation(t)) + ‘)’;}
Note: D3 provides various shape functions to convert user data to shape data, e.g. pie, histogram, area, etc. Different functions apply to different chart types. As is the case with tween functions.
Create the parent component
Develop the parent component using Angular.
Do not mix Angular and D3 DOM manipulation within the same component (my recommendation).
Keep the chart peripherals (title, legends, and data tables) in this parent component for the following reasons:
- Easier to implement the peripherals in Angular.
- Maintains visual harmony with the overall app look and feel.
- Maintains separation of concerns between Angular and D3.
- D3 does not have native support for generating chart legends.
Provide a container in the host component and embed the chart component as a child. Do not place any other elements within this container.
<!–HTML–><div id=”chartContainer”> <app-area-chart #areaChart [data]=”chartData”> </app-area-chart></div>
Create a handle for the child component using ViewChild. Ensure ViewEncapsulation is set to None, to allow global style classes to SVG elements.
// Typescript…@Component({ selector: ‘app-area-chart’, encapsulation: ViewEncapsulation.None, templateUrl: ‘./area-chart.component.html’, styleUrls: [‘./area-chart.component.scss’]})export class OrderDeliveryComponent …. { @ViewChild(‘areaChart’, {static: true}) chart: AreaChartComponent; …}
Style the chart container
Ensure that the chart container has height and width attributes. The child component can make use of these to size the chart and make it responsive.
If the chart component uses the viewbox attribute on the SVG element and is set with 100% height and width, the resulting chart will automatically scale or shrink in harmony with its parent.
// SCSS#chartContainer { display: flex; justify-content: center; align-items: center; height: 100%; width: 100%; app-area-chart { display: flex; justify-content: center; align-items: center; height: 100%; width: 100%; }}
Prepare data and pass it to the chart component
// Ensure the array is copied to a new array; Change detection will// not fire in the child component for updates to an existing array in the parent component.this.chart.data = […this.chartData];
Conclusion
D3 provides a powerful API for DOM manipulation. Using it for data visualization within an Angular application can greatly enhance the user experience.
However, risks of mixing the two frameworks need to be mitigated by separation of concerns, as described in this article.
References
The D3 Graph Gallery – Simple charts made in d3.js
Welcome to the D3.js graph gallery: a collection of simple charts made with d3.js.D3.js is a JavaScript library for?
www.d3-graph-gallery.com
d3-random
d3-random d3-random implements random number generators for various probability distributions. By default, each?
observablehq.com
Pie Chart Update, II
Mike Bostock’s Block 1346410
bl.ocks.org
And several other posts on Stack Overflow, bl.ocks.org, etc.
