Predict the Price of a Companies Stock Using Machine Learning and Python
First let me say it is extremely hard to try and predict the stock market. Even people with a good understanding of statistics and probabilities have a hard time doing this. Stock market prediction is the act of trying to determine the future value of a company stock or other financial instrument traded on an exchange. ? Wikipedia
However with all of that being said, if you are able to successfully predict the price of a stock, you could gain an incredible amount of profit.
In this article, I will create two very simple models to try to predict the stock market using machine learning and python. More specifically I will attempt to predict the price of Netflix stock. Netflix is considered to be one of the five most popular and best performing American technology companies, so I wanted to try to create a model or models to predict this companies future stock price. Please leave claps on this article if you find it helpful or entertaining. I would also like to know some of your strategies as well.
If you prefer not to read this article and would like a video representation of it, you can check out the YouTube Video below. It goes through everything in this article with a little more detail, and will help make it easy for you to start programming your own Machine Learning model even if you don?t have the programming language Python installed on your computer. Or you can use both as supplementary materials for learning about Machine Learning !
If you are interested in reading more on machine learning and algorithmic trading then you might want to read Hands-On Machine Learning for Algorithmic Trading: Design and implement investment strategies based on smart algorithms that learn from data using Python. The book will show you how to implement machine learning algorithms to build, train, and validate algorithmic models. It will also show you how to create your own algorithmic design process to apply probabilistic machine learning approaches to trading decisions, and the book will show you how to develop neural networks for algorithmic trading to perform time series forecasting and smart analytics.
 Hands-On Machine Learning for Algorithmic Trading: Design and implement investment strategies based on smart algorithms that learn from data using Python
Okay now with all of that out of the way, let?s start programming the models !
Start Programming:
I will start this program with a description.
#This programs attempts to predict the price of Netflix stock.
Next install the dependencies that will be used throughout the program.
#Install the dependenciesimport numpy as npimport pandas as pdfrom sklearn.tree import DecisionTreeRegressorfrom sklearn.linear_model import LinearRegressionfrom sklearn.model_selection import train_test_splitimport matplotlib.pyplot as pltplt.style.use(‘bmh’)
Load the data. Since I am using Googles website to program I need to use Google to upload the data file.
from google.colab import files # Use to load data on Google Colabuploaded = files.upload() # Use to load data on Google Colab
Store the data file into the variable and print the first 6 rows of data.
df = pd.read_csv(‘NFLX_Stock.csv’)df.head(6)
Visualize the data. I want to see what the closing price of Netflix looks like on a graph.
plt.figure(figsize=(16,8))plt.title(‘Netflix’, fontsize = 18)plt.xlabel(‘Days’, fontsize= 18)plt.ylabel(‘Close Price USD ($)’, fontsize = 18)plt.plot(df[‘Close Price’])plt.show()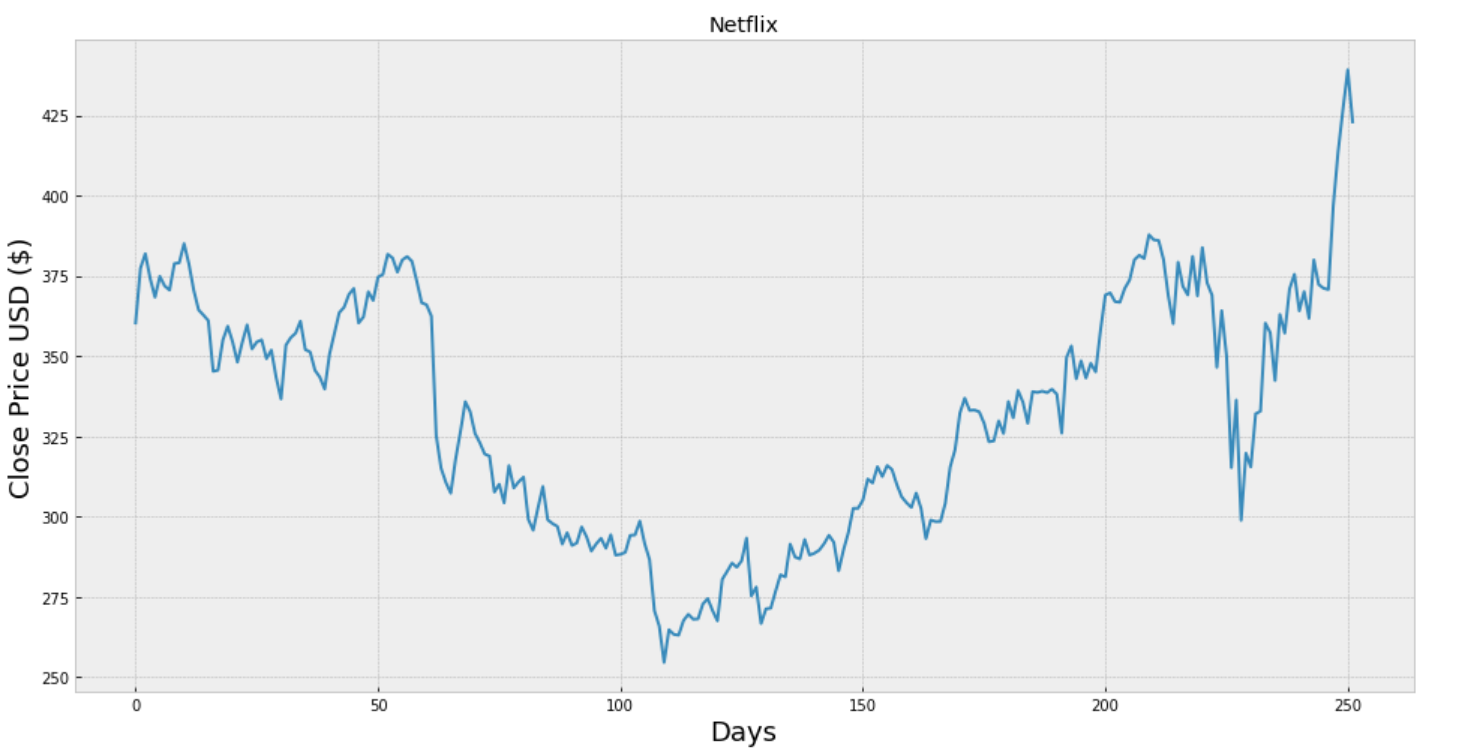
Now, I want to get and store only the close price of Netflix into the data frame and print the image.
df = df[[‘Close Price’]]df.head(4)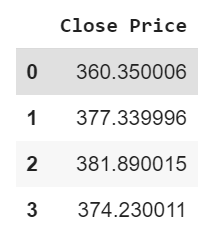
Create a variable to predict ?x? days out into the future. Then create a new column to store the target or dependent variable. This is essentially the close price shifted ?x? days up. Then print the last 4 rows of data.
#Create a variable to predict ‘x’ days out into the futurefuture_days = 25#Create a new column (the target or dependent variable) shifted ‘x’ units/days updf[‘Prediction’] = df[[‘Close Price’]].shift(-future_days)#print the datadf.tail(4)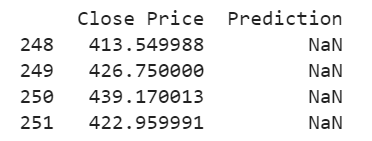
Create the feature data set and print it.
X = np.array(df.drop([‘Prediction’], 1))[:-future_days]print(X)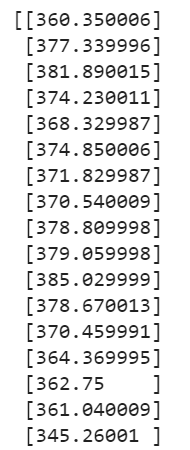
Create the target data set and print it.
y = np.array(df[‘Prediction’])[:-future_days]print(y)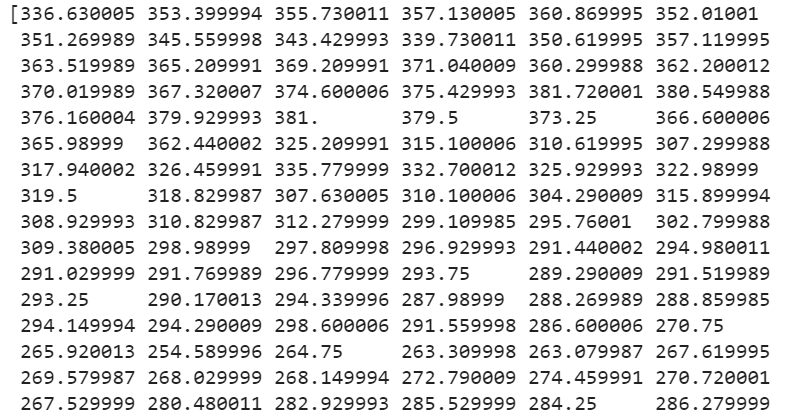
Split the data into 75% training and 25% testing data sets.
x_train, x_test, y_train, y_test = train_test_split(X, y, test_size = 0.25)
Time to create the models. The models that will be used for this program will use the Decision Tree Regressor and Linear Regression.
#Create the decision tree regressor modeltree = DecisionTreeRegressor().fit(x_train, y_train)#Create the linear regression modellr = LinearRegression().fit(x_train, y_train)
Get and print the last ?x? rows from the feature data set. I will use this data set to test the models and see how well they perform.
#Get the feature data, #AKA all the rows from the original data set except the last ‘x’ daysx_future = df.drop([‘Prediction’], 1)[:-future_days]#Get the last ‘x’ rowsx_future = x_future.tail(future_days) #Convert the data set into a numpy arrayx_future = np.array(x_future)x_future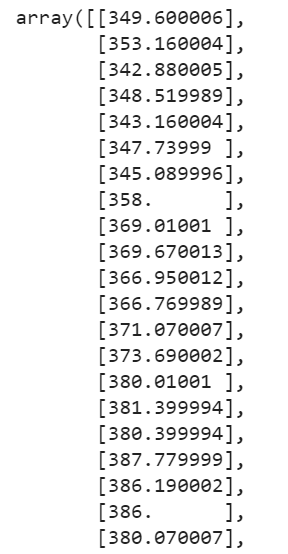
Show the models predictions.
#Show the model tree predictiontree_prediction = tree.predict(x_future)print( tree_prediction )print()#Show the model linear regression predictionlr_prediction = lr.predict(x_future)print(lr_prediction)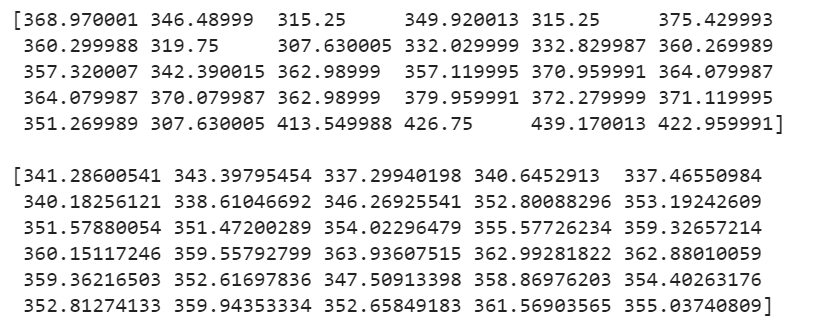
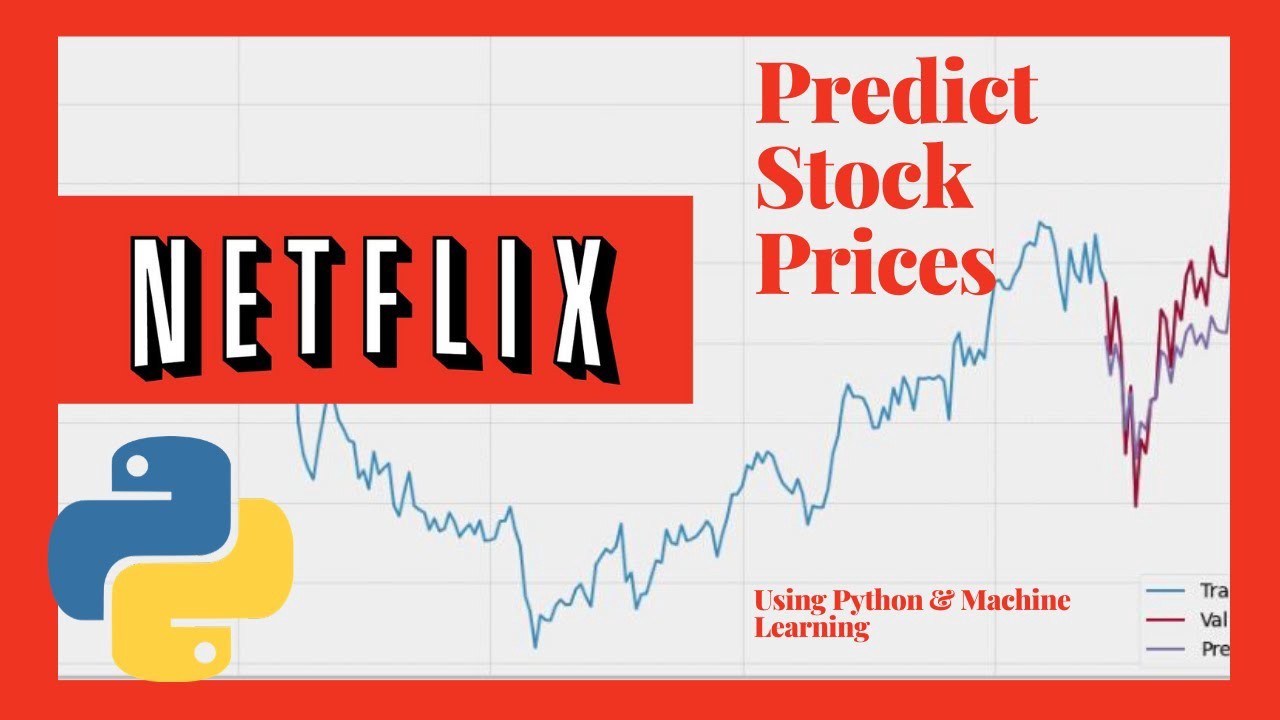
Visualize and compare the predicted values with the actual or valid values.
#Visualize the datapredictions = tree_prediction#Plot the datavalid = df[X.shape[0]:]valid[‘Predictions’] = predictions #Create a new column called ‘Predictions’ that will hold the predicted pricesplt.figure(figsize=(16,8))plt.title(‘Model’)plt.xlabel(‘Days’,fontsize=18)plt.ylabel(‘Close Price USD ($)’,fontsize=18)plt.plot(df[‘Close Price’])plt.plot(valid[[‘Close Price’,’Predictions’]])plt.legend([‘Train’, ‘Val’, ‘Prediction’ ], loc=’lower right’)plt.show()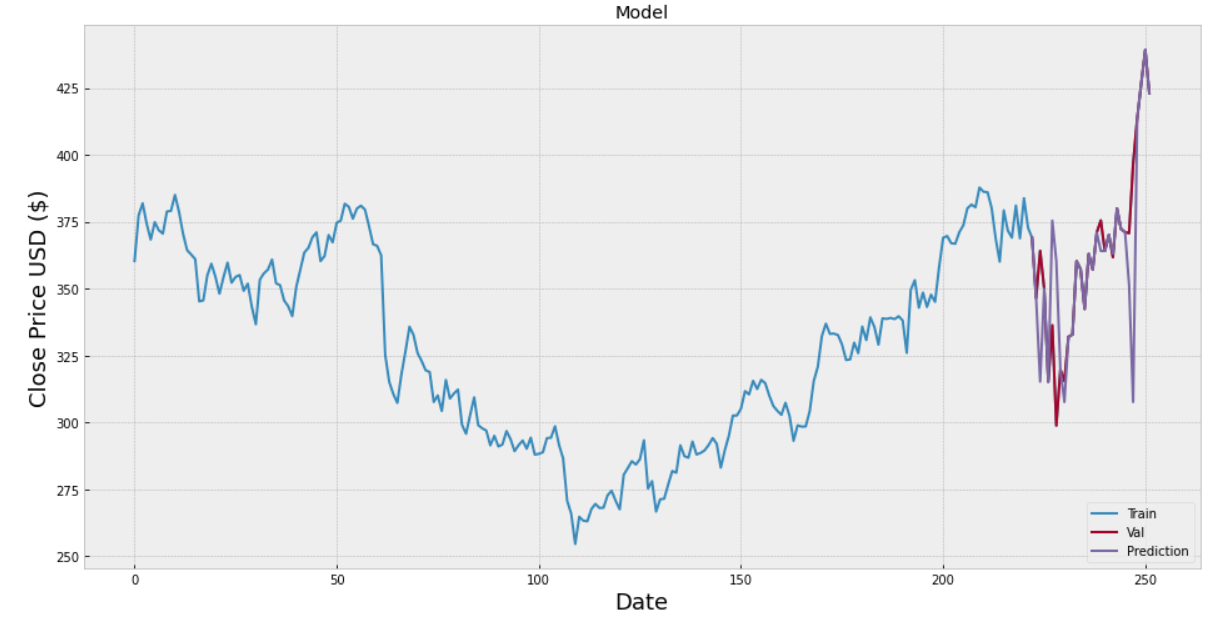 #Visualize the datapredictions = lr_prediction#Plot the datavalid = df[X.shape[0]:]valid[‘Predictions’] = predictions #Create a new column called ‘Predictions’ that will hold the predicted pricesplt.figure(figsize=(16,8))plt.title(‘Model’)plt.xlabel(‘Days’,fontsize=18)plt.ylabel(‘Close Price USD ($)’,fontsize=18)plt.plot(df[‘Close Price’])plt.plot(valid[[‘Close Price’,’Predictions’]])plt.legend([‘Train’, ‘Val’, ‘Prediction’ ], loc=’lower right’)plt.show()
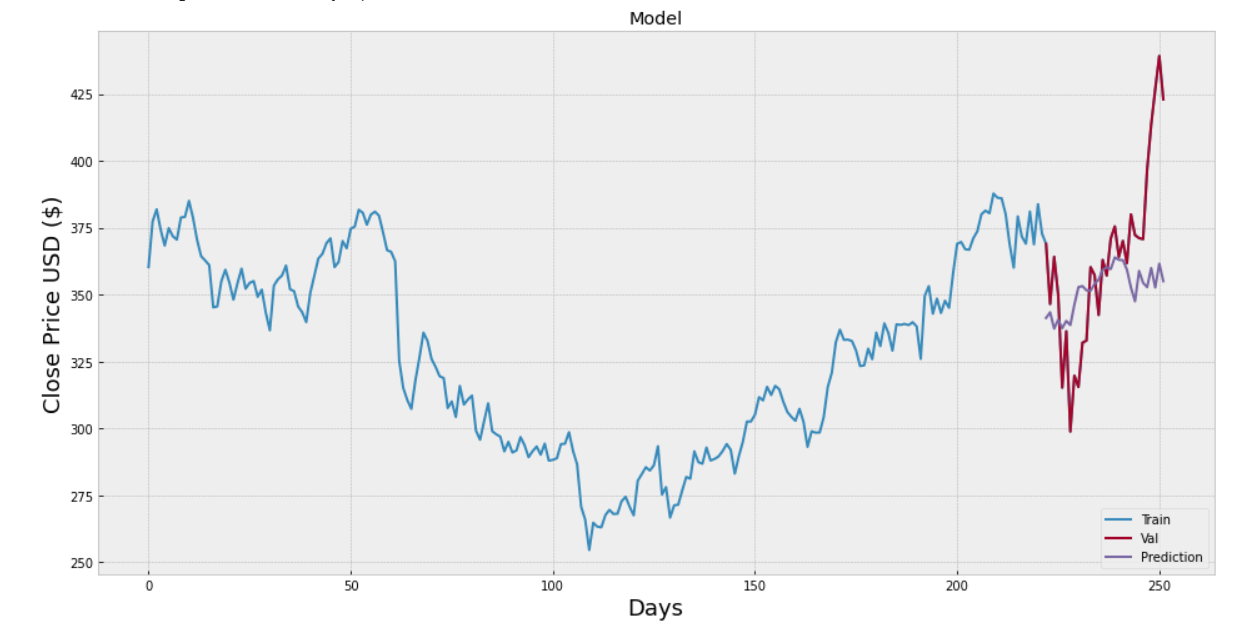
Based off of these two graphs alone and no other performance metrics. I would say that the Decision Tree model performed better than the Linear Regression model, however both seem very poor. I will have to improve on these models and or come up with a different strategy.
Thanks for reading this article I hope its helpful to you all ! If you enjoyed this article and found it helpful please leave some claps to show your appreciation. Keep up the learning, and if you like machine learning, mathematics, computer science, programming or algorithm analysis, please visit and subscribe to my YouTube channels (randerson112358 & computer science).
If you are also interested in reading more on machine learning in general to immediately get started with problems and examples then I strongly recommend you check out Hands-On Machine Learning with Scikit-Learn and TensorFlow: Concepts, Tools, and Techniques to Build Intelligent Systems. It is a great book for helping beginners learn how to write machine learning programs, and understanding machine learning concepts.
Hands-On Machine Learning with Scikit-Learn and TensorFlow: Concepts, Tools, and Techniques to Build Intelligent Systems

