Recently, the Democratic Party officially adopted a $15 minimum wage as part of its platform. While this discussion about the increase in minimum wage has been going on for quite some time, the issue of exactly how much minimum wage should be has been, from what I?ve seen, hotly contested.
The TL;DR here, in my humble opinion, is that ?15? is a nice round number that?s easy to remember (which is likely why it was chosen) and when cost of living adjustments are factored in it?s only slightly (as in, less than a dollar) higher than what it should be.
More on that in a little bit.
There?s some math in this article. I try to keep it simple and visualize it where possible.
Adjusting for Inflation
If you are comfortable / familiar with what ?adjusted for inflation? means you can probably skip this section. Understanding this concept is critical to understanding the larger issues of minimum wage and rent impacts.
Have you ever heard the phrase ?When I was a child, ____ only cost ___?? Over time, some prices seem like they go up (the ?nominal pricing?) even though the impact on you spending ability (the ?real pricing?) has remained the same or declined.
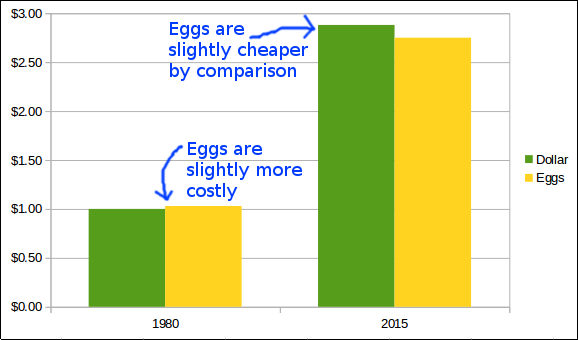
For example, a dozen eggs cost (on average) $1.03 in 1980 and $2.75 in 2015. But in 1980, $1 had the same buying power as $2.88 does in 2015.
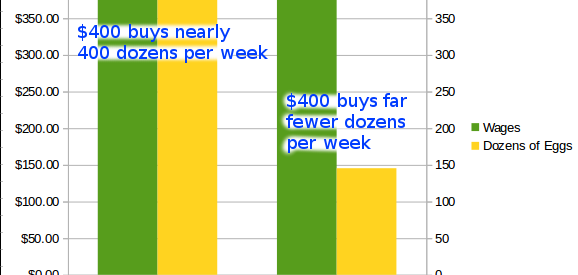
If these seems confusing, think of it this way: If you worked at a factory from 1980 to 2015, were paid $10 an hour, and never got a raise, you?d earn $400 per week. Back in 1980, this means you could buy 388.34 dozen eggs per week. But in 2015, that same $400 will only buy you 145.45 dozen eggs.
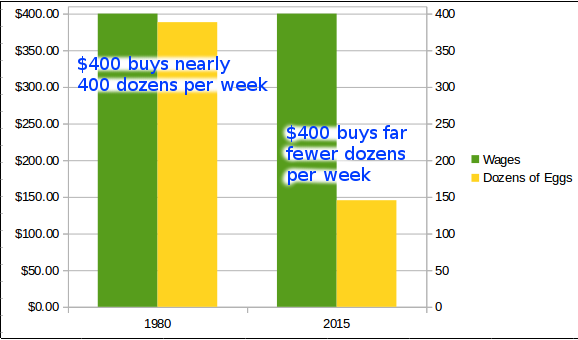
You get fewer eggs for the same amount of money.
How much would you need to earn per week to still afford 388.34 dozen eggs in 2015?
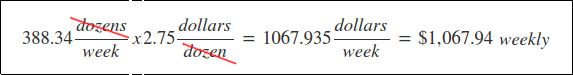
$1,067.94 weekly. Or $26.70 per hour (at full-time).
The crazy thing? Despite that huge apparent increase in price, the cost of eggs (the amount that it impacts your purchasing power) has gone down.
But what if the price of eggs had gone up instead, while wages continued to remain the same?
Minimum Wage History
President Franklin D. Roosevelt, famous for his ?New Deal? to help bring the US back up from its knees after the Depression of the early 20th century, created many social safety net programs, one of which was establishing a ?minimum wage? (the lowest wage an employer could pay their employees). He had good reasons for doing this, and I strongly urge you to read his statements in 1933 about ?living wage? in the National Industrial Recovery Act (his jobs program). Most notably:
It seems to me to be equally plain that no business which depends for existence on paying less than living wages to its workers has any right to continue in this country. By ?business? I mean the whole of commerce as well as the whole of industry; by workers I mean all workers, the white collar class as well as the men in overalls; and by living wages I mean more than a bare subsistence level-I mean the wages of decent living.
You may have seen parts of that quote before, in meme form.
The minimum wage wasn?t officially instituted until 1938 (5 years after that quote), but his feelings about the intent behind what would ultimately become the minimum wage seem pretty clear.
Regardless, the intent is irrelevant here. It?s a thing. It?s a number, and we can do math with numbers.
In 1938, the minimum wage was $0.25 per hour. In 2013 it had increased to $7.25 per hour. However, the high point, in terms of purchasing power, was 1968, when it was $1.60, (or $10.55 when adjusted to 2014 dollars). If you?re a visual person, you might find this chart from Wikipedia more useful:
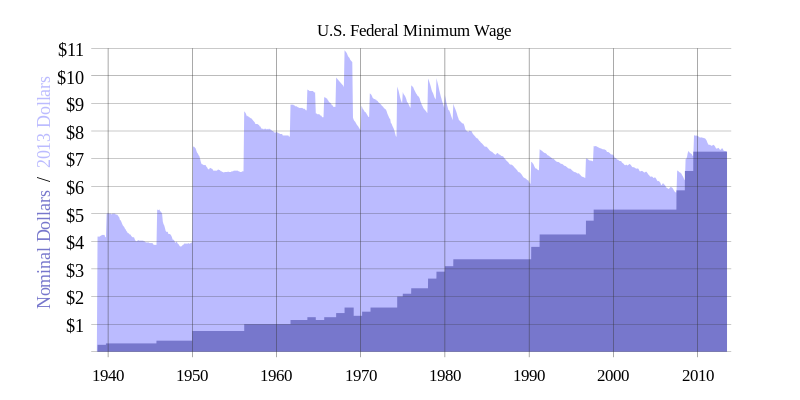 3.1Light blue area is purchasing power, dark blue is the dollar number you would see on your paycheck
The takeaway here is that the workers earning a minimum wage today are able to purchase far less with their earnings than they could in the past, most notably in 1968. (or, in egg terms: ?you can buy fewer eggs with your minimum wage now than you could in 1968?)
The funny thing? America has been incredibly prosperous. Our ?Gross Domestic Product?, which is basically the number we use to see how successful our country is, economically, has risen pretty aggressively over the past century. As a country, we?re doing great!
But what happens when you take the data of our Gross Domestic Product and compare it to the historical minimum wage?
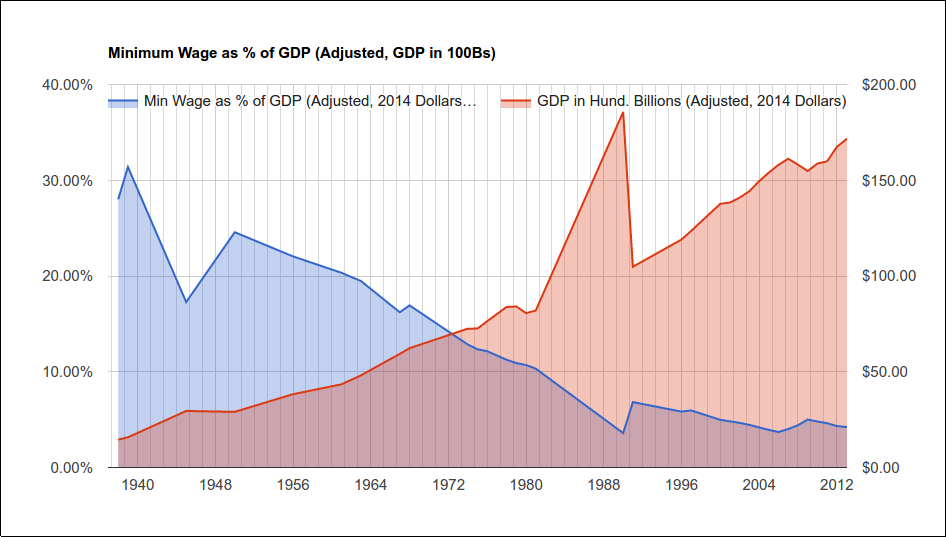 GDP is scaled to ?hundreds of billions?, so $1 = $100,000,000,000
That chart is from a dataset I?ve been compiling (integrating data from BLS, and other publicly-reported data). Feel free to check it out. The red area shows the the growth of GDP over time (it gets bigger!) and the blue area shows how much of that GDP is paid out to workers (it gets smaller!).
What this chart means is that, even though the US Economy has been doing better and better, the money that we?re earning, as a nation, is not being shared fairly with the laborers. By ?fairly? I mean that, at the very least, that blue line should be a stagnant amount (eg. 20% across the board), so as GDP increases, so do wages (and vice versa!).
In other words: the US economy can support paying its workers more. The money is available.
It just chooses not to.
This article isn?t about income inequality, but this is an opportune moment to present just one chart, since you might be asking yourself ?where is that money going then??
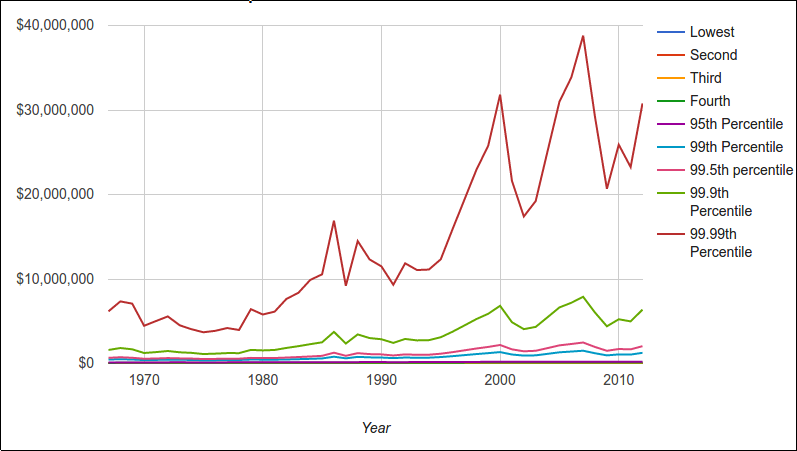 Dollar values are as-written. Notice that the bottom 95% of all earners are squashed flat? Source: IRS, US Census, Saez
That chart?s from a larger study I?ve been compiling about income inequality. It pulls data from the US Census, IRS, and research by Emmanuel Saez. (Fun fact: the US Census does not list incomes above the 95th percentile because it skews the data too much)
Cost of Living History
?Cost of Living? is a nebulous blanket term that includes shelter, heat, electricity, food; the basic human necessities. The most egregiously growing part of Cost of Living, or at least the one with the largest impacts on the most of us, would be shelter / rents.
The US Census has a table of Historical Median Gross Rents, which considers both the rental costs as well as the estimated average cost of utilities (electricity, water, heat). It has both national and state averages for each decade from 1940 up until 2000. These were adjusted to year 2000 dollars. There is also the map of Median Monthly Gross Rent: 2010?2014, which is adjusted to year 2014 dollars. I combined the two datasets, adjusting the nominal values of the former to year 2014 dollars.
It looks like this:
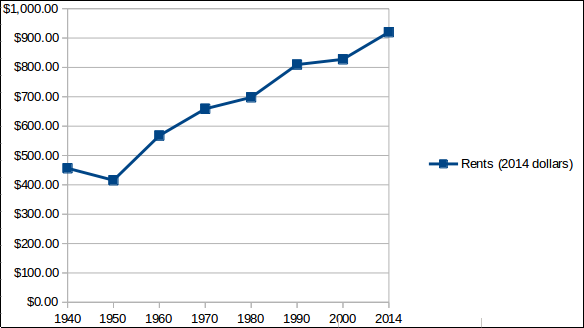 All values in 2014-adjusted dollars, source: US Census, links above
So rents are increasing. How does this look compared to the economic health of the country (the GDP, that we previously compared to the Minimum Wage)?
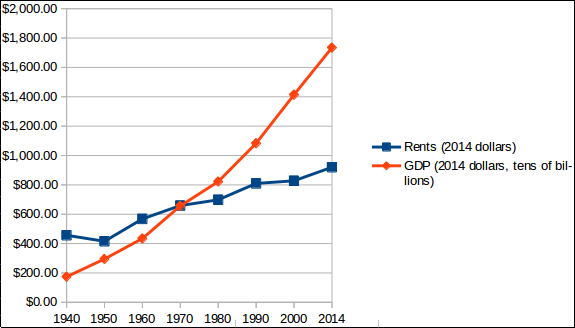 All values in 2014-adjusted dollars, source: US Census & US BEA, links above. Note that GDP is in tens of billions, and has been scaled down to compare the trends.
So the country, as a whole, can afford these rising rents and then some. But what about someone who is working full-time at a minimum wage job? Let?s say that a full-time job earns them 4 weeks of 40-hours of pay, gross. We?ll just look at gross wages and not deduct taxes. So if you earned $10 an hour, your monthly earnings would be:
40 hours x 4 weeks = 160 hours per month260 hours x $10 = $1,600 per month
Charting this against the rent trends over decades, we get:
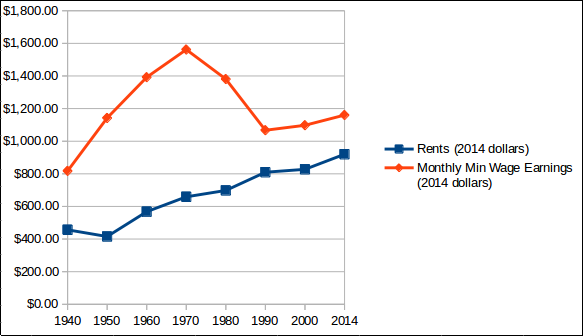 All values in 2014-adjusted dollars. Source is US Census and US DOL, links above
The pinch really started happening in 1990.
?The 30% Rule?
The US Census defines the ?housing cost burden? as the portion of income that must be spent on housing costs (rents, electricity, heat, water, etc.). This originated in the United States National Housing Act (1937, under FDR), and was designed to serve ?families in the lowest income group?. This particular definition has fluctuated between 20 and 30% over the years, but 30% has been the standard figure used for determining an acceptable portion diverted to housing costs. [Source: US Census]
Burdens at 30?49.9 percent are said to be ?moderate? and then burdens at 50% or more are said to be ?severe.?
We can calculate the burden using the numbers above. Like this:
Rent cost / Monthly income = Burden %$300 / $1000 = 30%
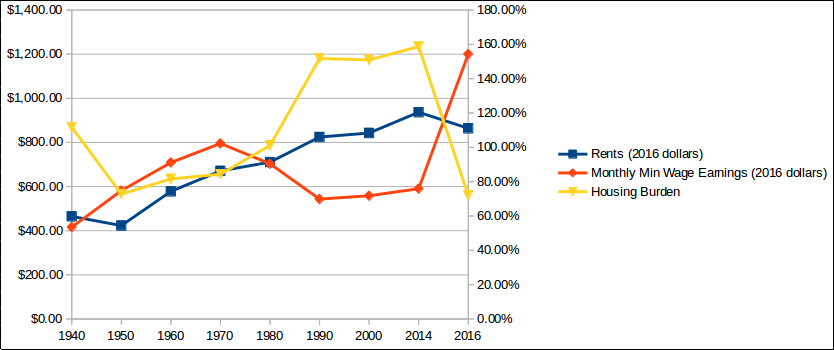
Using the values from the last chart, with that formula, we get:
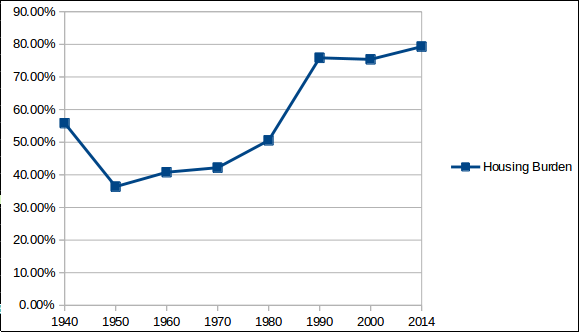 Comparing rental costs vs. monthly incomes for a full-time minimum wage employee
In the years leading up to 1980, full-time minimum-wage earners could afford to pay for a median-priced dwelling (and their utilities!) while only being ?moderately burdened?. But from 1980 to 1990, this scenario changed drastically, and has been relative stable since, leaving individuals and families with barely 20% of their income to be spent on things such as food, healthcare, clothing, and anything else.
Why a $15 Minimum Wage Makes Sense
Given that the current minimum wage is a mere $7.25, asking for it to suddenly be more than doubled seems like a tall order! But given what we saw earlier about the decline in purchasing power of the current minimum wage, what does this look like when we make it an even $15?
Taking the data for Q2 Median Rents from the US Census, and then re-adjusting all numbers to be in 2016 dollars, our (full time) Minimum Wage vs. Rents looks like this:
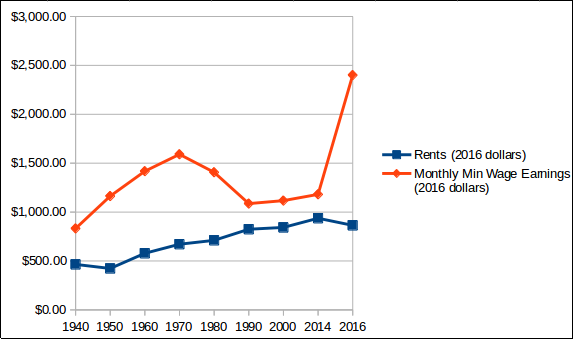 Minimum Wage income, 40-hrs per week, vs median rents, 2016 dollars
The $2,400 monthly income is, of course, pre-tax, but the income tax liability would be roughly between $141 and $242, depending on how many exemptions they claimed on their W4, so not enough to drastically change the difference.
That?s a big gap!
How does it affect the housing burden cost?
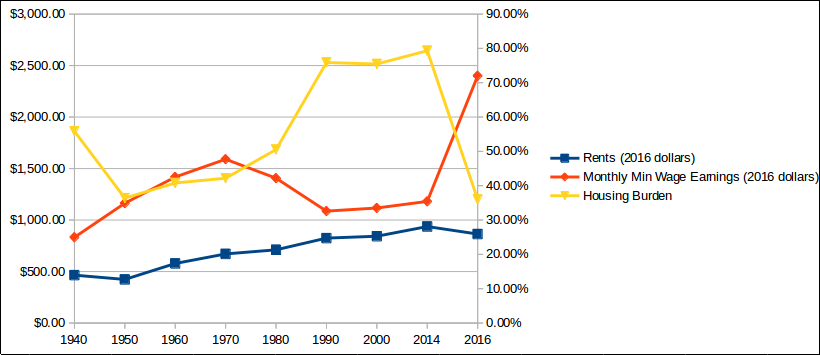 Comparing Full-time Minimum Wage & Housing Rents vs. overall Housing Burden, all values in 2016 dollars
All of a sudden, the housing burden drops from the untenable grip of a ?severe? ~80% to what the Census would call merely ?moderate? housing burden.
Just like it was in 1950.
(Considering how many people seem to nostalgically idolize the 1950s and 1960s, you might think this would appeal to them!)
Someone who is working full-time at a job that pays ?minimum wage? can now live modestly at median rent levels. They would have adequate money to pay for things beyond their roof and heat ? healthcare, food, clothing, and maybe even a tiny bit to save away in case of an emergency or so that they can someday buy a house or pay for their child?s tuition.
I had said earlier that $15 per hour was slightly higher than it needed to be ? it could be slightly lower than that and still fall within ?Moderate Burden?. Making it $13.50 per hour would put it on exactly 40% Burden (dead-center in that range) with Median rents of $864.
What about someone working 20 hours weekly (maybe they go to college)?
 Comparing Half-time Minimum Wage & Housing Rents vs. overall Housing Burden, all values in 2016 dollars
What would have previously required going into substantial debt now appears to be mitigated by getting a roommate or taking on small debt, or getting some financial assistance.
An Alternate Proposal: Housing Subsidies
Since increasing the minimum wage by that much might ripple out with unintentional effects, another possibility would be to increase it to what it would have been at its peak (about $10 an hour) and then provide housing subsidies to normalize the housing burden to roughly the same level (40% housing burden, halfway into ?Moderate?, would be $540 per month for someone earning $1,600 monthly). You can calculate other values with this equation:
![]() Burden expressed as a percentage, all others as dollar values
Burden expressed as a percentage, all others as dollar values
Challenges Going Forward
The main critiques I have seen of both proposals are that the market will mutate to accommodate these additional funds, and so it will return to homeostasis.
Introducing State-based rent controls (or at least rent stabilization) would be one way to ameliorate that outcome. Government regulation is necessary sometimes, as much as people dislike it, because it levels the playing field when ethical considerations are not espoused by all economic actors. Child labor was cheap, even though it was ultimately bad for the kids ? but since employers were unwilling to say ?we cannot, on good conscience, do this, and we can?t not do it because it makes us less competitive,? the government had to regulate and prohibit it. Same thing with regulations like the ?Clean Water? and ?Clean Air? acts ? if we cannot trust the private sector to be responsible and ethical, then the Government?s job is to step in to ensure that their fiduciary duties do not adversely affect the rest of us.
Another possibility is to address the bigger issue of wealth evaporating to the upper echelons of economic strata. Bleeding that wealth back down (likely through a more progressive tax rate that includes non-income taxation, such as on dividends, and also preventing dynastic wealth through taxation on estates) to everyone else would introduce more money back into the general economy and would be a more Keynesian solution.
After all, the money is there, it?s just all evaporating away from the people who are working to produce the GDP that yields those profits.
At the very least, however, the Minimum Wage should be modernized to once again fulfill the purpose that Roosevelt clearly intended it to, back in the 1930s. Even merely raising it to $10 an hour would bring the Burden down to 54% from ~80%; still classified as ?Severe?, but less so.
$13.50 an hour would be acceptable. $15 an hour would be invigorating.

