
A few ready-to-use codes for colors in Matlab, and tips to make your own 😉
Colors in Matlab are coded with three numbers : the Red, Green and Blue (RGB) values.
Go back to the reference page
While RGB are usually given on a scale from 0 to 255, the Matlab RGB scale goes from 0 to 1 (yeah, it would be too easy otherwise).
Keep in mind that white is color saturation while black is the absence of color:
white = [1 1 1];black = [0 0 0];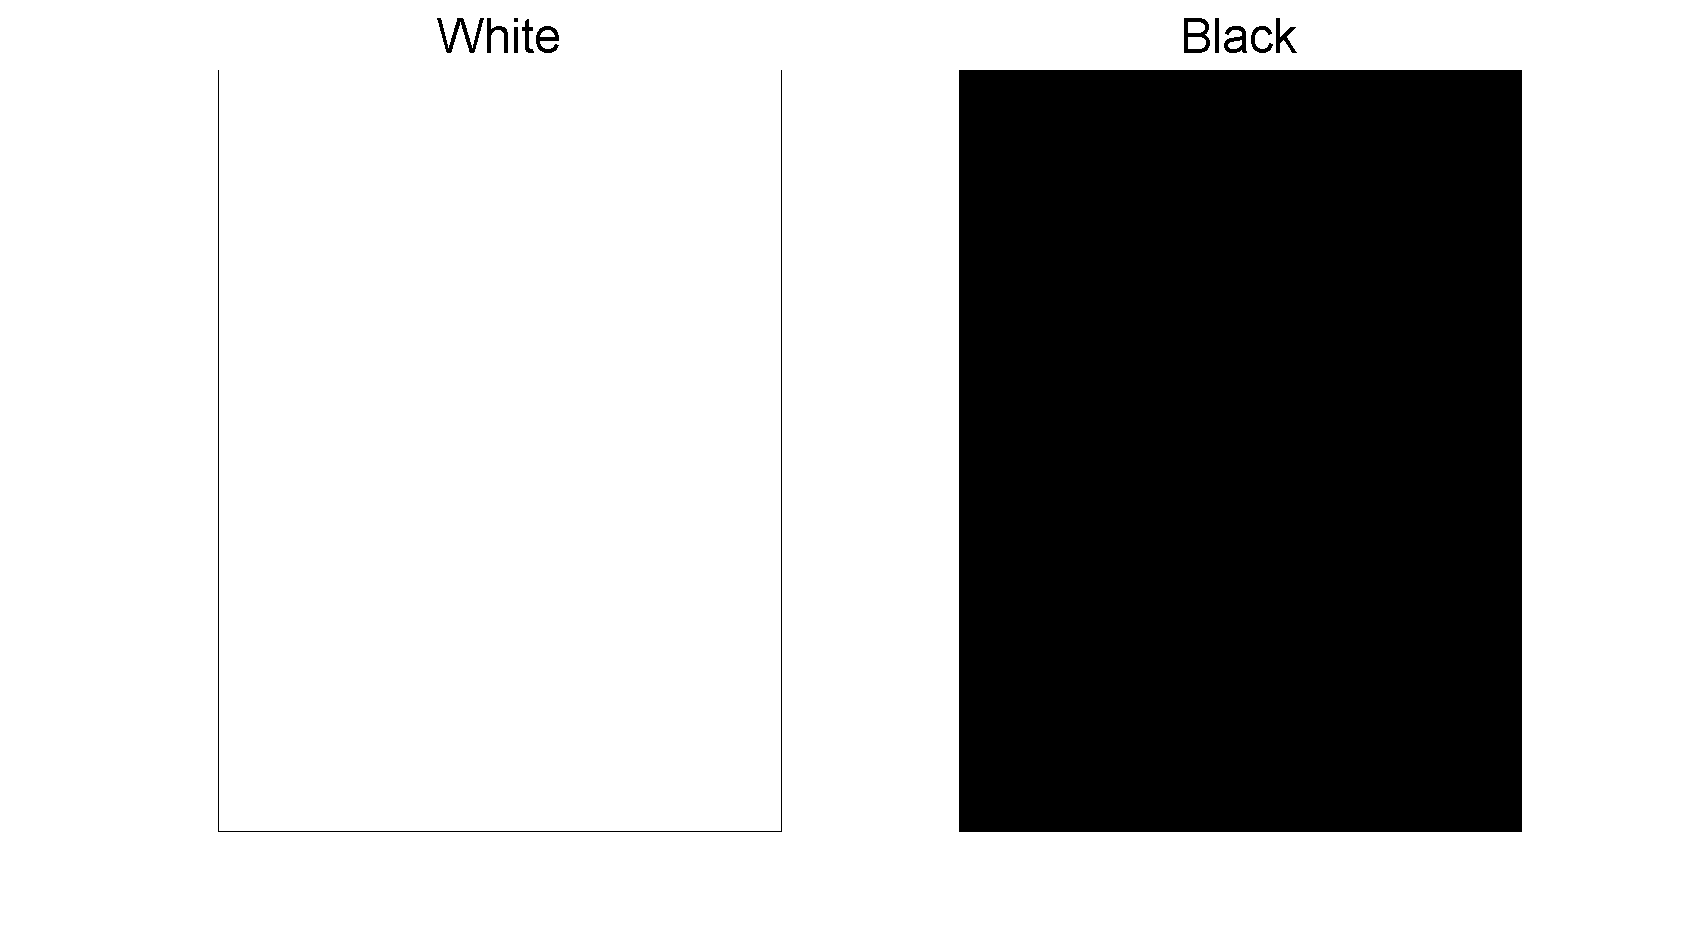 Figure 1: White and Black in Matlab.
And you can play around with the three number to make it lighter or darker:
lightGrey1 = [0.85 0.85 0.85];lightGrey2 = [0.7 0.7 0.7];darkGrey1 = [0.4 0.4 0.4];darkGrey2 = [0.2 0.2 0.2];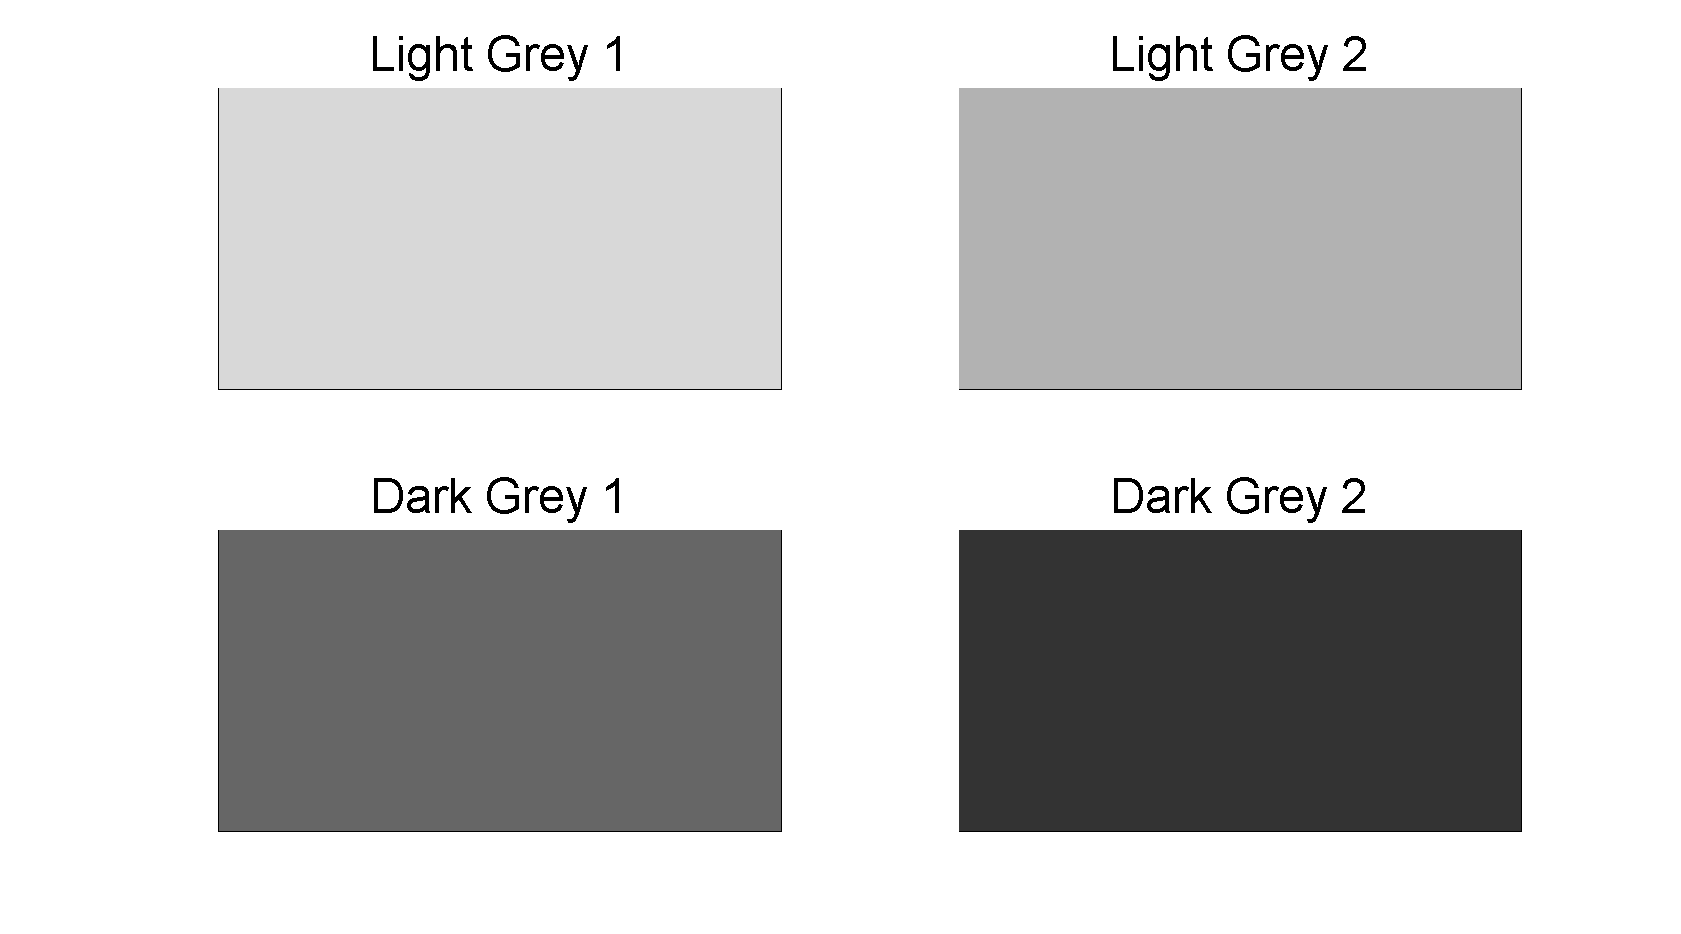 Figure 2 : Grey examples in Matlab.
Knowing that the first number is for red, the second for green and the third for blue (hence RGB), simply use a rule of three with the usual RGB values to create your colors in Matlab:
cyan = [0.2 0.8 0.8];brown = [0.2 0 0];orange = [1 0.5 0];blue = [0 0.5 1];green = [0 0.6 0.3];red = [1 0.2 0.2];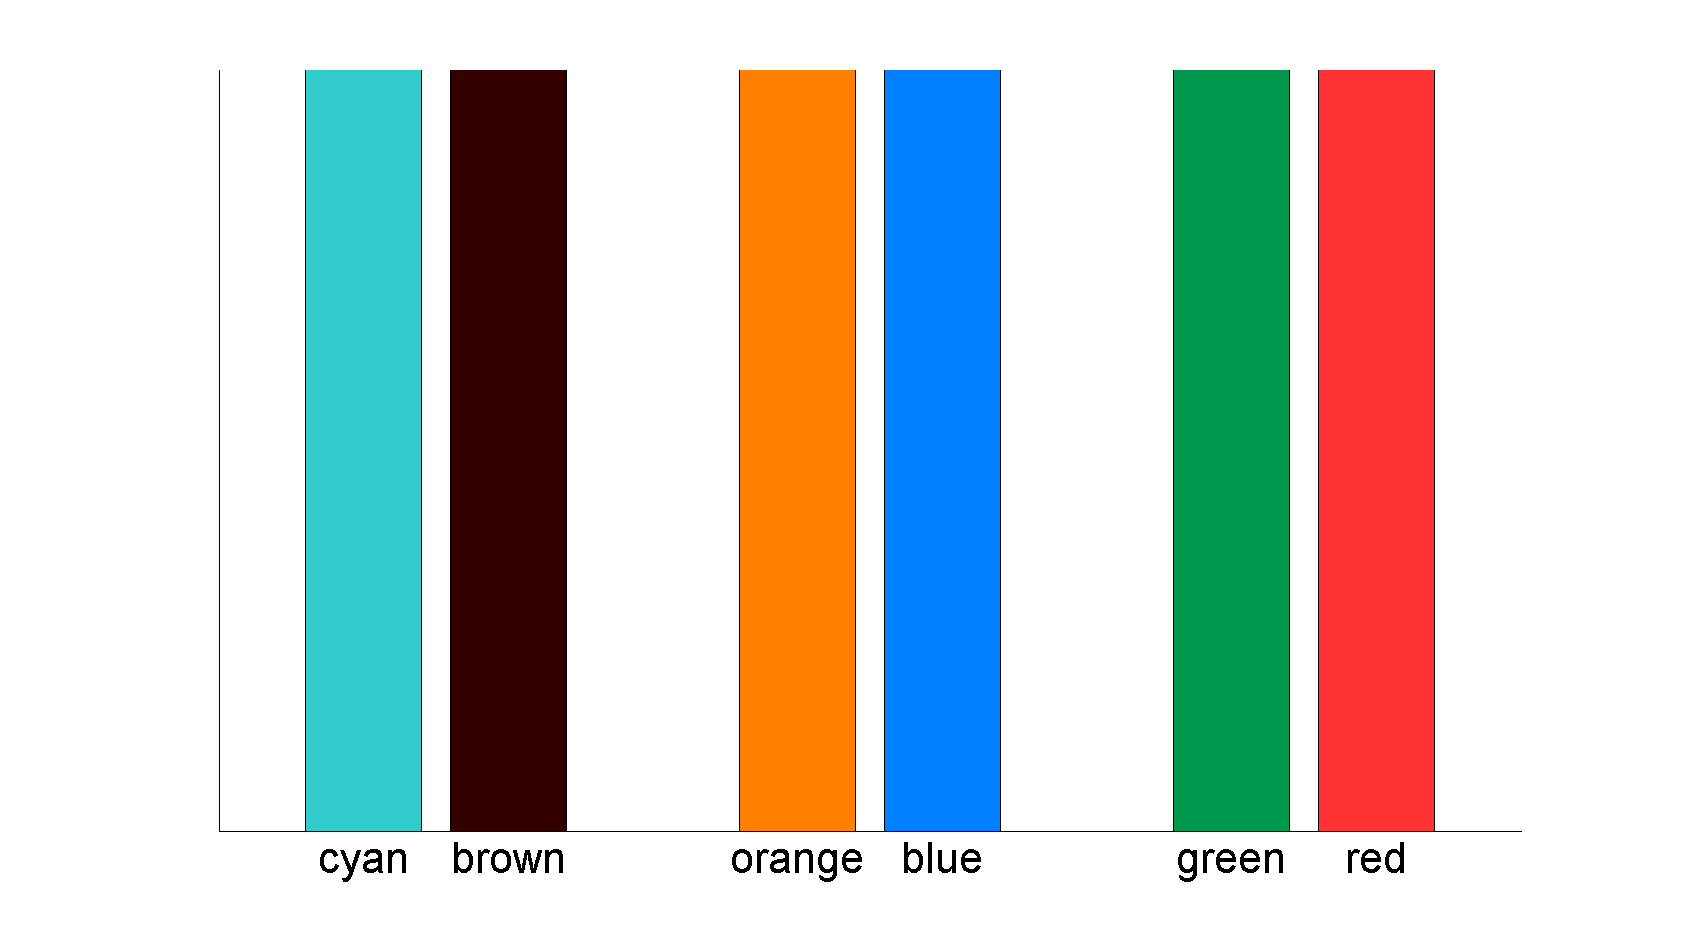 Figure 3: A few colors in Matlab
RGB values can easliy be found on the internet, I personally go there:
http://www.rapidtables.com/web/color/RGB_Color.htm
This website also gives the HSV (Hue, Saturation, and Value) and the hex codes.
The following section gives the codes used to plot the figures in this article. It is not the most efficient code for graphs but it is easy to understand and re-use, I guess? Anyway, enjoy 🙂
%%% Figure 1h = figure(?Color?, [1 1 1]); subplot(1,2,1, ?Parent?, h);b1 = bar(1,1);set(b1, ?FaceColor?, [1 1 1]);title(?White?,?FontSize?, 36)set(gca, ?box?, ?off?, ?xtick?, , ?xticklabel?, ??, ?ytick?, ,?yticklabel?, ?? )subplot(1,2,2, ?Parent?, h);b2 = bar(1,1);set(b2, ?FaceColor?, [0 0 0]);title(?Black?,?FontSize?, 36)set(gca, ?box?, ?off?, ?xtick?, , ?xticklabel?, ??, ?ytick?, ,?yticklabel?, ?? )%%% Figure 2h = figure(?Color?, [1 1 1]);s1 = subplot(2,2,1, ?Parent?, h);b1 = bar(1,1);set(b1, ?FaceColor?, lightGrey1);title(?Light Grey 1?,?FontSize?, 36)set(gca, ?box?, ?off?, ?xtick?, , ?xticklabel?, ??, ?ytick?, ,?yticklabel?, ?? )subplot(2,2,2, ?Parent?, h);b2 = bar(1,1);set(b2, ?FaceColor?, lightGrey2);title(?Light Grey 2?,?FontSize?, 36)set(gca, ?box?, ?off?, ?xtick?, , ?xticklabel?, ??, ?ytick?, ,?yticklabel?, ?? )subplot(2,2,3, ?Parent?, h);b3 = bar(1,1);set(b3, ?FaceColor?, darkGrey1);title(?Dark Grey 1?,?FontSize?, 36)set(gca, ?box?, ?off?, ?xtick?, , ?xticklabel?, ??, ?ytick?, ,?yticklabel?, ?? )subplot(2,2,4, ?Parent?, h);b4 = bar(1,1);set(b4, ?FaceColor?, darkGrey2);title(?Dark Grey 2?,?FontSize?, 36)set(gca, ?box?, ?off?, ?xtick?, , ?xticklabel?, ??, ?ytick?, ,?yticklabel?, ?? )%%% Figure 3h = figure(?Color?, [1 1 1]);b1 = bar(1, 1);hold on;b2 = bar(2, 1);hold on;b3 = bar(4, 1);hold on;b4 = bar(5, 1);hold on;b5 = bar(7, 1);hold on;b6 = bar(8, 1);hold on;set(b1, ?FaceColor?, cyan);set(b2, ?FaceColor?, brown);set(b3, ?FaceColor?, orange);set(b4, ?FaceColor?, blue);set(b5, ?FaceColor?, green);set(b6, ?FaceColor?, red);set(gca, ?box?, ?off?, ?xtick?, [1 2 4 5 7 8], ?ytick?, ,?yticklabel?, ?? );set(gca,?xticklabel?, {?cyan?;?brown?;?orange?;?blue?;?green?;?red?})set(gca,?FontSize?, 32)
Go back to the reference page
