AP (Average precision) is a popular metric in measuring the accuracy of object detectors like Faster R-CNN, SSD, etc. Average precision computes the average precision value for recall value over 0 to 1. It sounds complicated but actually pretty simple as we illustrate it with an example. But before that, we will do a quick recap on precision, recall, and IoU first.
Precision & recall
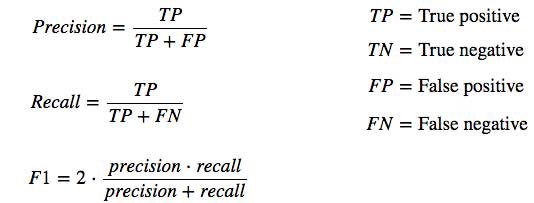
Precision measures how accurate is your predictions. i.e. the percentage of your predictions are correct.
Recall measures how good you find all the positives. For example, we can find 80% of the possible positive cases in our top K predictions.
Here are their mathematical definitions:
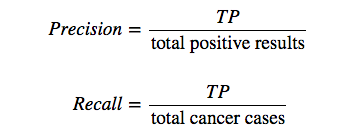
For example, in the testing for cancer:
IoU (Intersection over union)
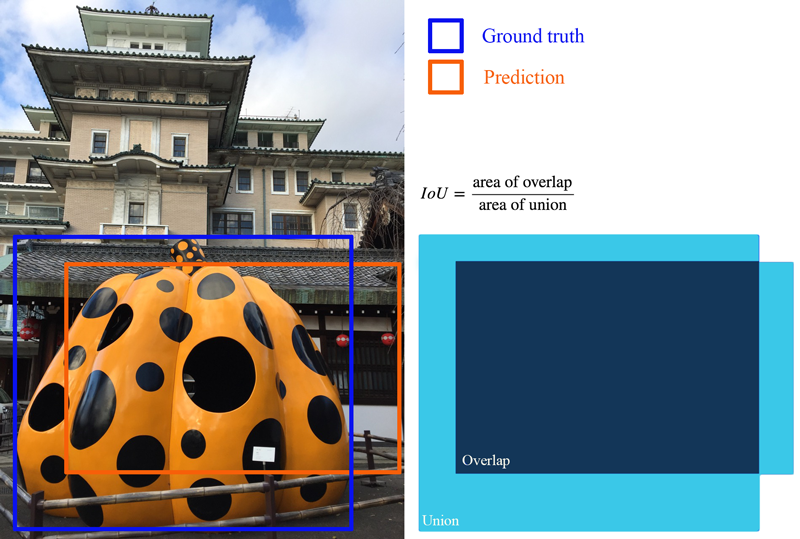
IoU measures the overlap between 2 boundaries. We use that to measure how much our predicted boundary overlaps with the ground truth (the real object boundary). In some datasets, we predefine an IoU threshold (say 0.5) in classifying whether the prediction is a true positive or a false positive.
 IoU definition
AP
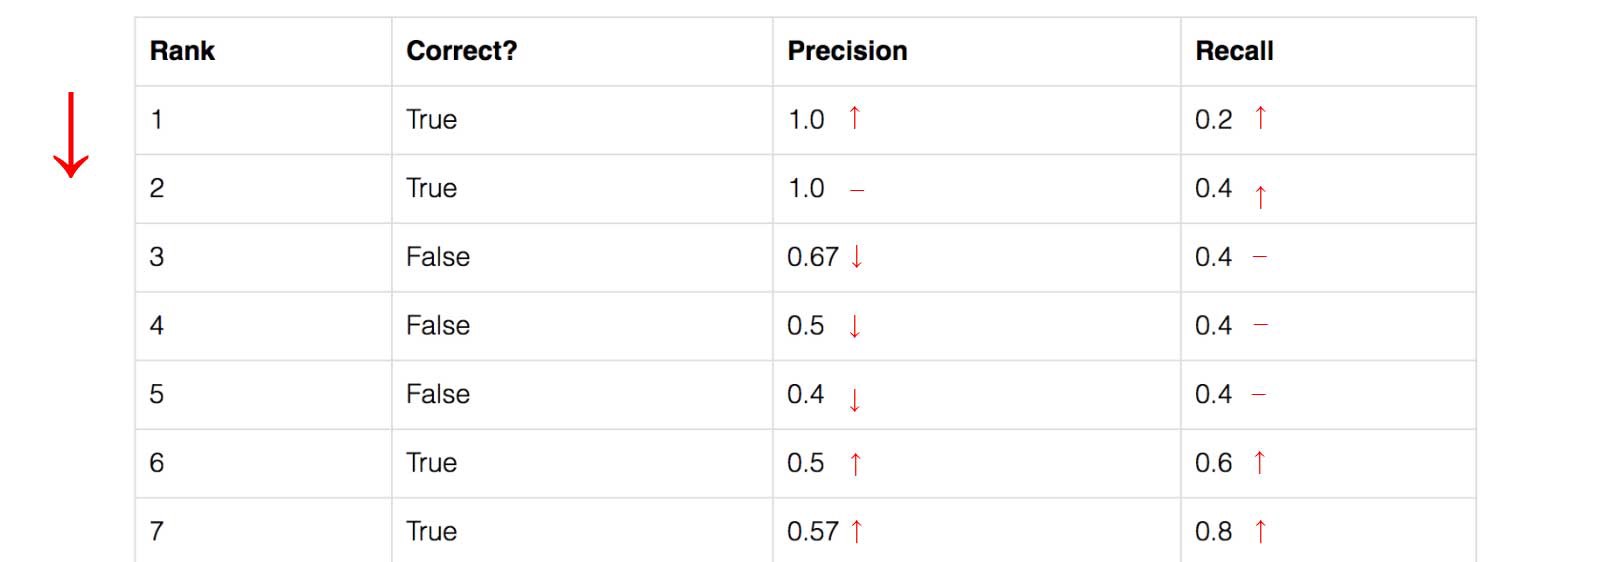
Let?s create an over-simplified example in demonstrating the calculation of the average precision. In this example, the whole dataset contains 5 apples only. We collect all the predictions made for apples in all the images and rank it in descending order according to the predicted confidence level. The second column indicates whether the prediction is correct or not. In this example, the prediction is correct if IoU ? 0.5.
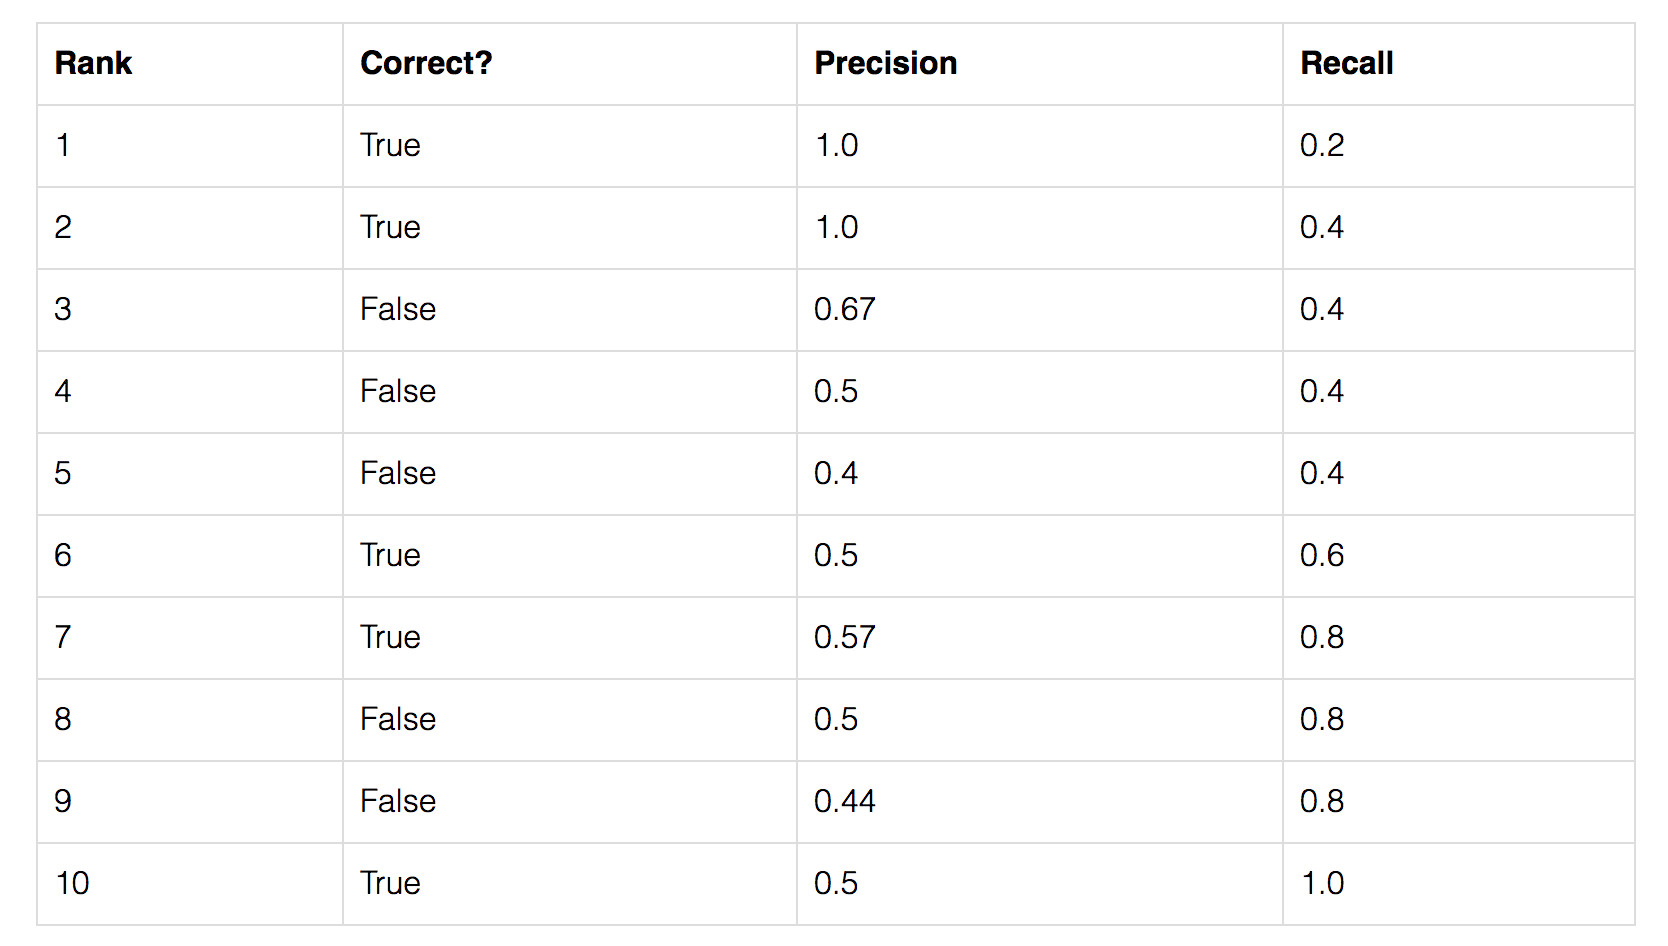
Let?s take the row with rank #3 and demonstrate how precision and recall are calculated first.
Precision is the proportion of TP = 2/3 = 0.67.
Recall is the proportion of TP out of the possible positives = 2/5 = 0.4.
Recall values increase as we go down the prediction ranking. However, precision has a zigzag pattern ? it goes down with false positives and goes up again with true positives.
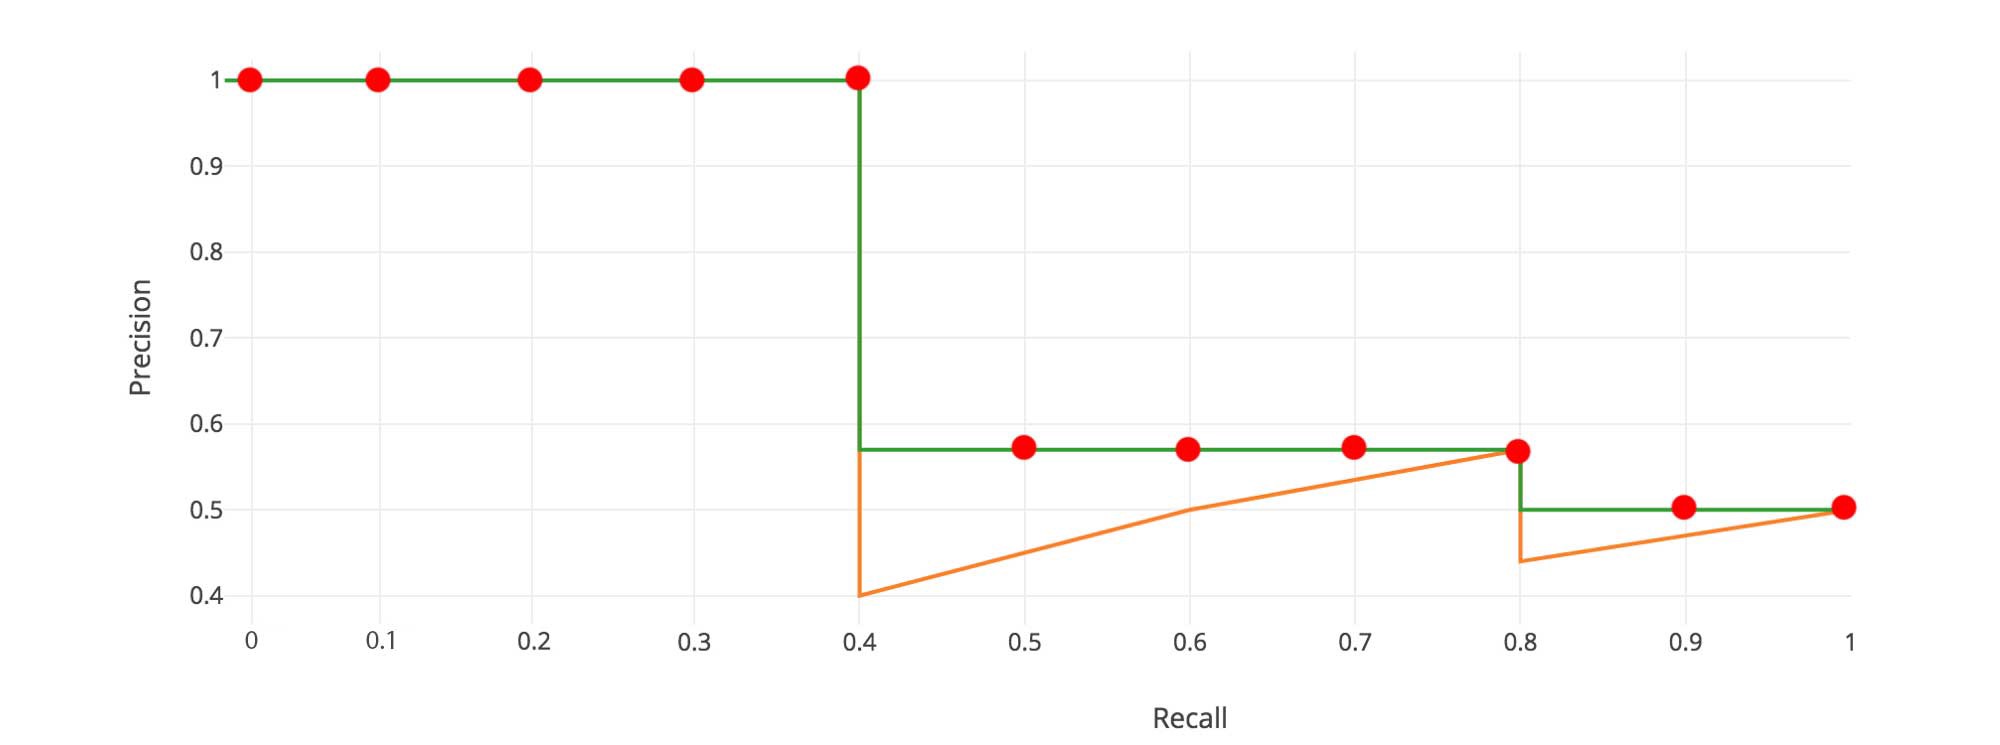
Let?s plot the precision against the recall value to see this zig-zag pattern.
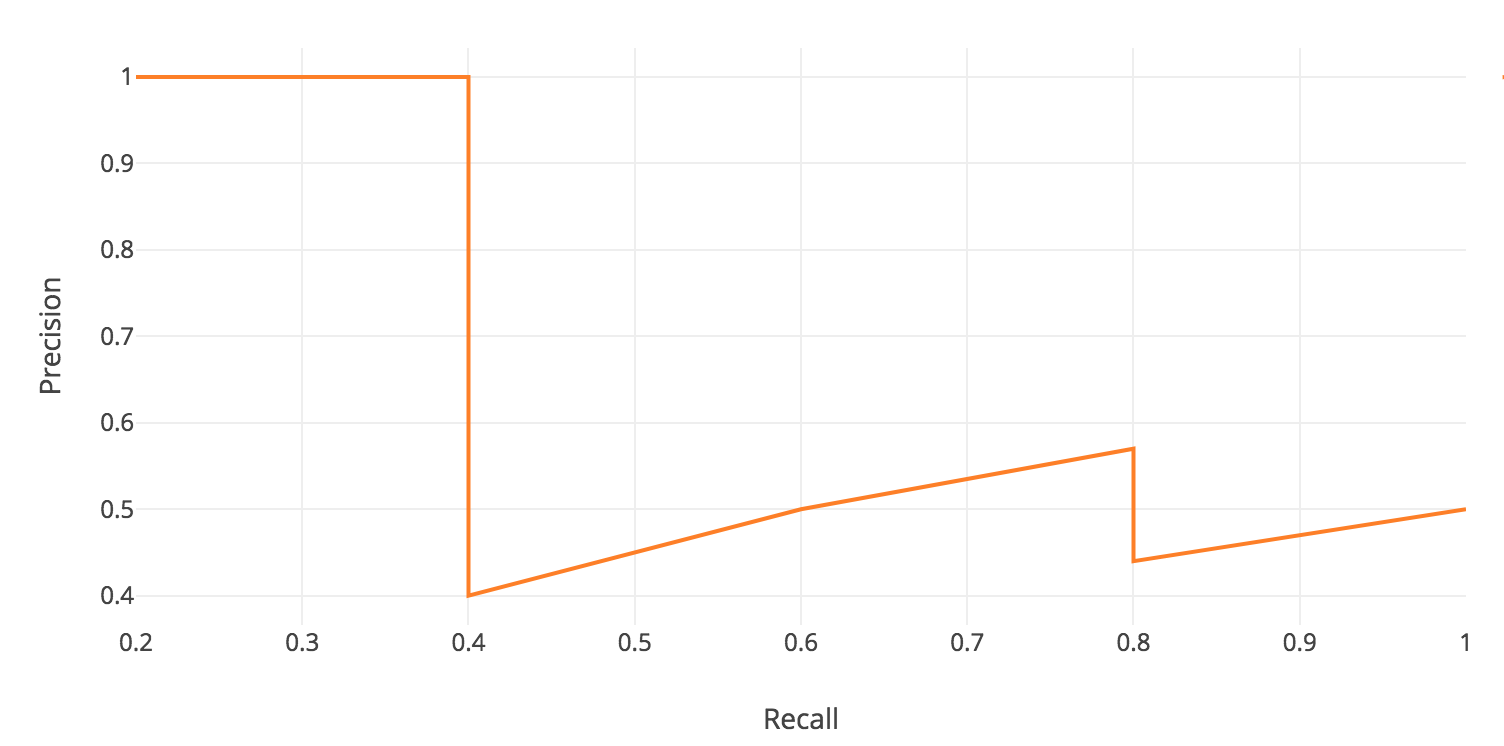 Precision-recall curve
The general definition for the Average Precision (AP) is finding the area under the precision-recall curve above.

Precision and recall are always between 0 and 1. Therefore, AP falls within 0 and 1 also. Before calculating AP for the object detection, we often smooth out the zigzag pattern first.
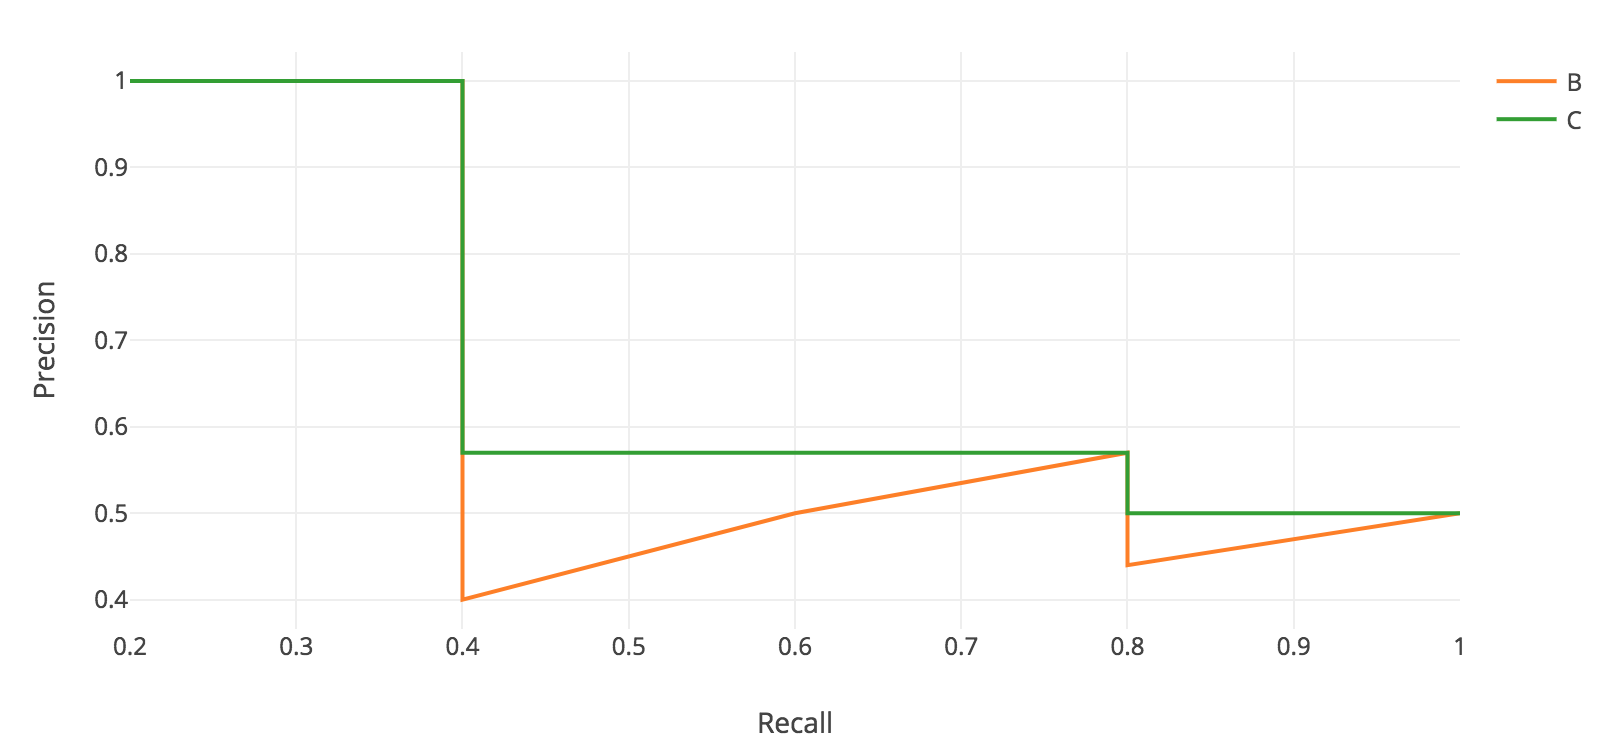
Graphically, at each recall level, we replace each precision value with the maximum precision value to the right of that recall level.
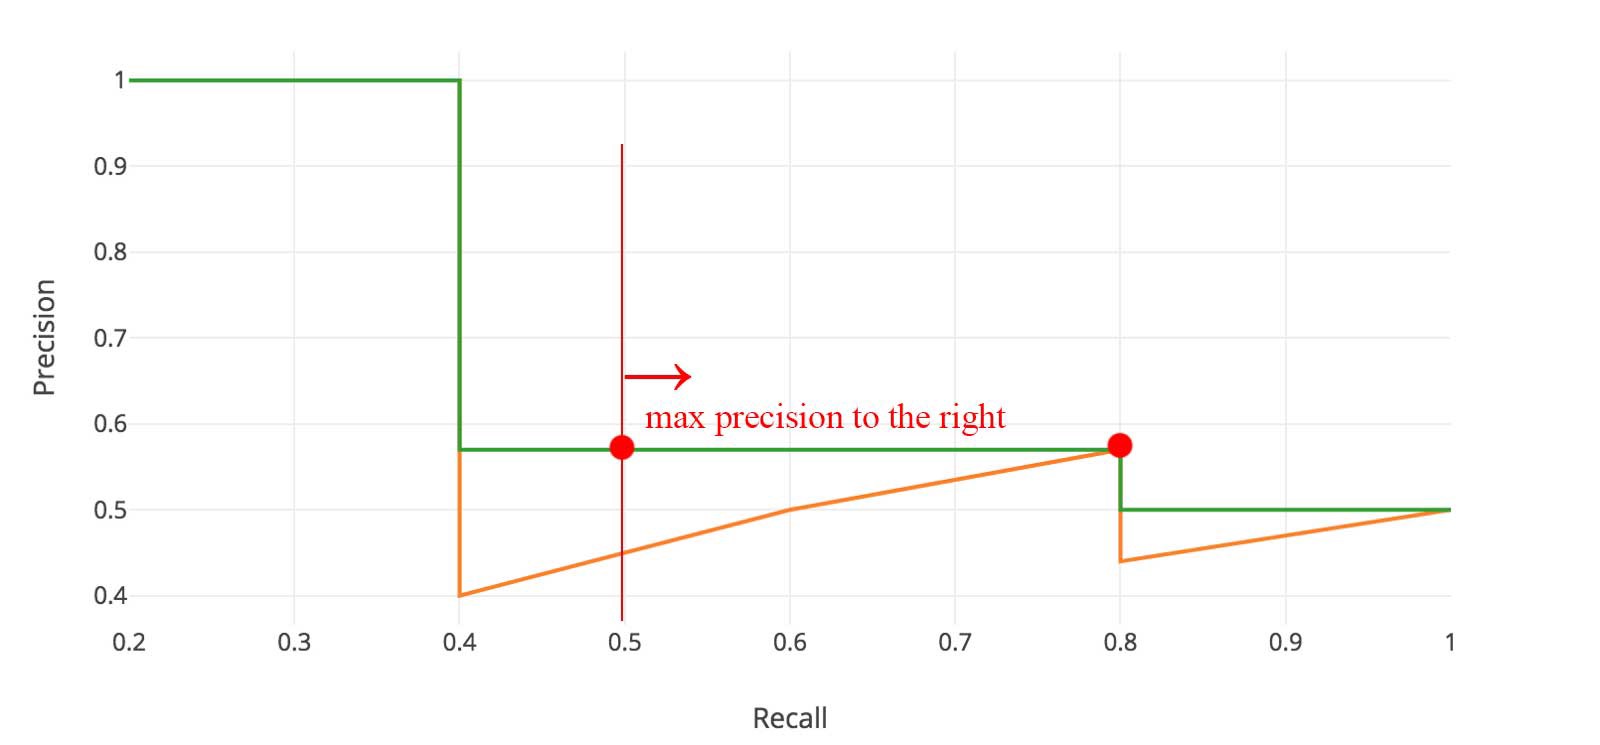
So the orange line is transformed into the green lines and the curve will decrease monotonically instead of the zigzag pattern. The calculated AP value will be less suspectable to small variations in the ranking. Mathematically, we replace the precision value for recall ? with the maximum precision for any recall ? ?.

Interpolated AP
PASCAL VOC is a popular dataset for object detection. For the PASCAL VOC challenge, a prediction is positive if IoU ? 0.5. Also, if multiple detections of the same object are detected, it counts the first one as a positive while the rest as negatives.
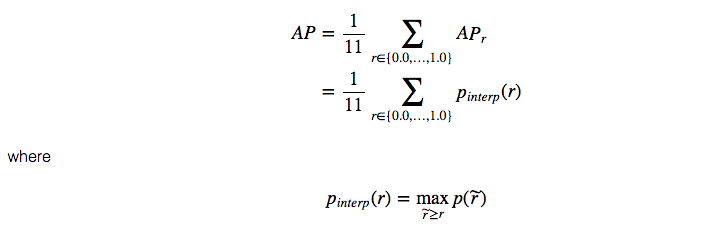
In Pascal VOC2008, an average for the 11-point interpolated AP is calculated.
First, we divide the recall value from 0 to 1.0 into 11 points ? 0, 0.1, 0.2, ?, 0.9 and 1.0. Next, we compute the average of maximum precision value for these 11 recall values.

In our example, AP = (5 1.0 + 4 0.57 + 2 0.5)/11
Here are the more precise mathematical definitions.
When AP? turns extremely small, we can assume the remaining terms to be zero. i.e. we don?t necessarily make predictions until the recall reaches 100%. If the possible maximum precision levels drop to a negligible level, we can stop. For 20 different classes in PASCAL VOC, we compute an AP for every class and also provide an average for those 20 AP results.
According to the original researcher, the intention of using 11 interpolated point in calculating AP is
The intention in interpolating the precision/recall curve in this way is to reduce the impact of the ?wiggles? in the precision/recall curve, caused by small variations in the ranking of examples.
However, this interpolated method is an approximation which suffers two issues. It is less precise. Second, it lost the capability in measuring the difference for methods with low AP. Therefore, a different AP calculation is adopted after 2008 for PASCAL VOC.
AP (Area under curve AUC)
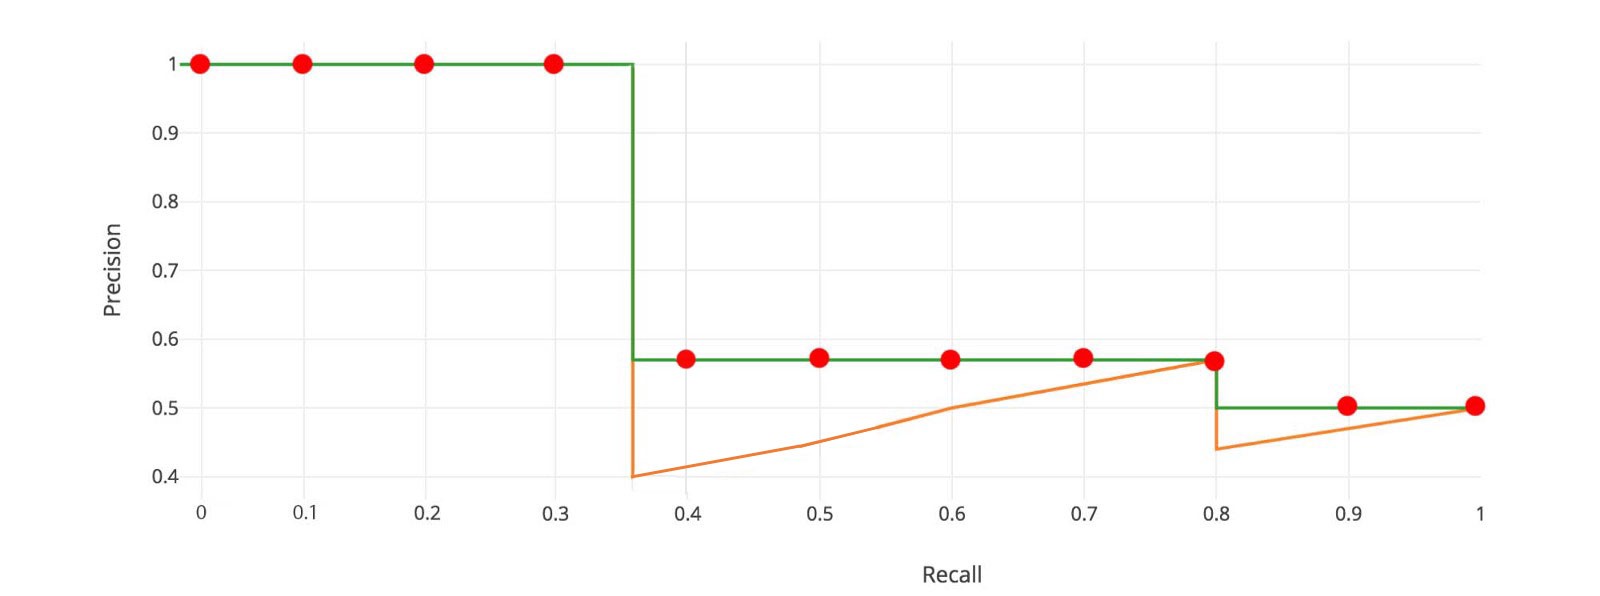
For later Pascal VOC competitions, VOC2010?2012 samples the curve at all unique recall values (r?, r?, ?), whenever the maximum precision value drops. With this change, we are measuring the exact area under the precision-recall curve after the zigzags are removed.
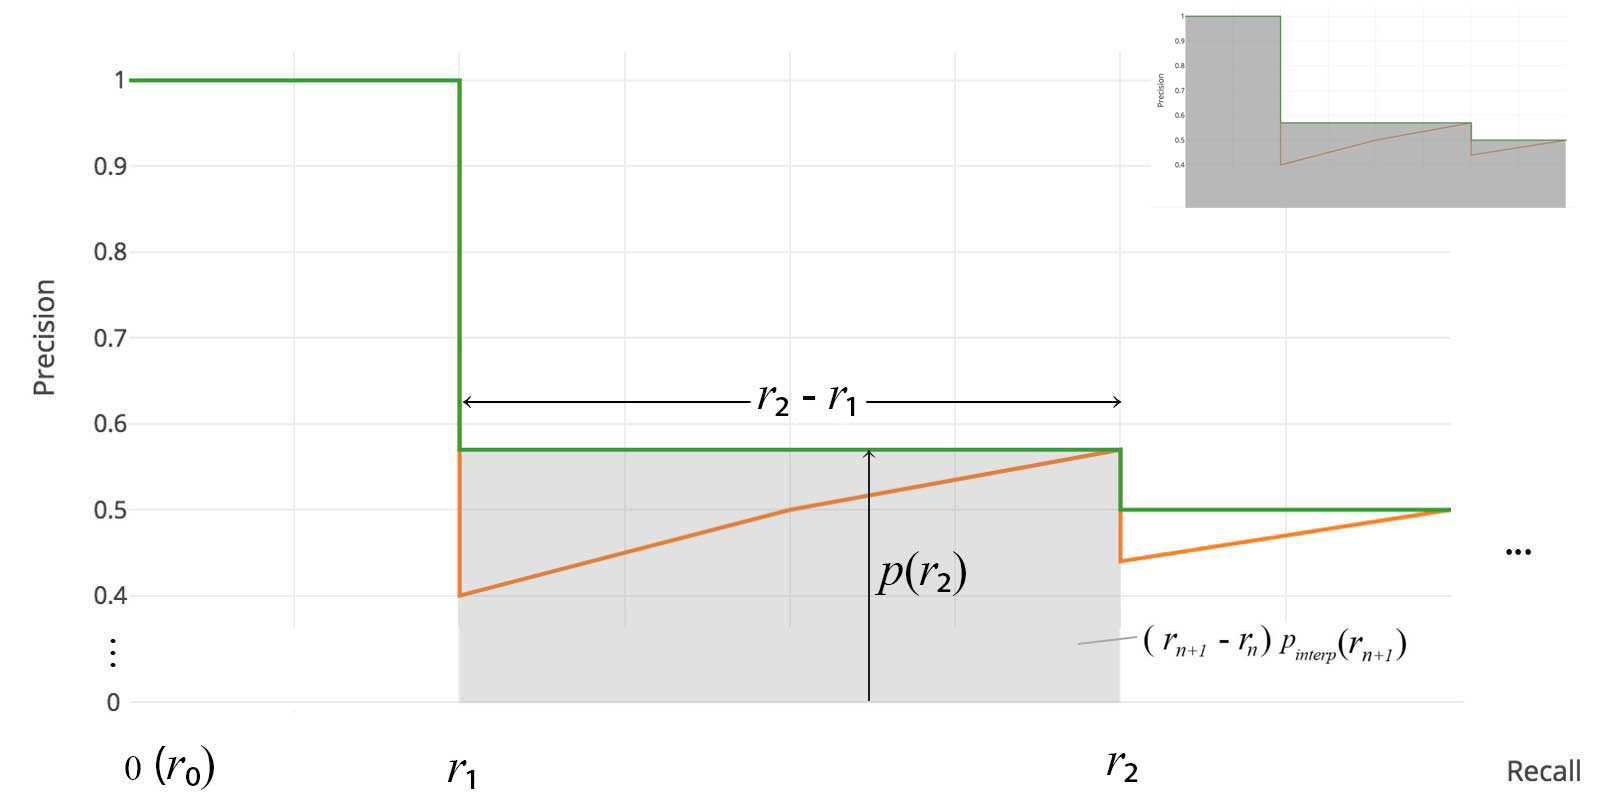
No approximation or interpolation is needed. Instead of sampling 11 points, we sample p(r?) whenever it drops and computes AP as the sum of the rectangular blocks.

This definition is called the Area Under Curve (AUC). As shown below, as the interpolated points do not cover where the precision drops, both methods will diverge.
COCO mAP
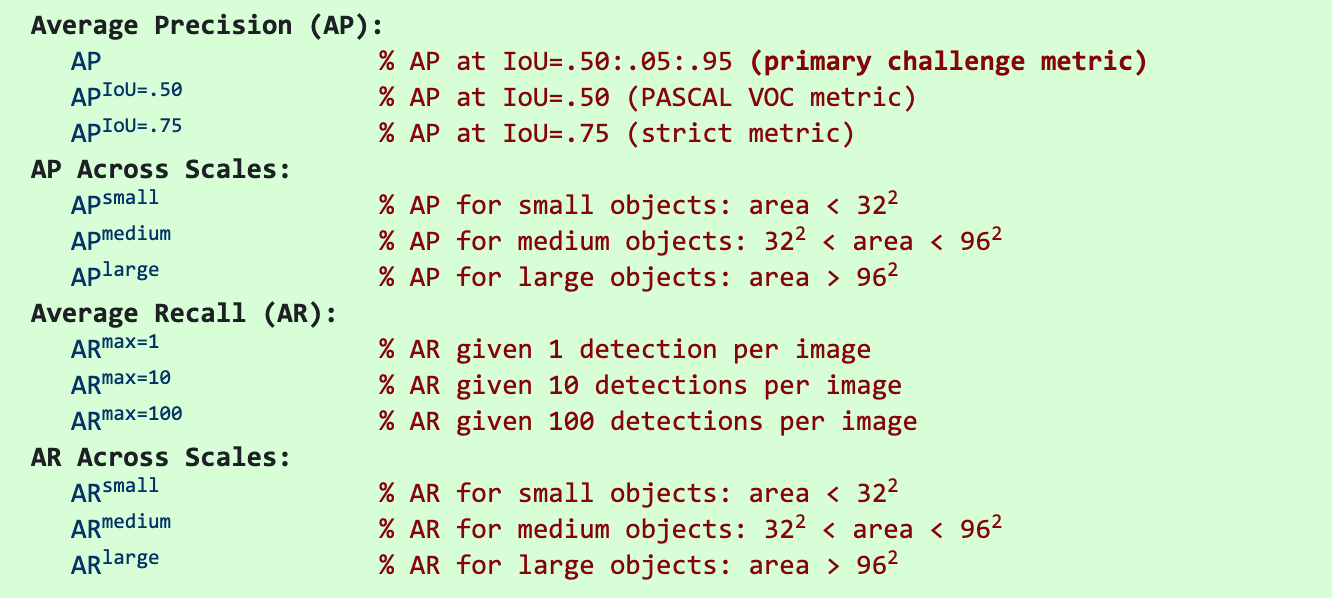
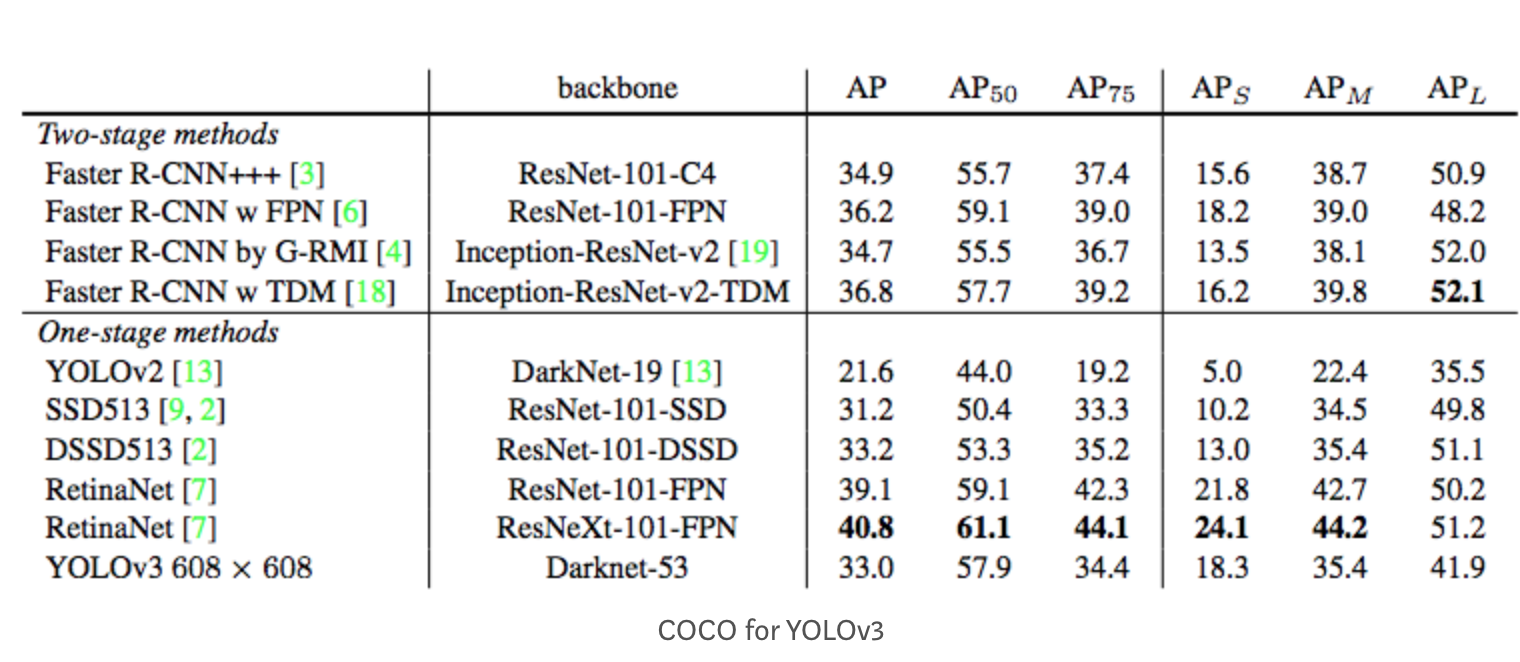
Latest research papers tend to give results for the COCO dataset only. In COCO mAP, a 101-point interpolated AP definition is used in the calculation. For COCO, AP is the average over multiple IoU (the minimum IoU to consider a positive match). AP@[.5:.95] corresponds to the average AP for IoU from 0.5 to 0.95 with a step size of 0.05. For the COCO competition, AP is the average over 10 IoU levels on 80 categories (AP@[.50:.05:.95]: start from 0.5 to 0.95 with a step size of 0.05). The following are some other metrics collected for the COCO dataset.
 Source
And, this is the AP result for the YOLOv3 detector.
 Source
In the figure above, [email protected] means the AP with IoU=0.75.
mAP (mean average precision) is the average of AP. In some context, we compute the AP for each class and average them. But in some context, they mean the same thing. For example, under the COCO context, there is no difference between AP and mAP. Here is the direct quote from COCO:
AP is averaged over all categories. Traditionally, this is called ?mean average precision? (mAP). We make no distinction between AP and mAP (and likewise AR and mAR) and assume the difference is clear from context.
In ImageNet, the AUC method is used. So even all of them follow the same principle in measurement AP, the exact calculation may vary according to the datasets. Fortunately, development kits are available in calculating this metric.
More readings
What do we learn from region based object detectors (Faster R-CNN, R-FCN, FPN)?
In this article, we will take a comprehensive journey on object detection. In Part 1 here, we will cover the region?
medium.com
What do we learn from single shot object detectors (SSD, YOLOv3), FPN & Focal loss (RetinaNet)?
In part 2, we will have a comprehensive review of single shot object detectors including SSD and YOLO (YOLOv2 and?
medium.com
A listing of my articles in deep learning
Includes object detection, self-driving car, meta-learning etc ?
medium.com
Reference
The PASCAL Visual Object Classes Challenge 2012 (VOC2012) Development Kit
scikit-learn precision-recall


 for Object Detection)
 for Object Detection)