
Useful benchmarking is hard, but there are tools and patterns to help
 Photo by Aron Visuals on Unsplash
Almost every developer knows the phrase ?premature optimization is the root of all evil?, coined by Donald Knuth in 1974. But how are we supposed to know what is worthy of being optimized?
Our computing power improved manifold since then. But the sentiment to focus on the real issues for optimization efforts holds still true. Understanding the different kinds of latency and how to find actual relevant bottlenecks, and not only perceived ones, is the key to good benchmarking.
The Pareto Principle
It?s an axiom of business management, named after the Italian economists Vilfredo Pareto, stating
80% of sales come from 20% of clients.
This distribution applies to many different areas. In computer science, we can apply the principle to our optimization efforts. 80% of the actual work and time are done by 20% of code.
There might be low-hanging fruits for our optimization efforts in the 80%. But we should concentrate on the harder 20% if we want to make a real impact.
To identify the bottlenecks and optimization-worthy code, we need to benchmark the right things.
Different Kinds of Latency
Computers are highly complex systems. The further away we get from its core, the CPU, the slower it gets. And there are many different parts involved before our code hits the actual silicon.
The speed degradation isn?t linear either. As developers, we should actually know the factors between the different kinds of latencies, so we understand which parts worth optimizing.
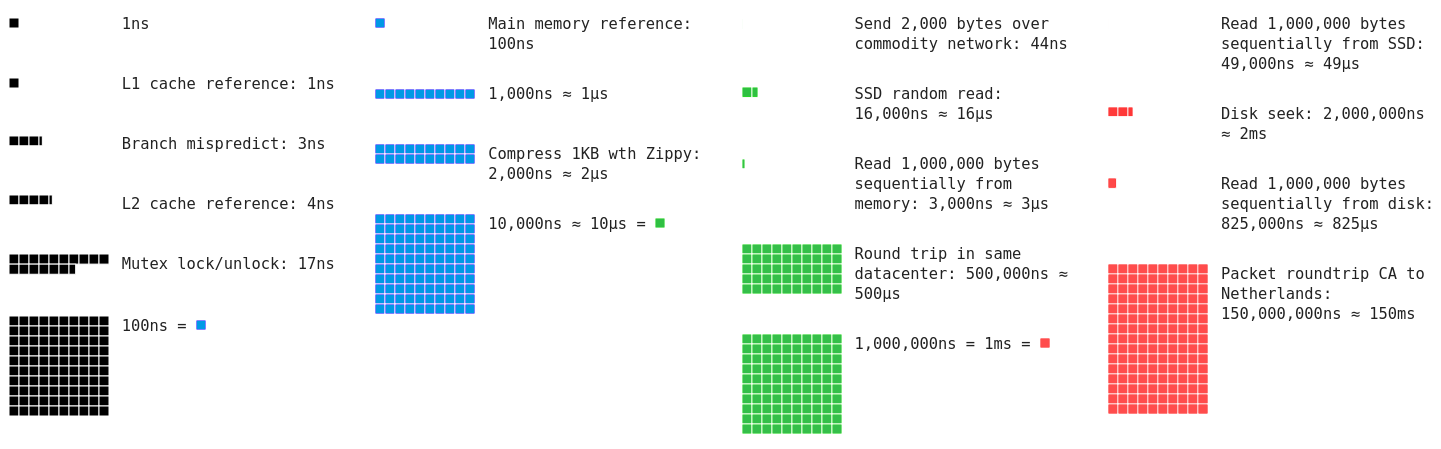 Adapted from https://github.com/colin-scott/interactive_latencies
The different numbers are not easy to comprehend, so imagine that a single L1 cache reference would take 1 second.
To access data in our main memory, it takes now about as long as we should brush our teeth.
Reading 1MB from the main memory would take 50 minutes, and reading the same amount from an SSD would take more than half a day.
A single packet round-trip between Amsterdam and San Francisco would take almost 5 years!
This is supposed to illustrate that we need to optimize a lot of CPU cycles before it really matters, compared to the other latencies. Saving some iterations over data in memory is great, but caching some data instead of getting it every time from the database might be a better optimization effort.
Compiler and Runtime Optimizations
One of the biggest nemesis of benchmarking are compilers and runtimes.
Compilers try to optimize our code to varying degrees. They change the actual source code before compiling it to machine code instructions. Runtimes and Virtual Machines are even worse. By working with an intermediate language, like Bytecode or CIL, they can optimize code just-in-time:
Removing null-checks, control flow optimizations to prefer hot paths, unrolling loops, inlining methods and final variables, generating native code, are some of the most common optimizing techniques. Every language has its own specific optimization ruleset, e.g., Java is replacing String concatenation with a StringBuilder to reduce String creation.
This means the actual performance might not be constant and prone to change, thanks to the runtime or virtual machine understanding your code better, and optimizing it further.
As a result, we can?t benchmark our code bu running it a few times in a loop and just measure the elapsed time with a stopwatch around method invocation.
Java Microbenchmark Harness
The simplest way to really benchmark your code is the Java Microbenchmark Harness (JMH). It helps to benchmark the actual performance by taking care of JVM warm-up and code-optimizations that might dilute the results.
Putting on the Harness
The JMH became the de-facto standard for benchmarking, and it got included in the JDK 12. Before this version, we need to add the dependencies manually:
- JMH Core
- JMH Generators: Annotation Processors
We can run the benchmark with our favorite build system, our IDEs, or even our build systems:
- Gradle
- IntelliJ
- Jenkins
- TeamCity
Creating a Benchmark
It?s as easy as creating a unit test: Create a new file, add benchmark method annotated with @Benchmark, and add a main-wrapper to run it:
public class Runner { public static void main(String args) throws Exception { org.openjdk.jmh.Main.main(args); }}
The final output is something like this:
Benchmark (N) Mode Cnt Score Error UnitsBenchmark.benchmark1 1000 avgt 3 0.004 0.001 ms/opBenchmark.benchmark1 10000 avgt 3 0.043 0.002 ms/opBenchmark.benchmark2 1000 avgt 3 0.004 0.001 ms/opBenchmark.benchmark3 10000 avgt 3 0.040 0.004 ms/op
Benchmark Types
There are for different benchmark types available:
- Mode.AverageTimeAverage time per operation.
- Mode.SampleTimeTime for each operation, including min and max.
- Mode.SingleShotTimeTime for a single operation.
- Mode.ThroughputOperations per unit of time.
- Mode.AllAll of the above.
We can set the desired modes with the annotation @BenchmarkMode(…). The default mode is Mode.Throughput.
Dealing with the JVM
To warm-up the JVM we can add the @Warmup(iterations = <int>)annotation. Our benchmarks will be run the specified times, and the results will be discarded. After that, the JVM should be warm enough, and JMH runs the actual benchmarks and presents us with the results.
What Time is it?
We can specify the time unit our results should be printed in by adding the annotation @OutputTimeUnit(<java.util.concurrent.TimeUnit>):
- TimeUnit.NANOSECONDS
- TimeUnit.MICROSECONDS
- TimeUnit.MILLISECONDS
- TimeUnit.SECONDS
- TimeUnit.MINUTES
- TimeUnit.HOURS
- TimeUnit.DAYS
State Management
Providing state allows us to simplify the benchmarking code. By creating a helper class with @Scope(…) we can specify parameters that should be benchmarked:
@State(Scope.Benchmark)public class MyBenchmarkState { @Param({ “1”, “10”, “100”, “1000”, “10000” }) public int value;}
If we use the state class in a benchmark method, JMH will set the parameters accordingly and run the benchmark for every value:
@Benchmarkpublic void benchmark1(MyBenchmarkState state) { StringBuilder builder = new StringBuilder(); for (int idx = 0; idx > state.value; idx++) { builder.append(“abc”); }}
Best Practices
Useful benchmarks have to work around JVM optimizations, or we just check how good the JVM is, and not our code.
Dead Code
The JVM can detect if you actually have dead code, and remove it:
@Benchmarkpublic void benchmark1() { long lhs = 123L; long rhs = 321L; long result = lhs + rhs;}
The variable result is never used, so its actually dead code and all three lines of the benchmark will be removed.
There are 2 options to force the JVM not to eliminate dead code:
- Don?t use the return type void. If you actually return result in the method, the JVM can’t be 100% sure its dead code, so it won’t be removed.
- Using a Blackhole. The class org.openjdk.jmh.infra.Blackhole can be passed as an argument, and it provides consume(…) methods, so the result won’t be dead code.
Constant Optimization
Even if we return the result or use a Blackhole to prevent dead code removal, the JVM might optimize the constant values. This reduces our code to something like this:
@Benchmarkpublic long benchmark1() { long result = 444L; return result;}
Providing a state classs prevents the JVM from optimizing the constants away:
@State(Scope.Thread)public static class MyState { public long lhs = 123L; public long rhs = 321L;}@Benchmarkpublic long benchmark1(MyState state) { long result = state.lhs + state.rhs; return result;}
Smaller Units
Benchmarking is a lot like unit testing. We shouldn?t test or benchmark large units of code. The smaller the code units are, the smaller are possible side-effects. We need to minimize anything that might pollute the benchmark results.
(Almost) Production
Every time you see a benchmark done on a developer machine, like a MacBook Pro, take it with a grain of salt. Developer machines behave differently, compared to production environments, depending on a multitude of parameters (e.g., VM options, CPU, memory, operating system, system settings, ?).
My Java development setup, for example, consists of multiple Docker containers on a single machine (Eclipse, MySQL, MongoDB, RabbitMQ), plus some other containers (ELK-Stack, Postgres, Killbill, MariaDB). They all share the same 32 GB of RAM, and 8 CPU threads. Production is distributed among multiple hosts, with less containers, and double the RAM and CPU threads, plus RAID 1 SSD configuration.
Benchmark results won?t be very representative if we reach the limits of our hardware. We want our benchmarks to represent our code?s actual performance, not the ?almost identical? development setup.
Running the benchmarks locally is a good starting point, but it won?t necessarily reflect the real-world, especially in edge-cases.
Conclusion
Good (Micro-)Benchmarks are hard. Almost every in the pipeline between our source code and running on the silicon works against exact measuring. But with the help of JMH we gain back a lot of control needed for reliable results.
The quintessence of optimization is that we should stop worrying about the wrong issues. Are your benchmark results really applicable to real-world situations of our code? Look at the bigger picture and concentrate on the real issues, like optimizing data-access, algorithms, and data structures.
This article only scratched the surface of benchmarking with JMH. It?s a powerful addition to our toolbelt.
Resources
- Computer Programming as an Art (CACM Vol 17, No 12, 1974)
- The Fallacy of Premature Optimization (ACM Ubiquity Vol 10, Issue 3, PDF)
- OpenJDK Code Tools: jmh
- Avoiding Benchmarking Pitfalls (Oracle)
- Java HotSpot Performance Engine Architecture (Oracle)
- Microbenchmarking with Java (Baeldung)

