
Here?s what to watch out for?

I was compelled to write this article when my father sent me the book Inconvenient Facts ? The Science that Al Gore Doesn?t Want You to Know by Gregory Wrightstone. He said it contained compelling arguments for why climate change is not really a problem and, in fact, demonstrates that we are being misled by a liberal agenda to scare the world into fighting a false threat. My father has an MBA from Harvard, an engineering degree from Cornell, and has been CEO of half a dozen companies. He?s smart, accomplished, and well-read. He?s also an open-minded man willing to adjust his own opinions in light of new information he encounters. Prior to reading this book, he believed that climate change was real, man-made, and required urgent attention. He and I even started a solar company together, both of us motivated by the desire to help address climate change.
My initial response to my father?s assertions about the book was surprise that he would question the truth about climate change. But then, as I thought about it, I became excited that maybe it could be true, and the world is, in fact, not heading toward climate disaster. I have a lot of fears about what we are doing to our world, and I hoped that Wrightstone was actually right. Maybe he had written the most important expose in modern times. Wouldn?t that be wonderful for us all? So, I read the book.
Wrightstone?s book has two basic messages: 1) climate change is happening, but it?s not human-caused so there?s no point in modifying our behavior; and 2) global warming is, in fact, a good thing because historically human societies perform better in warmer climates, crops grow better with more CO2, and because it will help counter the next ice age. The back cover reads, ?The book?s 60 ?inconvenient facts? come from government sources, peer-reviewed literature or scholarly works, set forth in a way that is lucid and entertaining. The information likely will challenge your current understanding of many apocalyptic predictions about our ever-dynamic climate? (see: Wrightstone, 2017 in references at bottom).
I was compelled, as I read the book, to check his claims and interpretations of his sources. I pulled up the same raw data sets and scientific articles he cites. What I found was a fascinating and tragic window into the world of climate denial.
Inconvenient Facts claims, over and over, to be based in science and emphasizes the importance of the scientific method; however, the author does not, himself, use the scientific method in his own analysis. There are no references to any peer-reviewed journal articles by Wrightstone himself. Many of his ?inconvenient facts? are non-controversial statements. In fact, most of them are actually true. It?s the conclusions that he draws from the ?facts? that are not supported by peer-reviewed journal papers ? they?re just his own misleading opinions.
I emphasize the importance of scientific articles being peer-reviewed because this is a key part of what upholds the validity of science. An author can?t get away with making outrageous or false claims because the scientific journals won?t publish it unless a random selection of scientists from the same field agree that it is valid science. Wrightstone does include some peer-reviewed references, but they are either just references to raw data that is non-controversial, to outdated reports, or to papers that he misrepresents. On the flip side, by including these references, he is giving the appearance of legitimacy to his readers. When there are references supporting his extreme claims, they are to other non-scientific, non-peer-reviewed publications. Many of his assertions are the same we hear repeatedly from other climate deniers.
Wrightstone does ask some important and interesting questions in his book: Are the recent high levels of CO2 anomalous when we look back over the history of the earth? Are rising temperatures correlated with rising CO2 levels in the atmosphere? Is global warming actually a problem for the world? These are all important questions to ask, and legitimate climate scientists have asked them for years. Their findings are backed by data and are subject to the scrupulous peer-review scientific process.
Wrightstone, however, employs no such rigorous methods. He cherry-picks data and leaps to conclusions that are not supported by legitimate science. In fact, almost every page of his book includes incorrect or misleading interpretations of data or science.
Almost every page of his book includes incorrect or misleading interpretations of data or science.
The book is organized around his 60 ?Inconvenient Facts,? many of which are actually true. But he uses them to support seven basic high-level myths. Wrightstone?s approach is to state a number of the ?facts? that relate to a myth that he is trying to promote. He then makes illogical or inappropriate leaps in his logic to reach his mythical conclusions.
The myths appear to be supported by the ?facts? when in reality he is tricking the reader with his sleight-of-hand logic. It?s just like the magician who gains the trust of his audience by showing how meticulously he shuffles the deck or how there is nothing in his hands; then, at the last minute he makes a slight unnoticed movement that slips in a new card or picks up two cards instead of one.
Wrightstone presents a number of true facts to build credibility and trust on a topic, and then from those true facts deduces an incorrect conclusion. The casual reader can easily overlook the misdirection. Climate science is complicated, and most readers are not equipped with the background or the time to investigate claims that, when written with authority, sound truthful. Most assume that if there are a handful of obviously true underlying statements, a reference to some book, article, or scholarly paper, and some logic to the argument, then the claim is valid. This opens-up the opportunity for readers to be misled and for those who hope that climate change is not as bad as it sounds to find support for their hopeful thinking.
Climate science is complicated, and most readers are not equipped with the background or the time to investigate claims that, when written with authority, sound truthful.
The tactics and the myths in Inconvenient Facts are common to most climate deniers. In the remainder of this article I will address each of these myths. My analysis is based on peer-reviewed climate science journal articles with references in-line and listed at the end of this article.
Myth 1 ? Since the history of the earth includes periods of significantly higher CO2 and temperature, we shouldn?t worry.
About 25% of Wrightstone?s ?inconvenient facts? use a line of argument that compares modern levels of CO2, temperature, and ocean acidity to the historically high levels on geological time-scales. He argues that if levels were higher many years ago before humans existed or before the industrial revolution, then humans are not the cause of modern high levels, so there?s nothing we can do about it, and we shouldn?t worry because it?s all happened before.
Wrightstone states ?The 40% increase [in CO2 levels], from 280 ppm in 1750 to 406 ppm in 2017, is widely recognized to be mainly man-made? (see: Wrightstone, 2017). This is a great start. The question he poses is whether this is abnormal or a problem. His primary approach is to compare the increases in CO2 of the last 100 years to CO2 levels over the past 400 thousand, 140 million, and 600 million years. It is true that on those time scales CO2 levels have been all over the map, and recent levels don?t appear out of the ordinary. There were times when CO2 levels were very low (182 ppm during the last ice age), and times when they were very high (2,600 ppm on average in the preceding 600 million years). Wrightstone notes:
It should be obvious to the impartial observers of the long-term data that, rather than experiencing excessively high levels of carbon dioxide, we are in fact in a period of CO2 starvation. While short historical periods are used to support apocalyptic visions of life in a world with slightly increased CO2, perspective is everything: the increase of ~120 ppm since the beginning of the Industrial Revolution is barely recognizable when viewed in the context of a longer section of the Earth?s CO2 history. (see: Wrightstone, 2017)
The image below from Wrightstone?s book, shows dramatically higher CO2 levels compared to today going back 140 million years.
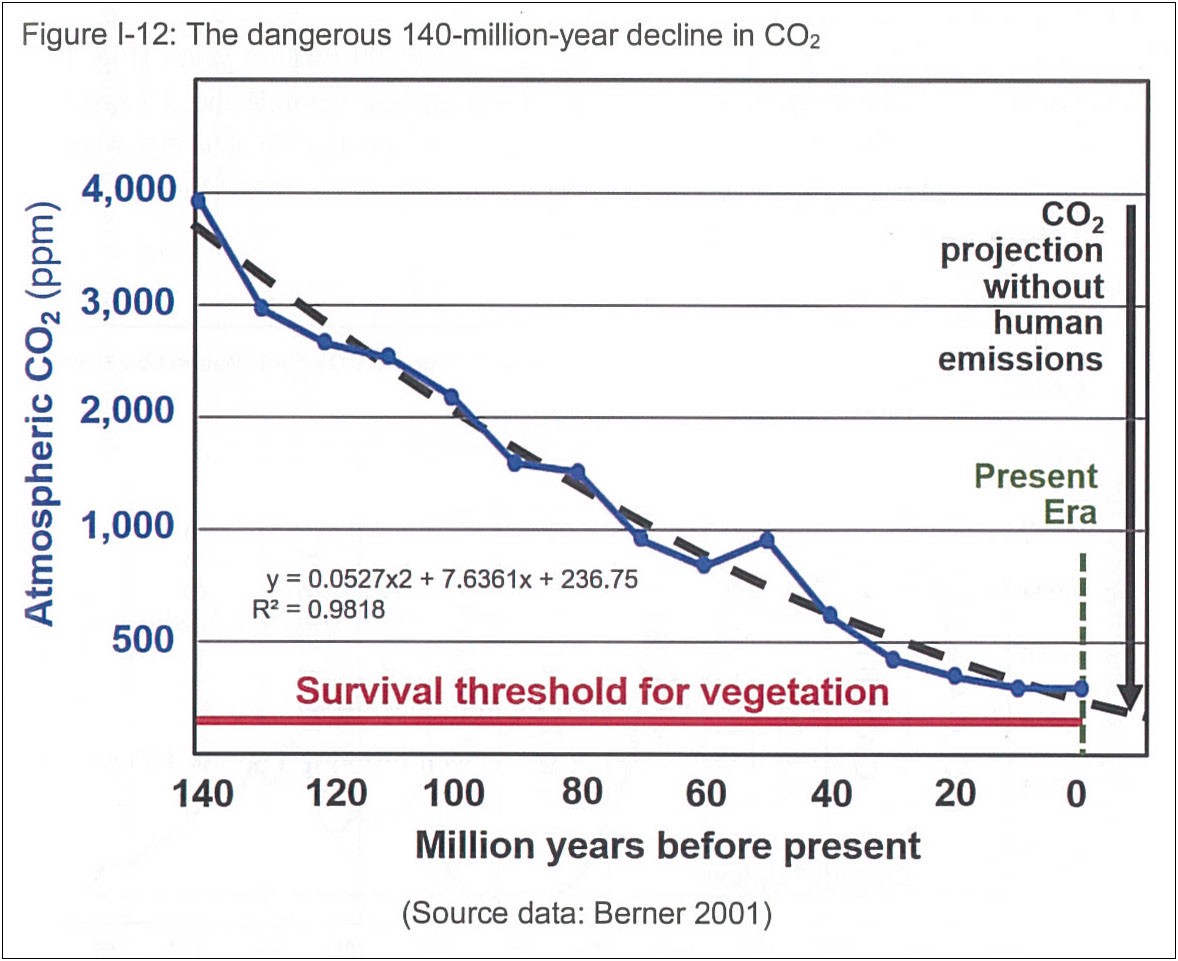 Image from: (Wrightstone, 2017)
This is indeed a startling image?until you realize that the first homo sapiens arrived only 200,000 years ago. Back then, it was a much different world than today ? and 200,000 years ago isn?t even visible on the time scale of this chart. The last 200,000 years on this chart are completely hidden by the ?0? on the far right of the time axis. Importantly, the fact that CO2 levels were higher millions of years ago is irrelevant to whether people living today will be negatively impacted by recent high levels, as we will see later.
Moving from geological time-scale charts of CO2 to geological time-scale charts of temperatures, Wrightstone shows average global temperatures since the earth was formed 4,600 million years ago (see the image from Inconvenient Facts below).
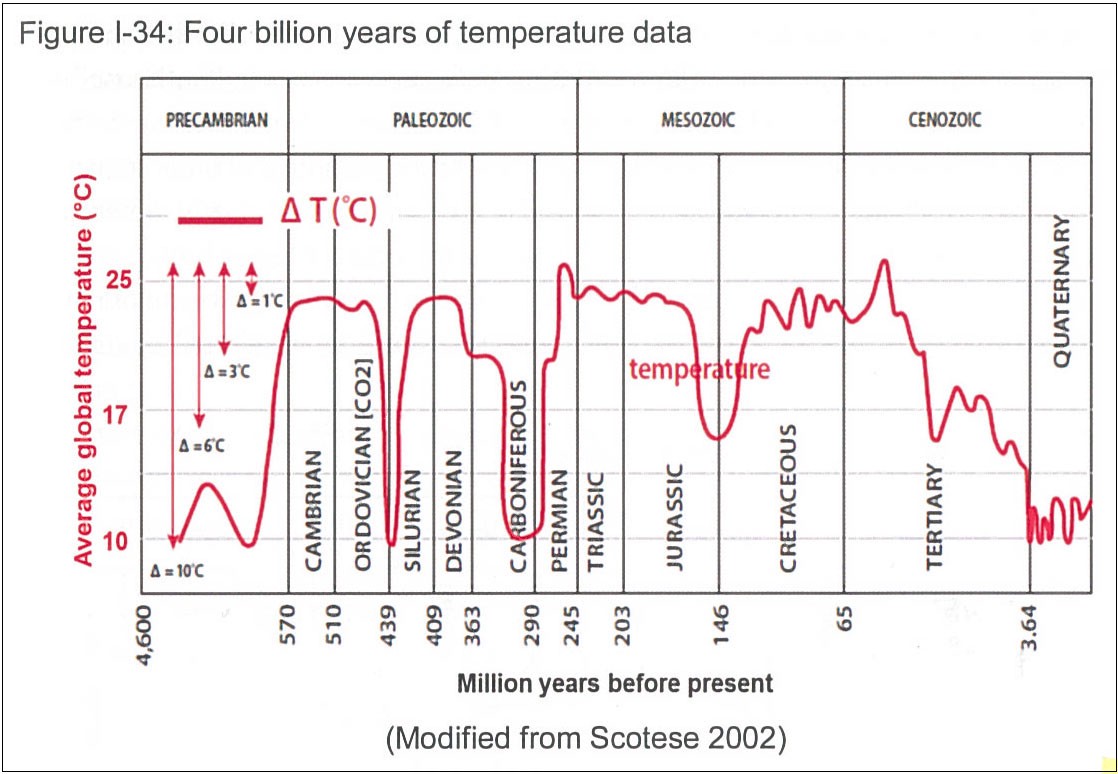 Image from (Wrightstone, 2017)
He points out that ?we are living in one of the coldest periods in all of earth?s history?for most of earth?s history, it was about 10 deg. C (18 deg. F) warmer than today? (see: Wrightstone, 2017). These statements are true, but the fact that it was significantly warmer before mammals existed on earth is irrelevant to whether global warming is or is not detrimental for our modern civilization.
Wrightstone ignores this point over-and-over again throughout his book.
Wrightstone goes on to show charts of historical temperatures spanning the past four ice ages. He notes that the temperatures in between past ice ages were hotter than our current temperatures ? so, no need to worry, this has all happened before. Let?s take the period before the last ice age, 120,000 years ago. It?s true that average global temperatures were warmer than today (by about 1 deg. C)?but sea level was also five meters higher than today! Imagine what five meters (16 feet) of sea level rise would do to New York, San Francisco, Hong Kong, London, etc. Wrightstone completely ignores the effect that higher temperatures (and CO2) levels have on sea level rise and the modern world when hundreds of millions of people live near oceans. Five meters just wasn?t a concern 120,000 years ago.
In order to determine whether rising CO2 and temperature levels matter in our modern times, we must first consider the consequences of global warming. These consequences are widely understood to include rising sea levels, more extreme heat waves and weather, changes in precipitation causing flooding in some regions and droughts and fires in others, reduced crop yields, ocean acidification, and more rapid extinction of diverse species (IPCC Impacts part A, 2014).
In the past, when CO2 levels rose higher than they are today, it often happened over millions of years and the various forms of life on earth were able to evolve and adapt. But there were a number of times when CO2 levels and temperatures rose as quickly as they have risen in the last 100 years. These changes had profound consequences leading to mass extinctions. For example, 252 million years ago there was a rapid rise in CO2 due to a series of volcano eruptions, and global temperatures rose 11 deg. C wiping out 95% of all species on earth. Luckily, we are not likely to see 11 deg. C rise again any time soon.
Interestingly, one of the biggest impacts of global warming is sea level rise, a consequence that actually didn?t matter as much in the past as it does now. Pre-historic plants, apes, and homo sapiens of the time could usually adapt when sea levels rose ? they just moved their habitats inland over time. However, the massive cities we?ve built on the shorelines of the world?s oceans won?t be able to adapt to rising sea levels without massive displacement of people and huge costs. It is estimated that population displacement due to climate change will be 200 million to 1 billion people by 2050 and sea level rise of one meter will cost a trillion dollars in lost GDP. Our fragile modern way of life will see major disruptions with climate change. We are highly dependent on the region-specific farming system we have built to feed the over-sized world population. Even a 10% reduction in the output efficiency of this system would be catastrophic.
This reduction is not likely to lead to the extinction of humans, it?s just that the world will be a miserable place to be with trillions of dollars of adaption costs, resource wars, and disease. The key point here is that the fact that CO2 or temperature levels were higher than today during the times before apes or flowering plants existed on earth is irrelevant to the question of whether we want, or should allow, high CO2 levels in modern times.
The fact that CO2 or temperature levels were higher than today during the times before apes or flowering plants existed on earth is irrelevant to the question of whether we want, or should allow, high CO2 levels in modern times.
Here we see one of the tools of climate deniers: twisting logic or omitting information in a way that makes it sound like it?s the climate change realists who are misleading the public. We saw this in Wrightstone?s claim that the public is misled by short historical periods in the CO2 and temperature data, when in fact it?s just the opposite ? it?s inappropriate to use longer time scale data.
But proper analytical methods are not something Wrightstone chose to follow in his book. It becomes confusing for the average reader to decipher reality in Inconvenient Facts; and from this confusion, the reader is free to adopt whatever viewpoint they prefer to be the truth.
Myth 2 ? Global warming is not due to CO2 or Humans
Wrightstone does not dispute that global warming is happening. However, he spends quite a few pages attacking the fact that recent global warming is caused by humans. He uses a number of lines of argument. One is that around 1998, global temperatures flattened despite continued increases in CO2.
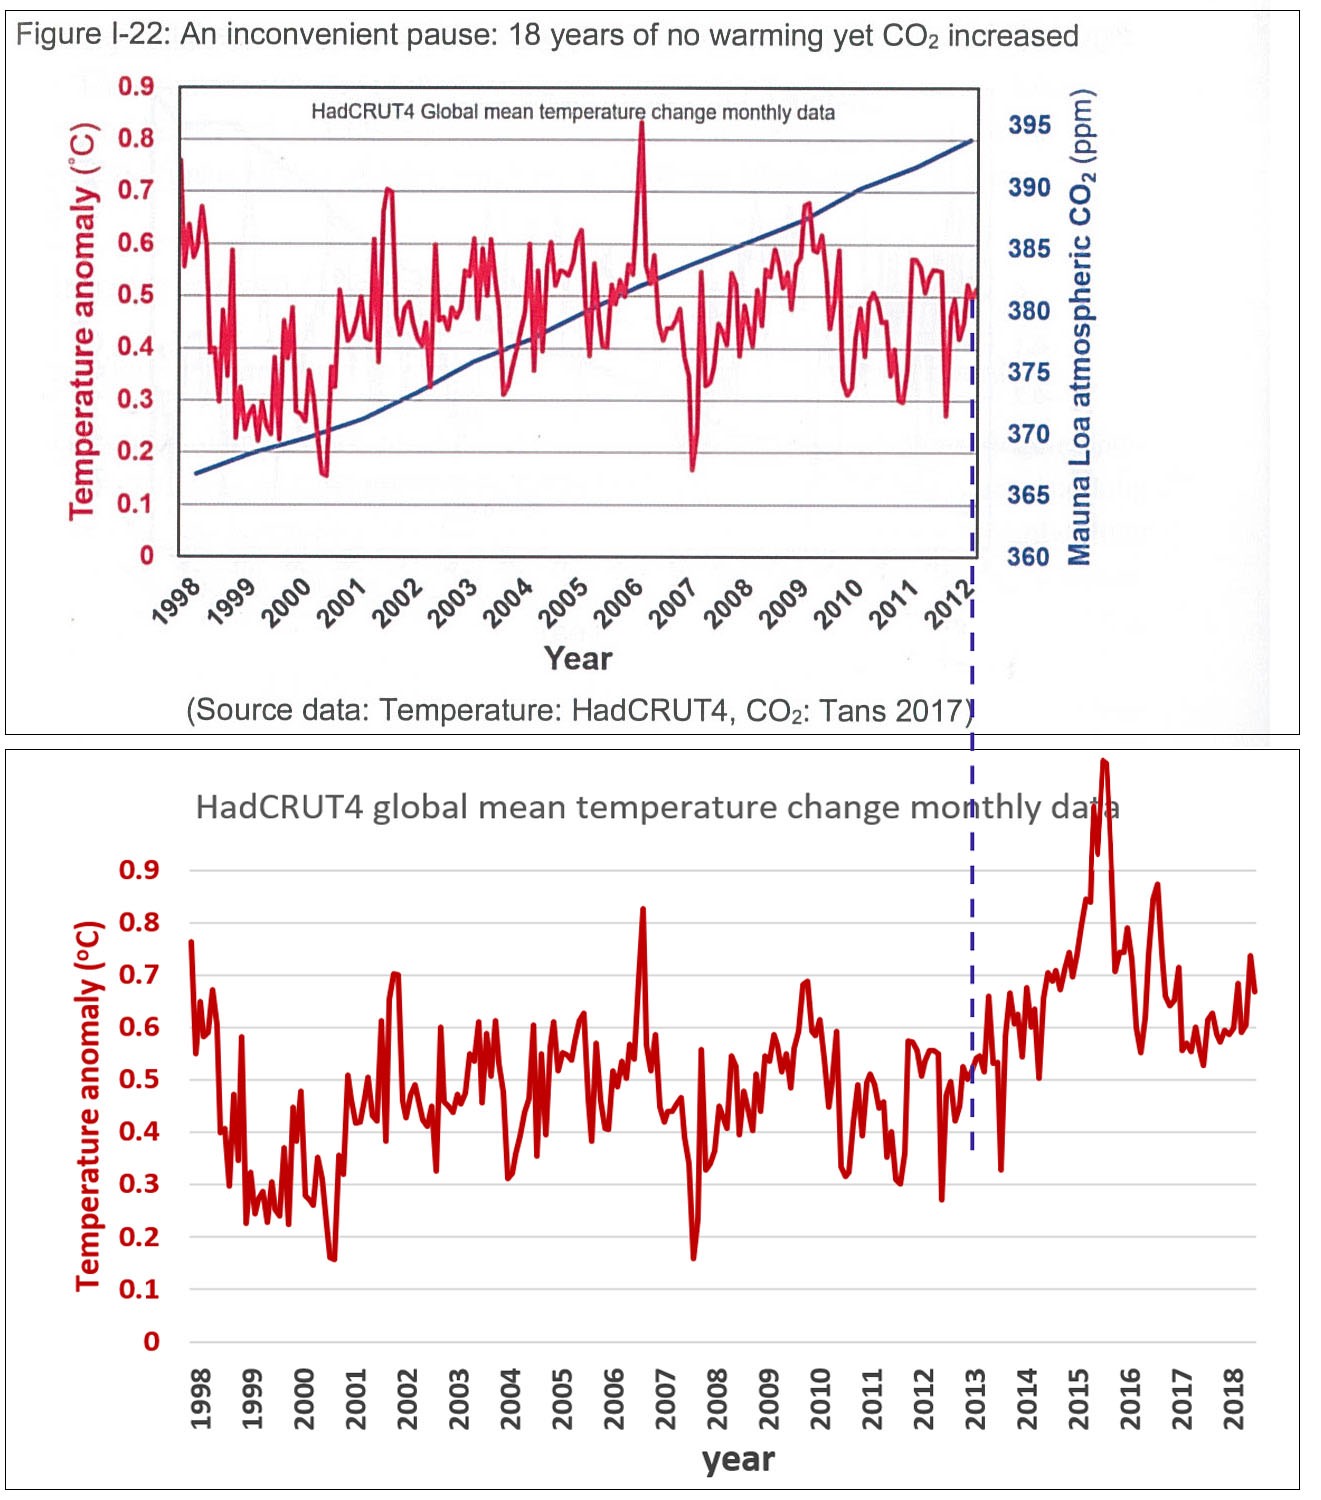
The top image below of a chart from Wrightstone?s book shows temperatures and CO2 levels from 1998 to 2012.
 Top image from (Wrightstone, 2017); Bottom image data source: HadCrut4
If you just take this at face value it starts to cause, in his words, ?any open-minded observer to question the validity of the claims made by those promoting the myth of a radical and dangerous man-made CO2-driven warming? (see: Wrightstone, 2017). And indeed, the data does appear to flatten out, or even drop, in recent years. But, why does his data stop in 2012 even though his book was published in 2017? Not because the recent years weren?t available ? the HADCRUT temperature data which he is showing is updated and published monthly and was available through 2017 when he published his book. When you look at the data from 2012?2017, the logical explanation for why he omitted it appears to be because the data clearly returns to an upward warming trend just like the 20 years before 1998, and this didn?t support his ?facts?.
In the bottom image above I show the full HadCRUT4 data set using the same scale as, and lined up below, the chart from Wrighstone?s book. Notice 2016 was the hottest year ever recorded by HadCRUT and would have been off his chart if it had been included. In fact, every single data point in this data set since 2012 was hotter than the average of the data from 1998?2012. Wrightstone had access to this data, yet apparently chose to not include it because it didn?t support his false claims.
Wrightstone goes on to discuss a chart of local temperatures in central England which shows temperatures rising 200 years before CO2 began to rise sharply in the early 1900s. This, he claims, demonstrates that temperature rise is not correlated to, or caused by, CO2 rise.
There are numerous problems with his logic. First, this data is not for the world, the northern hemisphere, or even Europe ? just for local England. The earth?s climate is a very complicated system, and there are always local anomalies. There are plenty of locations in the world where local temperatures have dropped while average global temperatures have risen. It?s critical to look at average trends over large regions.
Second, the data set happens to start with a period known as the ?Maunder Minimum,? around 1700, a very cold period coinciding with what?s known as the ?Little Ice Age.? The Little Ice Age was caused by volcanoes triggering a feedback loop in sea ice plus natural lows in solar radiation. Showing a data set that starts in the middle of the Little Ice Age conveniently makes the straight-line data fit he draws on top of the data look like it?s trending upwards. The warming trend was simply due to recovery from an extreme cold period and does not demonstrate that recent global warming is not caused by man-made CO2.
Climate science is complicated, and it is critical to separate natural fluctuations from man-made impacts. This is something the scientific literature does meticulously, but the climate deniers exploit. Wrightstone and other climate deniers take natural phenomena and use it as counter-examples of man-made climate change. The truth is that human CO2 emissions are unequivocally the dominant cause of recent global warming (IPCC Summary for Policy Makers, 2014).
Myth 3 ? Rising sea levels are not due to CO2 or humans
Wrightstone does not dispute that sea levels are rising. However, he attempts to dispute the fact that rising sea levels are due to rising CO2 levels and are caused by humans. He writes, ?The glaciers began to recede at least a century before appreciable quantities of man-made CO2 began to accumulate in the atmosphere?? (see: Wrightstone, 2017). However, the glaciers were receding because they expanded during the Little Ice Age around the year 1700 as discussed above. As global temperatures naturally recovered from the Little Ice Age, the glaciers naturally receded.
Wrightstone shows the annotated graph below twice in his book and claims that if humans were responsible for the acceleration in sea level rise, then that acceleration should have started sometime after humans began putting significant CO2 into the atmosphere.
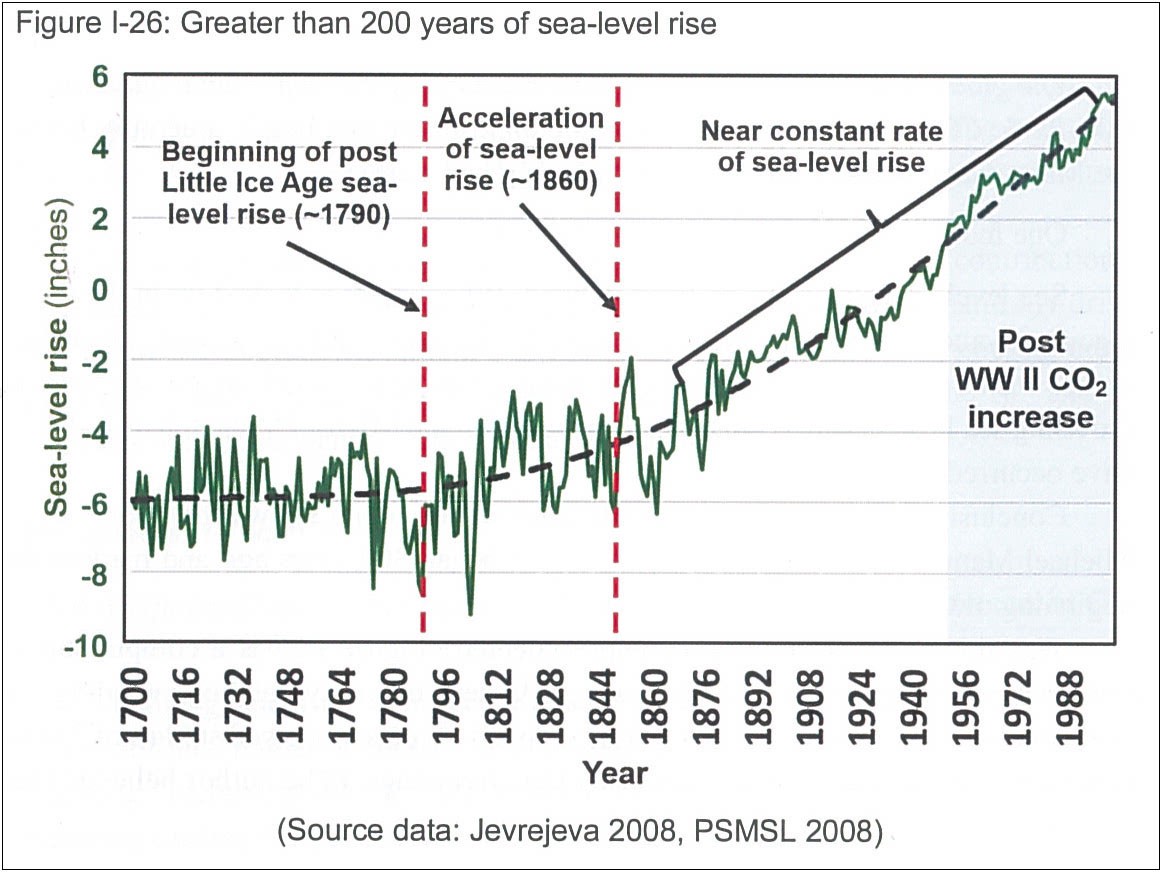 Image from (Wrightstone, 2017)
The chart clearly shows acceleration in the 1800s before significant human CO2 emissions began. However, it is important to consider that it?s not CO2 that directly causes sea level rise. It?s global warming that causes sea level rise due to thermal expansion of the oceans and melting of glaciers. The acceleration of sea level rise in the 1800s was due to the same warming trend following the Little Ice Age, covered above. The earth was warming as it recovered from the Little Ice Age, and so the oceans expanded, and the glaciers melted. As we have repeatedly seen, Inconvenient Facts incorrectly uses the natural temperature recovery from the Little Ice Age as evidence to support Wrightstone?s false claims. The existence of acceleration in sea level rise before significant human CO2 emission does not mean human CO2 emissions aren?t causing sea level rise today; it just means that there is more than one underlying cause of sea level rise. In this case, there was natural warming before the 1900?s, and then human CO2 emission causing warming in the 1900?s and beyond. There have been many periods of naturally accelerating sea level rise in the history of the earth.
Wrightstone further argues that when human emissions of CO2 did become significant in the post-World War II era, sea level rise appears to be constant, not accelerating as one might expect. This does appear to be the case when you look at his chart shown above. But his data stops in 2000. When you add the data from 2000 to 2010 there is an almost doubling in the rate of sea level rise. It is noteworthy that Wrightstone excludes this data from his book even though it was available at the time he wrote it. Furthermore, the very paper that Wrightstone references from Jevrejeva et al states that the acceleration of sea level rise has continued from the late 1700s through present day (meaning 2008 when the paper was published) and has not become ?near constant? as Wrightstone claims. Jevrejeva et al write, ?We provide observational evidence that sea level acceleration up to the present has been about 0.01 mm/yr2 and appears to have started at the end of the 18th century?.
Wrightstone writes ?What is undeniable is that the Intergovernmental Panel on Climate Change (IPCC) has been compelled to reduce its sea-level predictions in each successive five year Assessment Report?? (see: Wrightstone, 2017). In fact, the same paper that he took the data from, Jevrejeva et al, states, ?If the conditions that established the acceleration continue, then sea level will rise 34 cm over the 21st century. Long time constants in oceanic heat content and increased ice sheet melting imply that the latest IPCC estimates of sea level are probably too low?. Wrightstone cherry-picks data and ignores the expert opinions of the very scientists that he takes the data from.
Cherry-picking data is another common climate denier technique.
Myth 4 ? Global warming is not a problem, in fact it is good
The author poses an interesting idea: the next ice age is coming, so we should allow the earth to warm in order to counteract it. It is true that there is a next ice age coming, and so this is an intriguing idea?until you learn that the next ice age is, at the soonest, 2000 years away (and most likely much further away), and the effects of global warming will be felt, more and more each year, in the next 50 years. The author fails to recognize this obvious flaw in the logic.
We have a lot of time to worry about the next ice age, but no more time to worry about climate change. In fact, we have already committed ourselves to a certain amount of climate change and significant impacts to our modern way of life even if we stopped burning fossil fuels today. With no further climate mitigation, temperatures are predicted to rise 5 deg. C over pre-industrial temperatures less than 100 years from now, and more than 9 deg C by the year 2300 with CO2 levels of 2000ppm. These are catastrophic levels of warming and CO2. Wrightstone would have us hit these temperatures and continue to drive them up further for another 1700 years after that, in preparation for the next ice age, which just does not make sense.
While there will be some positive effects of global warming such as reduced cold-related deaths and increased food production in certain regions (though not globally), the negative impacts far outweigh the positive impacts.
Wrightstone builds-up his myths by first establishing the ?facts? and then creating a false conclusion from them. Here?s one example of his logic: CO2 is plant food (?fact? #3), more CO2 means more plant growth (?fact? #7), more CO2 helps to feed more people worldwide (?fact? #8), and finally his conclusion: ?Therefore, the proposed attempts by climate extremists to reduce CO2 concentrations would be bad for plants, bad for animals, and bad for humankind.? (see Wrightstone, 2017) First of all, crops depend on other factors besides CO2, and, while increased CO2 helps plant growth, overall, global warming is going to hurt food production, not help it, due to worsening droughts and increased temperature. If CO2 were to increase keeping all other variables constant, including water and soil, then, sure, crop yields would increase due to the higher CO2. But even in this non-real scenario, it would be an incorrect leap-in-logic to claim that because of this alone, reducing CO2 is bad for humankind. There are a multitude of negative impacts of increased CO2 that would far outweigh the benefit of higher crop yields even if it were true.
The truth is that we really don?t want more global warming. The impacts of increased global warming are widely understood among the scientific community to include: more extreme weather events, increased coastal flooding, reduced access to clean water, reduced crop yields, increased fires, more disease, resource wars, and more. (IPCC Impacts part A, 2013)
Myth 5 ? Scientists don?t agree that global warming is man-made
Wrightstone attacks the often-quoted statistic that 97% of climate scientists agree that global warming is man-made. This 97% number comes from a number of studies, including one by Cook et al which looked at the abstracts from 11,944 peer-reviewed papers related to climate change over 21 years. They identified 4,014 papers that stated an opinion about whether climate change is man-made or not. 3,898 said it is man-made. The study correctly calculated 3,898/4,014 x 100 = 97%. Wrightstone?s complaint about this study is that the 7,930 papers that made no statements about whether climate change is man-made or not were not included in the 97% calculation. His argument is that the researchers should have counted these in the denominator of the % calculation, and so the number should be 3,898/11,944 x 100 =32.6%.
This is not a valid way to tally opinions. If you are trying to report the number of people who have opinion A vs opinion B, you take the total number who have opinion A and divide it by the total number that stated either opinion A or B. If there was no opinion stated, then it is not part of the statistic.
Other similar studies have been done by numerous scientists with similar results to the Cook et al result from 2015. See the image below from Skeptical Science.
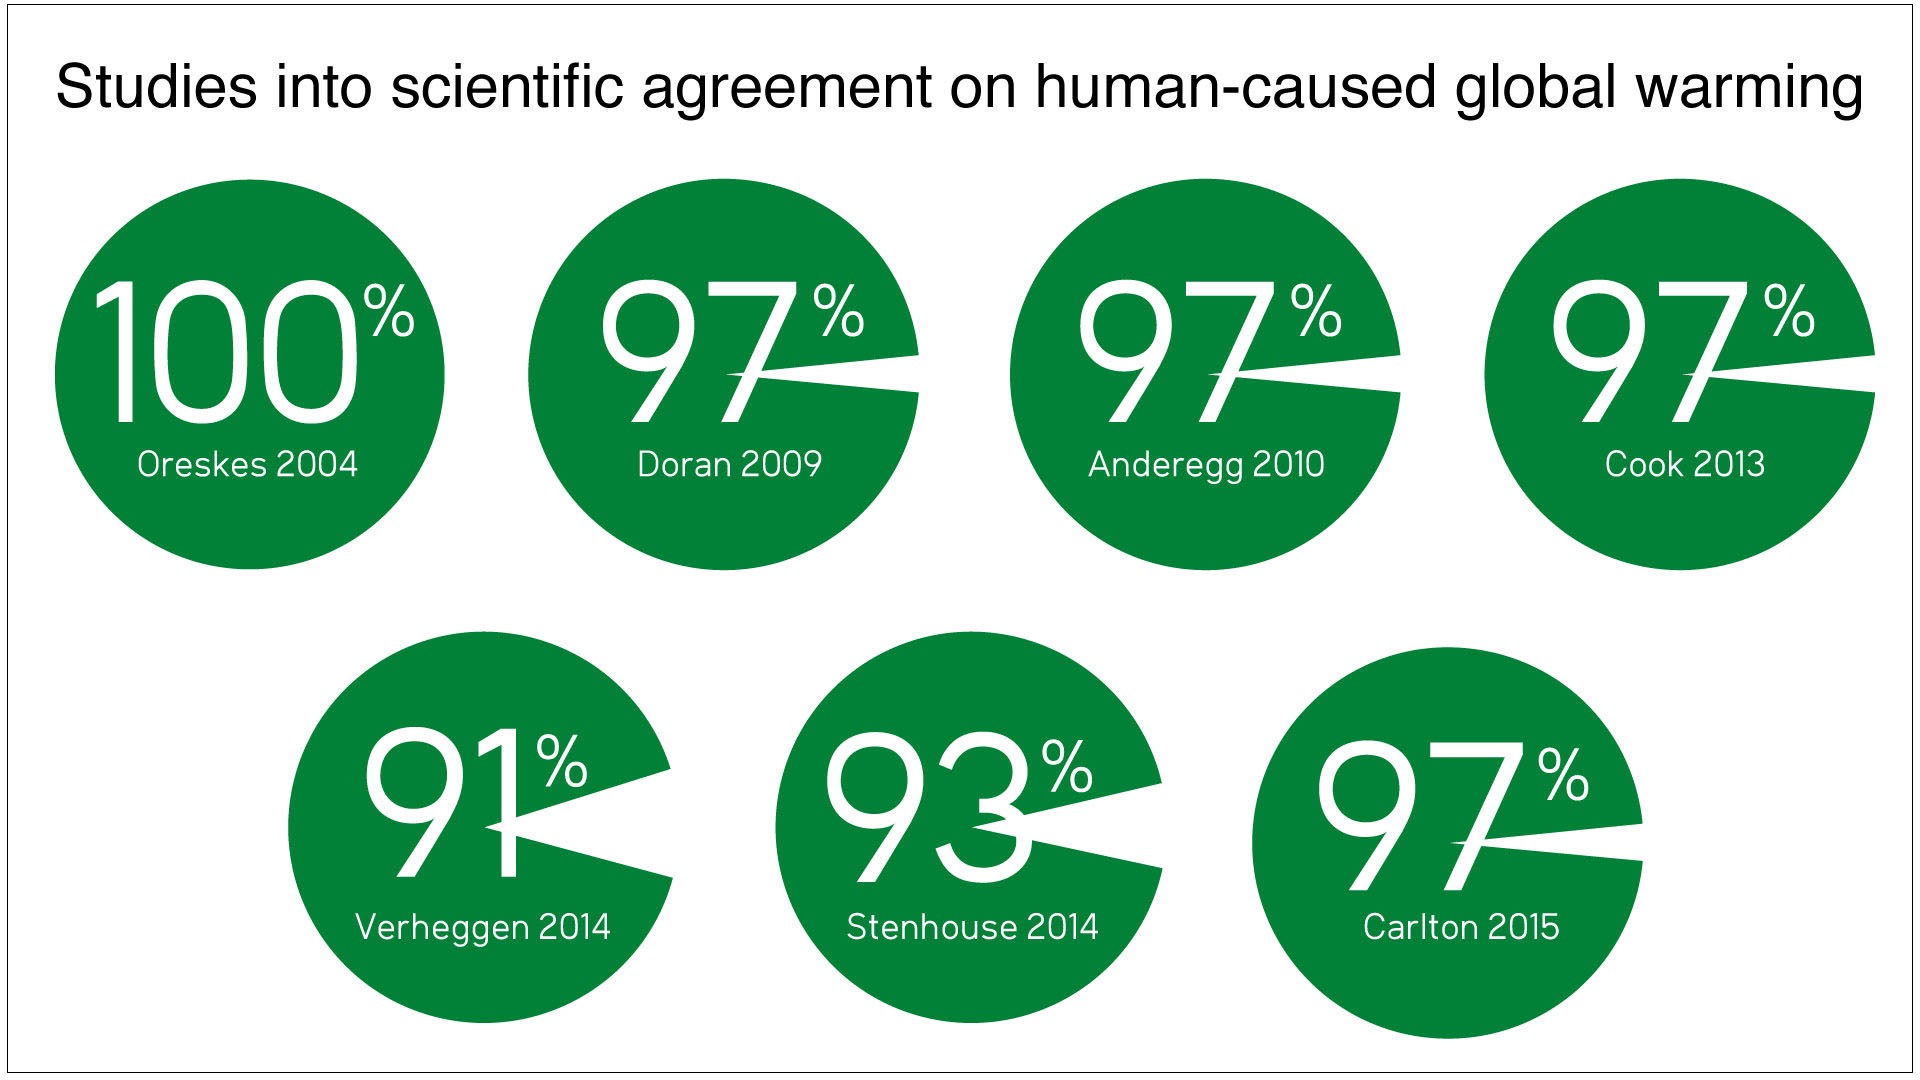 Image from Skeptical Science
In addition to the consensus studies, most scientific organizations world-wide have endorsed the basic notion that climate change is happening, and that it is mostly due to humans, including the National Academy of Sciences, National Research Council, the Intergovernmental Panel on Climate Change, and, notably, Wrightstone?s own peers at the Geological Society of America, of which he is a member according to his web site. Predictably, the only major scientific organization that disagreed with the notion of man-made climate change was the American Association of Petroleum Geologists, another association of which Wrightstone is a member. But even it softened its stance in 2007, and it is now non-committal on the question of man-made climate change.
1,700 independent scientists, including the majority of living Nobel laureates signed the ?World Scientists Warning to Humanity? in 1992 warning about climate change and humanity?s role and imploring the world to respond. The ?World Scientists Warning to Humanity: Second Notice,? published in 2017, is now signed by more than 20,000 scientists.
The notion that scientists are not convinced and deeply concerned about man-made climate change is un-founded.
Wrightstone points to a document called the Oregon Petition signed by 31,487 scientists stating, ?There is no convincing scientific evidence that human release of carbon dioxide, methane, or other greenhouse gases is causing or will, in the foreseeable future, cause catastrophic heating of the Earth?s atmosphere and disruption of the Earth?s climate.? (see: Oregon Petition in references at bottom). This petition is clearly an attempt to confuse the public and has numerous problems. The letter that accompanied the form sent to potential signatories emphasized a connection to the National Academy of Sciences and included an article that supported the petition statement that was nearly identical to those that appear in the scientific journal Proceedings of the National Academy of Sciences which made it seem that the article was a legitimate peer reviewed paper, which is wasn?t.
The National Academy subsequently released a statement regarding the article: ?The NAS Council would like to make it clear that this petition has nothing to do with the National Academy of Sciences and that the manuscript was not published in the Proceedings of the National Academy of Sciences or in any other peer-reviewed journal.? Furthermore, the list of signatories of the Oregon Petition shows names but no titles or affiliations that could be used to verify the list. According to the Petition web site, 40% of the signatories only have BS degrees, and most importantly only 39 (i.e. 0.1%) of the 31,487 listed Climatology as their discipline. The scientists listed in the study by Cook et al were all from the field of climatology, and this study showed 97% consensus that climate change is man-made.
Myth 6 ? Global Warming is not Creating More Extreme Weather Events
Not everything in Wrightstone?s book is wrong or misleading. He is correct that many people incorrectly tie too many extreme weather events directly to climate change. Scientists have not been able to create a clear case for connections between global warming and the frequency of hurricanes and tornadoes. Wrightstone, of course, emphasizes this point. There is, however, scientific evidence that the intensity of hurricanes is increasing due to increasing ocean temperatures caused by global warming.
There is also a connection between global warming and increased heat waves and to some degree regional drought, both of which Wrightstone denies. For example, his ?Inconvenient Fact 40? states ?EPA: Heat waves are not becoming more frequent? (see: Wrightstone, 2017). However, the EPA (Environmental Protection Agency) study he refers to in his book is for the Southeastern United States, not the world. World-wide a scientific correlation between increasing greenhouse gases and heat waves had been shown as of the time his book was published. As before, he confuses the reader by taking a local phenomenon and presenting it as if it were global.
The image below from Wrightstone?s book combines the number of forest fires over time and CO2 levels over time.
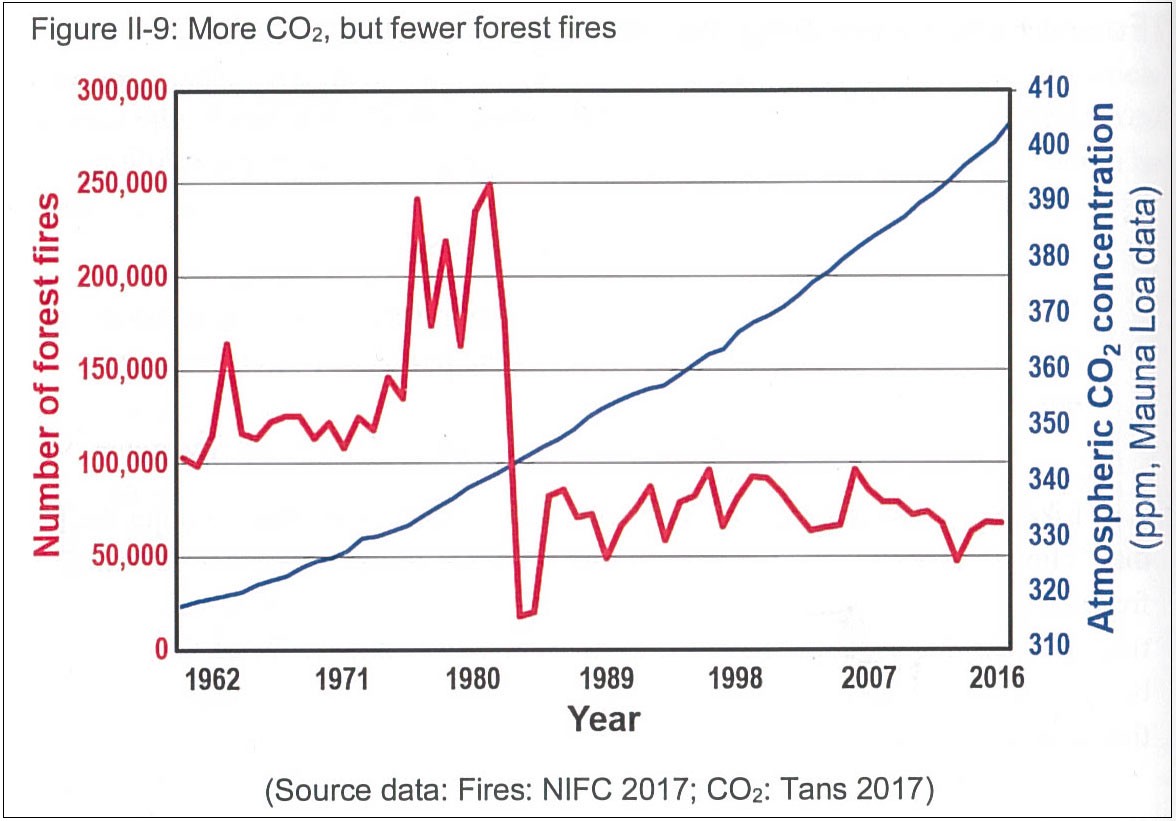 Image from (Wrightstone, 2017)
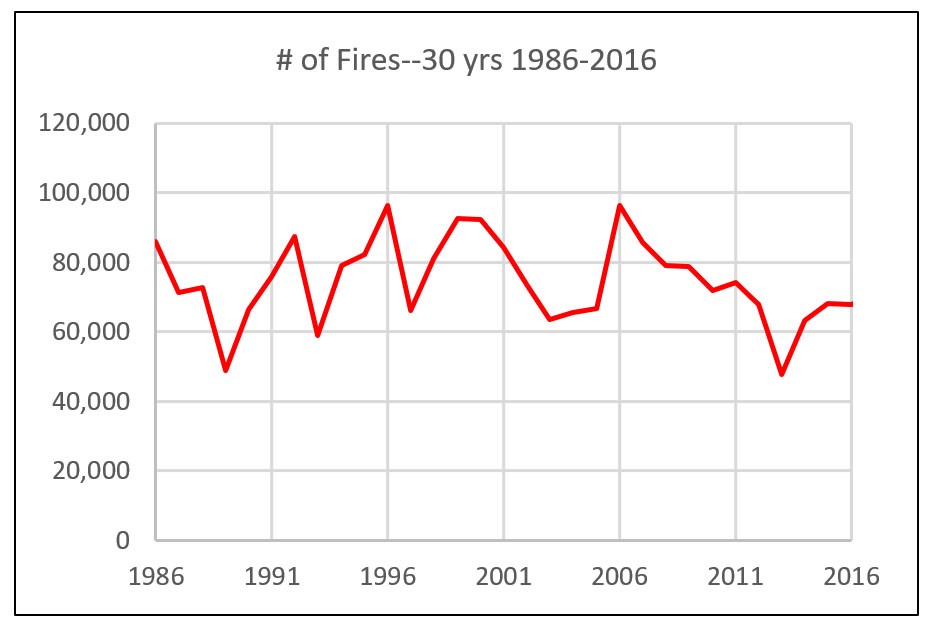
It certainly appears from this chart that fires are not going up despite increasing CO2. Wrightstone writes, ?The data clearly show a declining number of fires over the last 30 years? (see: Wrightstone, 2017). Most readers would read his statement, look at the chart, and say ?yup, clearly a big decline?. But, the last 30 years starts just after the dramatic cliff in his chart in 1986. If you plot just the 30 years from 1986 to 2016, the data looks like the chart below.
 Data source: National Interagency Fire Center
When you fit a straight line to this data that starts in 1986 it does show a very slight decline, but it?s almost imperceptible to the average person looking at the data who would tend to say it looks more or less flat ? certainly nothing like the visual impact when you compare it to the data prior to 1986. Furthermore, there?s a big problem with including the data from before 1986 as we will see shortly.
The fire data in his chart is from the National Interagency Fire Center. You can see the data on its web site. A screen image of the web page is shown below.
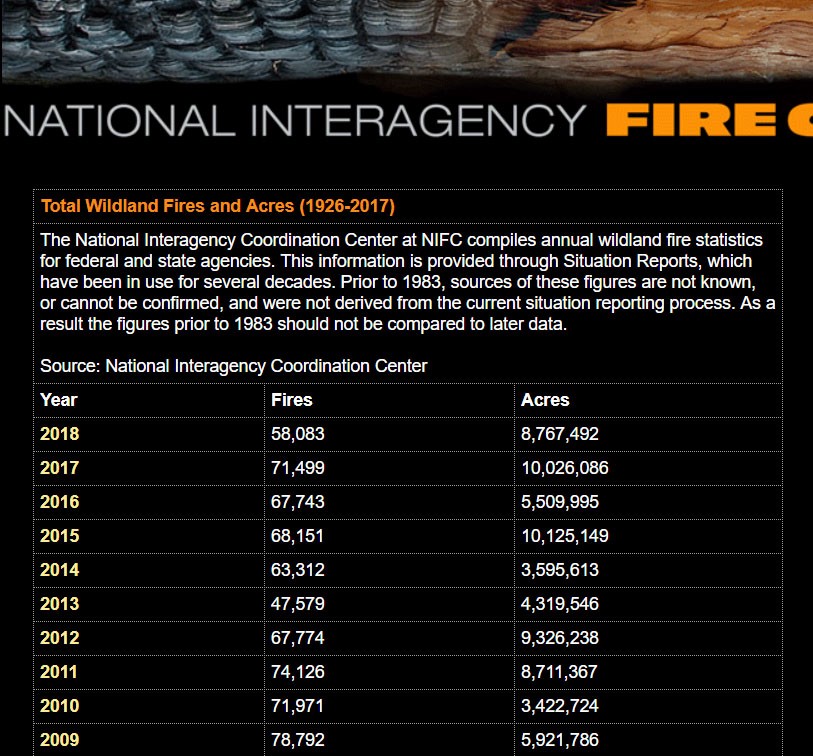 Image from: National Interagency Fire Center web page
Two things jump out at you when you see this web page. The first is the center?s statement at the very top of the page: ?Prior to 1983, sources of these figures are not known, or cannot be confirmed, and were not derived from the current situation reporting process. As a result, the figures prior to 1983 should not be compared to later data?. Wrightstone?s chart is doing exactly what the owners of the data are saying not to do ? compare post 1983 data to pre 1983 data. But, by including the pre 1983 data, he shocks his readers with the dramatic decline in fires in his chart. By qualifying his ?Inconvenient Fact? with the phrase ??over the last 30 years? he is not technically lying, he?s just being deceptive.
The second thing that jumps out at you from the NIFC web page is that it shows two columns of data: number of fires and acres burned by fires. If you plot the number of fires between 1962 and 2016 you indeed get a chart that looks like Wrightstone?s. However, if you plot the second column of data (acres burned) you get a much different picture as shown below.
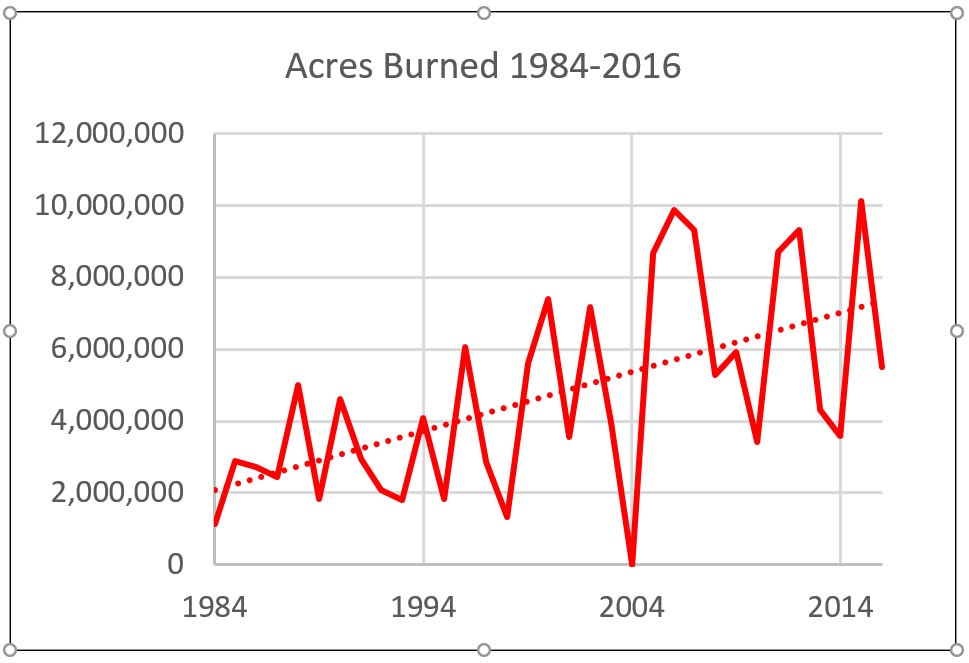 Data source: National Interagency Fire Center
It appears that while the number of fires has not increased recently, the size of the fires has increased dramatically. We really care about acres burned, not numbers, of fires. For example, the single 2017 Tubbs fire in Northern California burned 36,810 acres, destroying 5,643 buildings, and killing 22 people. In the chart of NIFC data above we see burned acres increased from around 2 million acres in 1984 to 7.5 million in 2016. This is a 275% increase.
Wrightstone couldn?t have missed this unless he is incompetent or, more likely, he was trying to miss it.
The truth is that climate change has increased the likelihood of wild fires, and as global temperatures continue to rise, the fires will continue to get worse (Abatzoglou et al, 2016, Moritz, 2012, IPCC Impacts part B, 2014).
Myth 7 ? Ocean acidification is not a problem.
Wrightstone repeatedly states that the oceans will not ?become acidic.? He does this to confuse the reader. Scientists are not concerned that the oceans will become acidic, only that they will become more acidic on the pH scale, meaning the pH will drop. ?Becoming acidic? means, by definition, a pH level below 7.0. Currently, the ocean has a pH level of around 8.1. ?Becoming more acidic? just mean that it will drop, perhaps to 7.8. It is highly unlikely to drop below 7.0 any time soon.
Wrightstone uses his other usual tools to further confuse the reader on the topic. He makes the same irrelevant argument that since things were worse in the pre-historic past, we shouldn?t worry today. He points out that 6000 years ago ocean pH was lower than today.
He also takes his usual approach of omitting information that was available to him at the time he wrote the book. In one example, he superimposes a pH level chart from Pelejero et al on top of a chart of rising CO2 levels to demonstrate that pH levels are not correlated to CO2 because there is a peak in the pH levels around 1960 despite rising CO2. See the image below from his book.
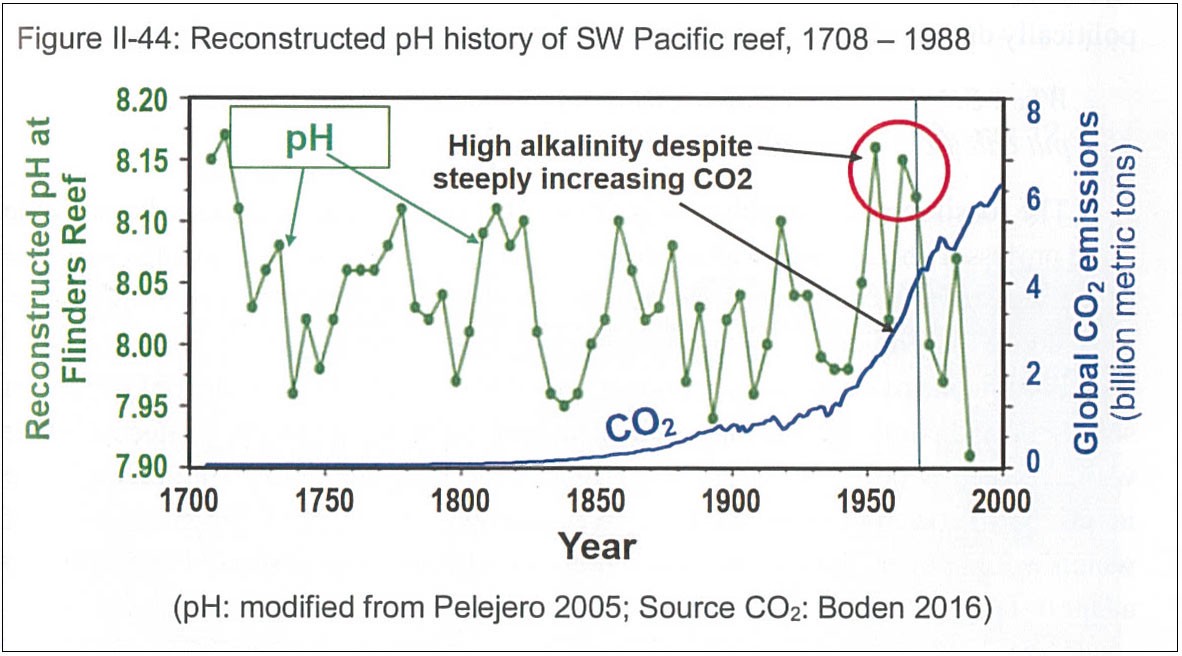 Image from (Wrightstone, 2017)
There are several key pieces of information that he hides. First, the very article he cites, Pelejero et al, starts out by saying ?The oceans are becoming more acidic due to absorption of anthropogenic carbon dioxide from the atmosphere?. (?Anthropogenic? means man-made.) He chose to use the data from the paper, but not the expert analysis of the authors.
Second, this paper points out that there is a natural 50-year cycle of pH level at the location where the data was collected. The last peak of this cycle occurred around 1960. This is the peak that Wrightstone points to as demonstrating that ocean pH is not correlated to CO2. But this is merely a natural up-cycle, unrelated to the effect of CO2. The authors of the data that he shows go on to state:
Estimates of global oceanic pH trends to the year 2000 indicate that the oceans have already acidified by 0.1 pH units relative to preindustrial times (3, 4). Geochemical models forecast an exponential decrease of nearly 0.8 pH units by 2300 (4), a scenario for which there is no obvious precedent over the last hundreds of millions of years (5), with the possible exception of abrupt changes such as those associated with the Paleocene/Eocene Thermal Maximum 55.5 million years ago (6). Experimental evidence indicates that such reductions in surface-ocean pH and carbonate saturation state could have major effects on calcifying marine biota (7), especially calcareous plankton (8) and coral reef communities, where the degree of carbonate supersaturation has been shown to have a major effect on calcification rates (9?11). (Pejero et al, 2005)
Third, despite the peaks in pH around 1960, the data Wrightstone includes in his book clearly shows a drop in pH happening in the last 40 years. In fact, the lowest data point on the entire 300-year chart is the last one. He chose to completely ignore all these facts.
Analysis of this kind of data is complicated (as you may have sensed reading the quote above from Pejero et al), and you can?t just slap a chart of CO2 on top of a chart of pH at a particular sample site and declare a lack of correlation. Ocean acidification is happening, and it?s a serious threat to the coral, shellfish, and pteropods at the base of the oceans? food chains and could lead to a collapse of the ocean ecosystem with serious consequences for humans that rely on food from the oceans.
Who is Gregory Wrightstone and why did he write this book?
Given the authority with which Wrightstone writes, you might assume he has a PhD in Climatology from a top-tier institution. You might assume he has published many peer-reviewed journal articles of his own about climate change. Actually, he is not a scientist. He doesn?t have a PhD. And I was not able to find any peer-reviewed articles about climate change that he has authored. He has a master?s degree in Geology from the 110th ranked Geology program in the US based on the 2018 US News and World Report. Inconvenient Facts is self-published, and it is Wrightstone?s only book.
Gregory Wrightstone is not a scientist with authority, but he is impersonating one.
Wrightstone?s errors in interpreting the real science are so blatant when you scratch the surface that it?s clear he is being willfully deceptive and either hoping to make money or generate notoriety from a sensationalist book that skillfully mis-leads non-scientists, or he is being paid to produce this mis-information by a special interest. I have a hard time accepting that he actually believes what he has written.
Wrightstone has worked for natural gas companies his whole career (CONTI, 2015, Meyer, 2019). He is also on the advisory board of the Heartland Institute, according to his web site. The Heartland Institute is a conservative think tank that in the 1990s helped Phillip Morris attempt to discredit the science of the health risks of smoking. Since then, it has made climate denial one of its main focuses. The Heartland Institute received funding from ExxonMobile and from Koch Industries.
The fossil fuel industry is a logical special interest in support of Wrigthstone?s Inconvenient Facts.
Conclusion
Wrightstone found 60 ?facts? (most of which are true) that, when highlighted can make an open minded person scratch their head and wonder whether climate change is what it is. He uses this small set of ?facts? to support his myths. But legitimate scientists have thousands of facts that point in the opposite direction and definitively show the unfortunate reality of climate change.
Books like Wrightstone?s have the potential to mislead the public into inaction on the critical issue of climate change. It?s fake science, and the risk is that it becomes the foundation of fake news that ultimately shapes public opinion and elections. It appears that this is Wrightstone?s goal. He has given 17 interviews in the past 12 months, and in March 2019 he testified before the Pennsylvania House Environmental Resources and Energy Committee giving the same false arguments I have addressed in this article (Wrightstone, 2019, Meyer, 2019).
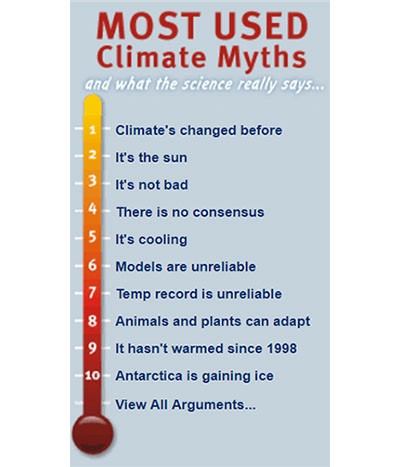
The motivating forces behind climate denial are most certainly from the fossil fuel industry. Climate denial has become a formula, and the people and institutions spreading this false information recycle the same arguments over and over again. Skeptical Science does a great job cataloging and debunking these myths. The home page includes the image to the left showing the top 10 most used myths. You?ll recognize many of them from the analysis of Wrightstone?s book.
It has been an interesting journey digging into Wrightstone?s book. Despite the horror I?ve felt at the blatant mis-information, I have benefited by learning about the kinds of tools used by climate deniers to confuse the issue.
When I showed my findings to my father, he realized that he had been tricked by the book and went back to his prior stance that climate change is real, man-made, and must be addressed immediately. He, like many who buy this book, wanted to believe that climate change was not really happening, and he didn?t have the time to investigate Wrightstone?s claims for himself.
Wrightstone and other climate deniers count on this.

Additional references not linked in-line:
Oregon Petition. www.petitionproject.org
Wrightstone (2017). Inconvenient Facts, The science that Al Gore doesn?t want you to know. Gregory Wrightstone. Silver Crown Productions, LLC.
Wrightstone (2019). Blog post: inconvenientfacts.xyz/blog/f/statement-to-the-pa-environmental-resources-energy-committee.

