For Discrete, Continuous, and Standardized Variables
 The logit function
If you?re trying to learn machine learning nowadays, chances are that you have encountered logistic regression at some point. As one of the most popular and approachable machine learning algorithms, the theory behind the logistic regression has been explained in and out by so many people. One area that is less explained, however, is how to translate coefficients into exact impact size measures. Rather than ranking coefficients and concluding feature A is important than feature B, we want to interpret the result of logistic regression as something like ?flipping feature A doubles the odds of the positive outcome and increasing feature B by 1 unit decreases the odds of the positive outcome by 60%? .
Logistic Regression Review
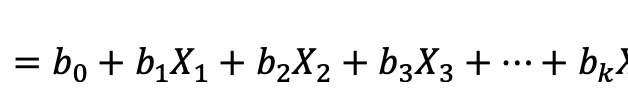
To start with, let?s review some concepts in logistic regression. The dependent variable of logistic regression is binary and the ?log-odds? of the dependent variable?s probability is modeled by a linear combination of independent variables:

The logit function is defined as the logged odds of probability p:

The odds of an event is the probability of it happens over the probability of it doesn?t happen. For example, if the probability of an event is 0.8, the odds of the event occurring is 0.8/0.2 = 4, and that is also to say that the event will occur 4 times for every time the event does not occur and this event is 300% more likely to happen than not.
Let?s take an example of predicting diabetes (diabetes = 1, not diabetes = 0) by patient?s age, gender, body mass index, blood pressure and let?s assume the data has been fitted with logistic regression and that the performance of the model has been validated using cross-validation (very important to check to prevent overfitting). The coefficients for each variables have been estimated and we want to interpret them in terms of impact size.
Binary variables:
In the example, gender is a binary variable (male = 0 and female = 1) and let?s pretend that the trained logistic regression gives this feature a coefficient of 0.6. It?s straight forward to interpret the impact size if the model is a linear regression: increase of the independent variable by 1 unit will result in the increase of dependent variable by 0.6. With the logit transformation, the changes in the target of logistic regression is not as obvious.
To illustrate the derivation, let?s plug in the coefficients and variables representing the gender of patients in the equation above, we have:

To cancel the changing factors of other variables, the difference of the two previous equations:

This means providing all the other metrics are the same, and flipping the gender from male to female, the log-odds of getting diabetes will increase by 0.6.
To convert log-odds to odds, we want to take the exponential on both sides of equation which results in the ratio of the odds being 1.82.

From the derivation, we can see the impact size of the logistic regression coefficients can be directly translated to an Odds Ratio, which is a relative measure of impact size that is not necessarily related to the innate probability of the event. If the odds ratio is equal to 1, it means the odds of the events in the numerator is the same as the odds of the events in the denominator, and if the odds ratio is above 1, the events in the numerator has favorable odds comparing to the events in the denominator.
Coming back to the example, the coefficient of the gender feature being 0.6 can be interpreted as the odds of females getting diabetes over the odds of males getting diabetes is 1.82 with all the other variables fixed. In terms of percentage change, the odds for females getting diabetes are 82% higher than the odds for male getting diabetes.
Continuous variables:
Another variable in the example of predicting diabetes is age, which is a continuous variable, and let?s say the trained logistic regression coefficient for this variable is -1.5. Let?s repeat the same exercise as we did for the binary variable by increasing the patient?s age by one year:

Cancel the common factors by taking a difference,

and then express the impact size by odds ratio

This result says that, holding all the other variables fixed, by increasing one year of age we expect to see the odds of getting diabetes reduce by about 78%.
Standardized variables:
One common pre-processing step when performing logistic regression is to scale the independent variables to the same level (zero mean and unit variance). The motivation of this type of scaling, named standardization, is to make the feature coefficient scales comparable with each other and to facilitate the convergence of the regression algorithm. The regression coefficients obtained from standardized variables are called standardized coefficients. In our example, age and blood pressure have completely different scales and units – with standardized coefficients we are able to say which feature has greater impacts towards diabetes. But how do we get from these standardized coefficients back to odds ratio with interpretable units?
The trick here is to convert the standardized unit back to the original unit of the feature. For example, in the diabetes study the patients have a standard deviation of 10, and the fitted logistic regression gives this feature a standardized coefficient of 2. This means by increasing one standardized unit of age, the odds ratio of getting diabetes is exp(2) = 7.39 (i.e. the odds of getting diabetes increase by 639%). From the scaling transformation we know that one standardized unit of age equals to 10 years, which is the standard deviation of age before the transformation. Plugging this information back, we can conclude that increasing patients age by 10 years will lead to an increase of odds of getting diabetes by 639%.

