We?ve all heard in school that ?correlation does not imply causation,? but what does imply causation?! The gold standard for establishing cause and effect is a double-blind controlled trial (or the AB test equivalent). If you?re working with a system on which you can?t perform experiments, is all hope for scientific progress lost? Can we ever understand systems that we have limited or no control over? This would be a very bleak state of affairs, and fortunately there has been progress in answering these questions in the negative!
So what is causality good for? Anytime you decide to take an action, in a business context or otherwise, you?re making some assumptions about how the world operates. That is, you?re making assumptions about the causal effects of possible actions. Most of the time, we only consider very simple actions: I should eat, because the causal effect of ?eating? on ?hunger? is negative. I should show more impressions of this ad, because the causal effect of impressions on pageviews is positive. What about more complex interventions? What about the downstream effects? Maybe showing more impressions of the ad increases pageviews of it, but it draws traffic away from something more shareable, reducing traffic to the site as a whole. Is there a way to make all of the downstream causal effects obvious? Is there a way to make causal assumptions explicit, so their merits can be discussed, and our model of the world can improve?
The more I read and talked to people about the subject of causality, the more I realized the poor state of common knowledge on the subject. In discussing it with our group, we decided to work through Causality by Judea Pearl in our Math Club. There have been a lot of great questions and discussions coming out of those sessions, so I decided to finally start writing up some of the discussions here. I?ll do my best to give proper credit where it?s due (with permission), but I apologize to any participants I leave out!
For this first post, I?d like to explain what causality is all about, and talk a little about what ?evidence? means. This falls a little outside of the standard pedagogy, but I think it?s a useful way of looking at things. You?ll see that it can give us a model of the world to discuss and build on over time, and we?ll take a step toward measuring the downstream effects of interventions!
What is Causality?
The term ?causality? has a nice intuitive definition, but has eluded being well-defined for decades. Consider your commute to work. We have an intuitive understanding that traffic will cause you to be late for work. We also know that if your alarm doesn?t go off, it will cause you to be late to work. We can draw this as a picture, like figure 1.
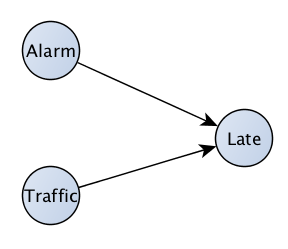 Fig. 1 : Basic cause and effect
This picture is a great start, but these are really just two of the most common causes of being late for work. Others could include your car not starting, forgetting to make the kids lunch, getting distracted by the news, etc. etc. How can our picture incorporate all of these little things that we don?t include? Can we ever hope to get a reasonable picture of the world when we can?t possibly measure all of the causes and effects?
The answer turns out to be relatively simple. Our model just needs to include the most common, large effects on our trip to work. If we omit a large number of small, independent effects, we can just treat them as ?noise?. We stop talking about things as being completely determined by the causes we take into account. Instead, we talk about a cause as increasing the chances of its effect. You go from intuitions like ?my alarm not going off causes me to be late? to intuitions like ?my alarm not going off causes me to be much more likely to be late?. I think you?ll agree that the second statement reflects our understanding of reality much better. It takes care of the host of ?what-if? questions that come up from all of the unlikely exceptions we haven?t taken into account. ?What if I happened to wake up at the right time anyhow when my alarm didn?t go off?? or ?What if I was tired enough that I overslept, even though my alarm did go off??. These are all incorporated as noise. Of course we?re free to add any of these things into our picture as we like. It?s just that we may prefer not to. There?s an exception we?ll talk about briefly in a moment. First, we need one more idea.
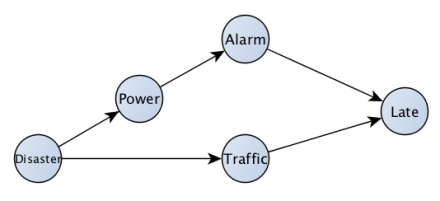 Fig. 2: A slightly more complete picture of the world
We can build a much more comprehensive picture by chaining together causes and effects. What are the causes of traffic? What are the causes of the alarm not going off? If there?s a disaster, it could cause the power to go out, preventing the alarm from going off. It could also cause traffic. Our new picture should look something like figure 2. This picture says something very important. Notice that if a disaster happens, it?s both more likely both that your alarm will fail to go off, and that there will be traffic. This means in a data set where you measure days on which there is traffic, and whether your alarm goes off on those days you?ll find a correlation between the two. We know there?s no causal effect of your alarm going off on whether or not there?s traffic (assuming you drive like a sane person when you?re late), or vice versa. This is the essence of ?correlation does not imply causation?. When there is a common cause between two variables, then they will be correlated. This is part of the reasoning behind the less-known phrase, ?There is no correlation without causation?[1]. If neither A nor B causes the other, and the two are correlated, there must be some common cause of the two. It may not be a direct cause of each of them, but it?s there somewhere ?upstream? in the picture. This implies something extremely powerful. You need to control for common causes if you?re trying to estimate a causal effect of A on B (read more about confounding). If there were a rigorous definition of ?upstream common cause,? then there would be a nice way to choose what to control for. It turns out there is, and it?s rooted in these nice pictures (?causal graphs?). This can be the subject of a future post.
It turns out that if you don?t include hidden common causes in your model, you?ll estimate causal effects incorrectly. This raises a question: can we possibly hope to include all of the hidden common causes? What other alternative is there, if this approach fails?
How Science Works
We?re asking questions at the core of the scientific method. I?ll try to avoid getting into the philosophy of science, and instead make some observations based on basic formulae. Suppose we think the world works according to our first picture, fig. 1. We want to test out this assumption, that fig. 1 is really how the world works. The absence of a cause-effect relationship between traffic and the alarm going off, in these pictures, means there is no causal relationship between the two, whatsoever (including unobserved common causes!). Disasters are rare. It?s conceivable that in the limited amount of time we?ve been observing traffic and our alarm going off, we?ve never seen one.
As time goes on, more and more disasters might happen, and Fig. 1 stands on shaky footing. We start to accumulate data points with the disasters? effect on traffic and the alarm clock. Maybe we live in the midwestern United States, where tornadoes are relatively common, or California, where earthquakes are and the collection happens quickly. Over time, we?ll go from a statistically insignificant measurement of a correlation between traffic and alarm clock, and reach a statistically significant one. Voila! We have evidence that our model is incorrect. Fig. 1 shows no cause-effect relationship between alarm and traffic, but we?re observing that they?re correlated, and we know there is ?no correlation without causation?. The disasters are the cause that is missing from our model.
What does the correct picture look like? We can use our background knowledge of how the world works to say there?s no causal link between the alarm and traffic, and so there must be some unobserved common cause between the two. Since we?re only observing the alarm clock, traffic, and lateness, we can only update our model with the knowledge that it?s wrong, since it neglects an unobserved common cause. How do we do this? As it happens, there?s a way to write this, with a double-ended arrow as in fig. 3. The double-ended arrow is a way to say ?there is some unobserved common cause between alarm and traffic?.
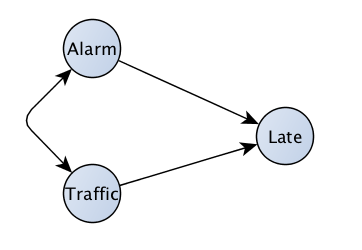 Fig 3: An unobserved common cause
Now we know we need to start looking at the causes of the alarm going off and of traffic. Hopefully, we?ll eventually narrow it down to fig. 2.
Notice that it took a lot of data to find a situation where we started noticing the missing link between the alarm and traffic. You can get an intuitive sense that maybe, even though some links and variables might be missing, we have something ?close enough? to the whole picture. What are the odds that fig. 2 is wrong today? How bad is my estimate of the odds that I would have been late if my alarm had actually gone off, in general?
It turns out that the answer is, because disasters are rare, you won?t be too far off. That?s true even if there?s a 100% chance of being late given that a disaster happens. Over time, we can take even this small amount of error into account.
There is precedent for this type of advancement in physics. We generally don?t regard a set of laws as being the complete picture, but they?re ?good enough? for the situation we?re considering. We known that Newton?s gravity theory is missing some important pieces, and that Einstein?s General Relativity is a more complete picture. Even so, Newtonian gravity was enough to get us to the moon. It?s not enough, however, to operate a GPS system. The reason we hadn?t had to use it before was that there were relatively few situations where we needed to model high energy systems acting over large distances and times. This is analogous to our example where the chances of a disaster are low. There were a few situations that stood out as anomalous, like the precession of Mercury which suggested that the model as we understood it would break down. Over time, you find more anomalies, and improve your picture of the world.
We?ve answered part of the question. We see that we have to have larger and larger datasets to capture rare effects, and so our understanding of the world could improve over time. What remains is whether we?re guaranteed to notice all anomalies, and whether that matters. We?ve seen that the incomplete model can be useful. Soon we?ll talk about the prospects of noticing all anomalies that aren?t included in our model. Is it even possible, with an infinite dataset? Once we have the model, is it possible to estimate the odds that we?re wrong with a specific prediction? This might be the subject of a future post. For now, let?s talk a little more about how to use these types of models.
What Would Have Happened If ??
The question of ?What would have happened if things were different?? is an essentially causal question. You?re asking what would be the effect if the world had operated differently than it was observed to, perhaps based on some policy intervention. The question ?What would have happened if I had intervened in the system with some policy intervention?? is essentially the question ?What is the causal effect of this policy intervention on the system??. If you only observe how the system normally operates, you?ll generally get the wrong answer. For example, if you intervene to make sure your alarm never fails to go off (for example, by switching to a battery powered alarm clock), then you will underestimate the odds of being late to work. You?ll misattribute lateness due to traffic (which happens at the same time as your clock failing to go off!) as being due to your alarm clock, and so overestimate the effect of the alarm failing to go off.
This type of question is at the core of a lot of business and policy decisions. What would happen if our recommender system didn?t exist? What would happen if we made some changes to our supply chain? What would be the effect of a certain policy intervention on homelessness? All of these questions are extremely hard to answer experimentally, and can?t necessarily be answered from statistical data (i.e. large data sets). They could be relatively easier to answer if we have a good causal model of how the system operates, to go with our statistical data, and possibly supplemented by the few experiments within the system that we?re able to do. We?ll talk about how that?s done in some future posts!
[Edit:] This is the first post in a series! Check out the rest here!
[Edit:] [1] To be completely precise: what we mean here is that all statistical dependence comes from causal structure. We?re NOT saying that statistical dependence between X and Y means X causes Y or vice versa. We?re saying the structure, as describable by some (possibly unknown) causal graph is the reason for the dependence. To draw out the point: the dependence might be due to a confounder, where X ? Z ? Y, due to sampling on a common effect, X ? Z ? Y, where we sample based on Z. To revise the quote, we might say ?there is no correlation without causation somewhere?. Thanks to Ed Cashin for helpful feedback!

![[FOOTBALL/@^GAME]@@Patriots vs Panthers NFL Live Stream Reddit for Preseason Week 3](https://911weknow.com/wp-content/themes/mts_myblog/images/nothumb-myblog-related.png)