Transform your charts into something more visually appealing?and accessible?using matplotlib colormaps
Overview
Data scientists are visual storytellers, and to bring these stories to life, color plays an important role in accomplishing that. Data can be easily visualized using the popular Python library matplotlib. Matplotlib is a 2D visualization tool that allows one to create scatterplots, bar charts, histograms, and so much more. Matplotlib works very well with pandas, another popular library in Python used for data analysis. Pandas is very useful for structuring data to be then plotted with matplotlib.
Once you have a plot created with these tools, you can easily bring them to life with colors using the predefined colormaps?sets of RGBA colors that are built into matplotlib. You can even create your own matplotlib colormaps!
An important application of matplotlib colormaps is using it to make your work more accessible for people with color vision deficiencies. The most common color vision deficiency is the inability to distinguish between red and green, so avoiding placing those colors together in general is a good idea.
In this article, I will show you how to transform your charts into something more visually appealing, and accessible, using matplotlib colormaps.
Creating a Scatter Plot
First, import the two libraries needed, pandas and matplotlib:
import pandas as pdimport matplotlib.pyplot as plt
Now let?s create a dataframe using any dataset. I will be using the wine dataset from the UCI Machine Learning Repository to create the dataframe that will be plotted. Here is the code:
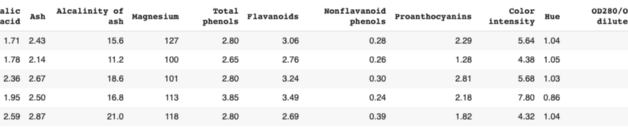
wine_url = ‘https://archive.ics.uci.edu/ml/machine-learning-databases/wine/wine.data’ #define column headerswine_column_headers = [‘Alcohol’,’Malic acid’,’Ash’,’Alcalinity of ash’, ‘Magnesium’,’Total phenols’,’Flavanoids’,’Nonflavanoid phenols’,’Proanthocyanins’,’Color intensity’,’Hue’,’OD280/OD315 of diluted wines’,’Proline’]wine_df = pd.read_csv(wine_url, names = wine_column_headers)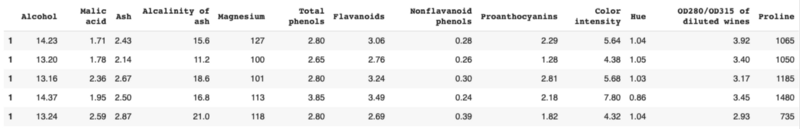 Wine Dataframe
I was curious about the relationship between alcohol content and color intensity, so I chose to plot those variables. This is the default scatterplot and the code follows:
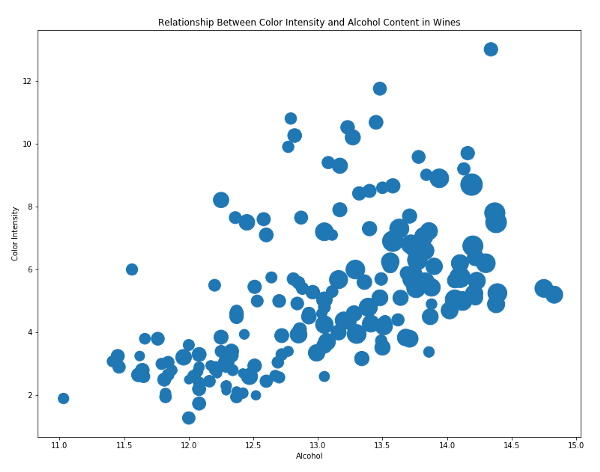 Default scatterplot#figurefig, ax1 = plt.subplots()fig.set_size_inches(13, 10)#labelsax1.set_xlabel(‘Alcohol’)ax1.set_ylabel(‘Color Intensity’)ax1.set_title(‘Relationship Between Color Intensity and Alcohol Content in Wines’)#plotplt.scatter( wine_df[‘Alcohol’], wine_df[‘Color intensity’], s = wine_df[‘Proline’]*0.5)
Now that we have our default plot, we can try changing the color and opacity to see what that looks like:
Better, but let?s try that with colormaps.
Arguments for Colormaps: C and Cmap
The main difference with colormaps is that it requires the arguments c and cmap inside scatter(), rather than color. So to use matplotlib colormaps, we need to replace the previously used color argument with c and cmap. Before we do that, let?s briefly go over what these terms represent.
c represents a color, sequence, or sequence of color and its possible values are:
- A single color format string.
- A sequence of color specifications of length n.
- A scalar or sequence of n numbers to be mapped to colors using cmap and norm.
- A 2D array in which the rows are RGB or RGBA.
In this case, our c will be the third option, ?a scalar or sequence of n numbers to be mapped to colors using cmap and norm.?
cmap stands for colormap and it?s a colormap instance or registered colormap name (cmap will only work if c is an array of floats).
Matplotlib colormaps are divided into the following categories: sequential, diverging, and qualitative. You can view the color schemes of all colormaps in the documentation and the currently available colormap names are listed below (they are case sensitive!):
Perceptually Uniform Sequential [‘viridis’, ‘plasma’, ‘inferno’, ‘magma’]Sequential [‘Greys’, ‘Purples’, ‘Blues’, ‘Greens’, ‘Oranges’, ‘Reds’, ‘YlOrBr’, ‘YlOrRd’, ‘OrRd’, ‘PuRd’, ‘RdPu’, ‘BuPu’, ‘GnBu’, ‘PuBu’, ‘YlGnBu’, ‘PuBuGn’, ‘BuGn’, ‘YlGn’]Sequential (2)[‘binary’, ‘gist_yarg’, ‘gist_gray’, ‘gray’, ‘bone’, ‘pink’, ‘spring’, ‘summer’, ‘autumn’, ‘winter’, ‘cool’, ‘Wistia’, ‘hot’, ‘afmhot’, ‘gist_heat’, ‘copper’]Diverging[‘PiYG’, ‘PRGn’, ‘BrBG’, ‘PuOr’, ‘RdGy’, ‘RdBu’, ‘RdYlBu’, ‘RdYlGn’, ‘Spectral’, ‘coolwarm’, ‘bwr’, ‘seismic’]Qualitative[‘Pastel1’, ‘Pastel2’, ‘Paired’, ‘Accent’, ‘Dark2’, ‘Set1’, ‘Set2’, ‘Set3’, ‘tab10’, ‘tab20’, ‘tab20b’, ‘tab20c’]Miscellaneous[‘flag’, ‘prism’, ‘ocean’, ‘gist_earth’, ‘terrain’, ‘gist_stern’, ‘gnuplot’, ‘gnuplot2’, ‘CMRmap’, ‘cubehelix’, ‘brg’, ‘hsv’, ‘gist_rainbow’, ‘rainbow’, ‘jet’, ‘nipy_spectral’, ‘gist_ncar’]
Plotting With Matplotlib Colormaps
The value c needs to be an array, so I will set it to wine_df[?Color intensity?] in this example. You can also create a numpy array of the same length as your dataframe using numpy.arange() and set that value to c. (Note: you will have to import numpy first). When selecting a colormap, I like to give a bit of consideration to what colors the data would typically be associated with, and go from there. I?ve chosen to use ?RdPu? in this example as those are the colors you?ll come across for wines.
Applying that to our previous figure, we get:
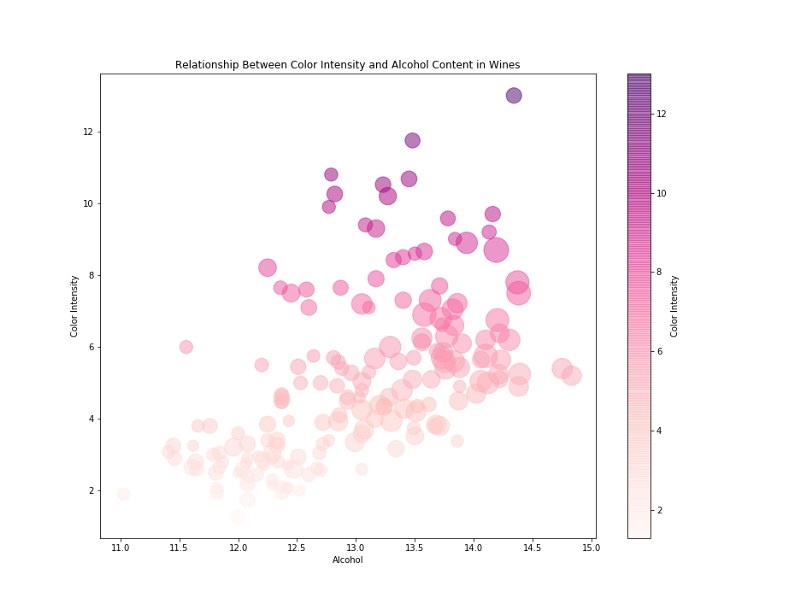 Scatter plot with colormaps
Here is the final code to apply a colormap to our original plot and generate the above figure:
You can also reverse the order of colors on any colormap by simply adding ?_r? to the end of any color code:
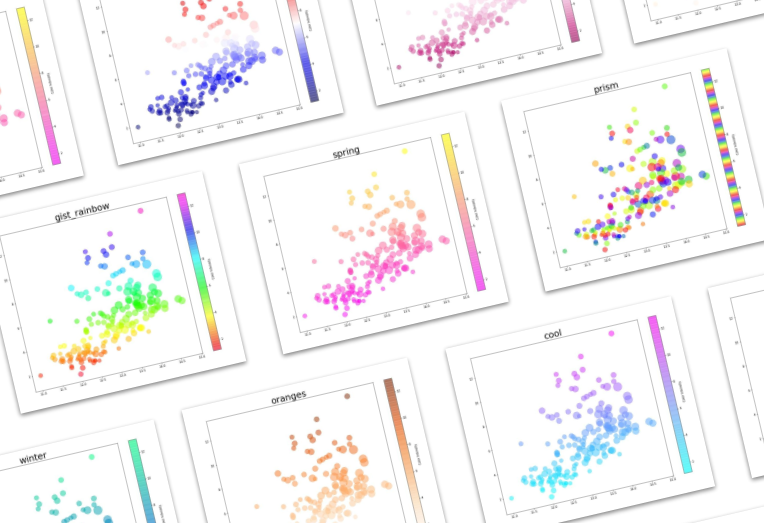
There are so many more colormap options to choose from. Here are a few applied to the same plot and named by the color code so you can easily test what you like.
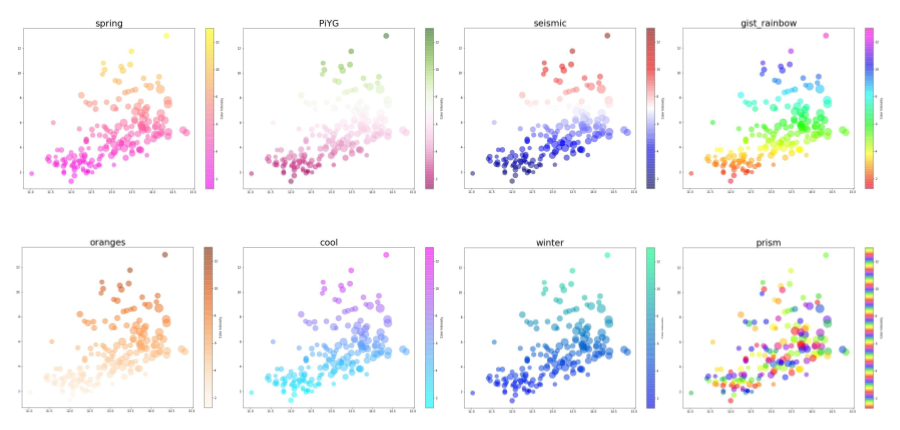 Different colormap options
And there you have it: a simple application of matplotlib colormaps onto scatterplots.
Find me on Twitter @elizabethets!
Sources:
matplotlib.pyplot.scatter – Matplotlib 3.1.0 documentation
Edit description
matplotlib.org
Choosing Colormaps in Matplotlib – Matplotlib 3.1.0 documentation
Matplotlib has a number of built-in colormaps accessible via . There are also external libraries like [palettable] and?
matplotlib.org
color example code: colormaps_reference.py – Matplotlib 2.0.2 documentation
Edit description
matplotlib.org
https://archive.ics.uci.edu/ml/datasets/Wine

