Recently while I was working on processing a very high frequency signal of 12.5 Khz , i.e. 12500 samples per second or a sample every 80 microsecond. What was more interesting is that I had to derive various data points into this data set.
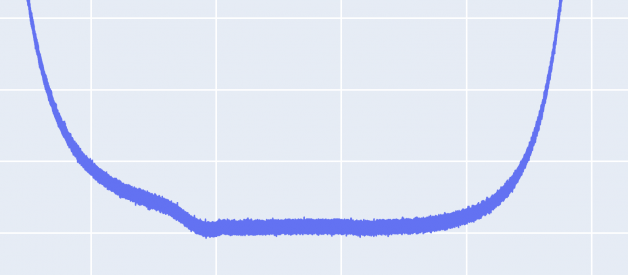
This is how my data in a single cycle looked like
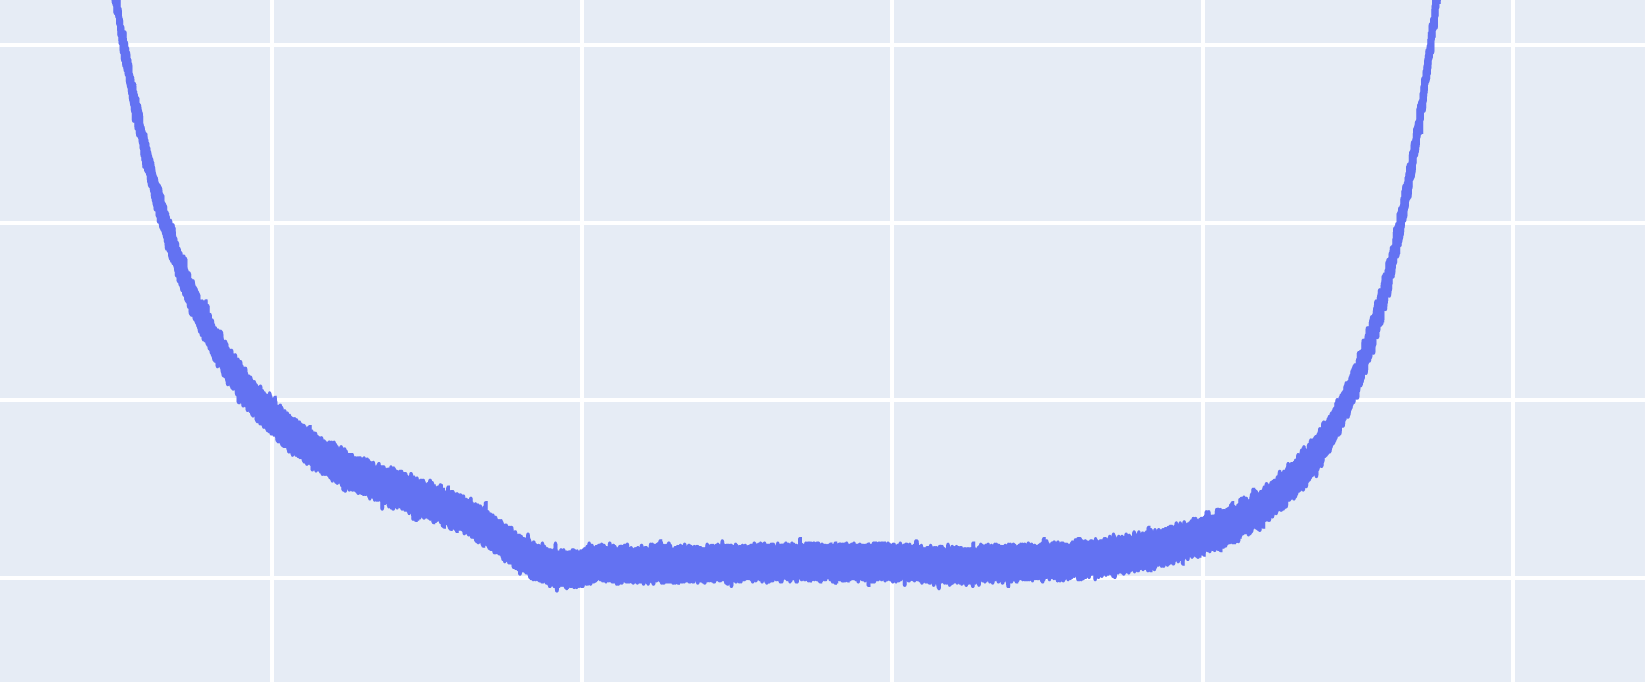
You can see the noise when I zoom in the data
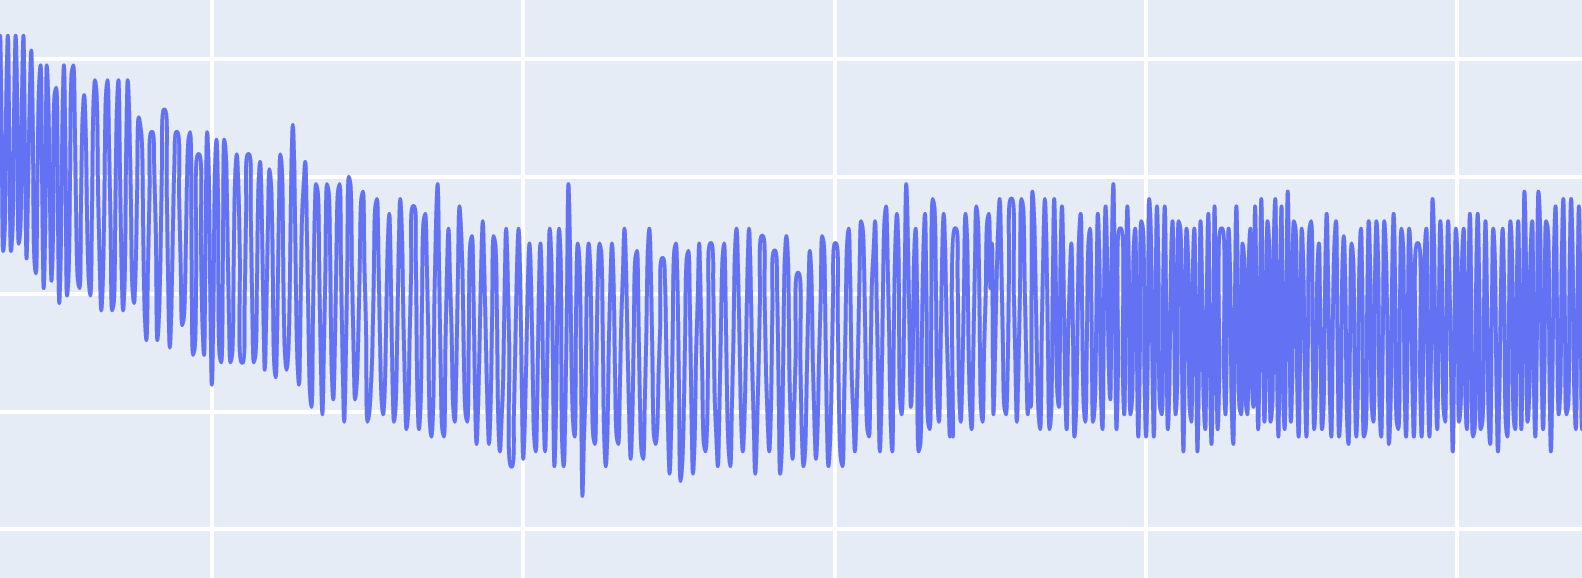
So now consider, if had to determine the point where the curve starts it rise.
With so much of noise there is a very high probability of getting false positive data point. Also imagine the performance of the algorithm with so much fluctuation in the data.
I would start with some signal processing basics , which are essential to understand before we jump into code.
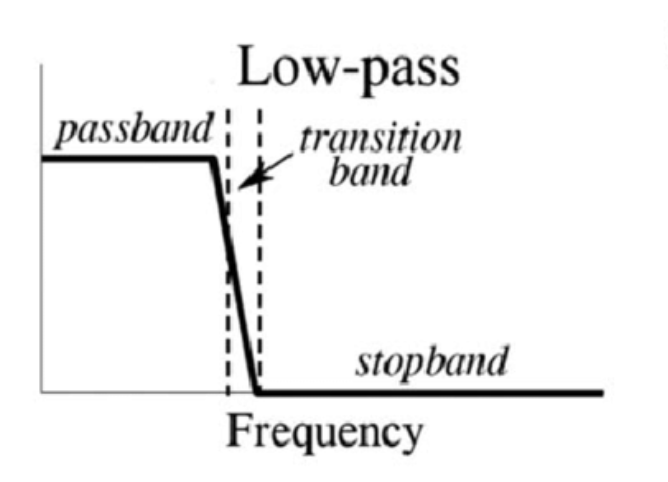
Basics : Band Pass Filters
The four common filters.
- Low-pass filter, passes signals with a frequency lower than a certain cutoff frequency and attenuates signals with frequencies higher than the cutoff frequency.
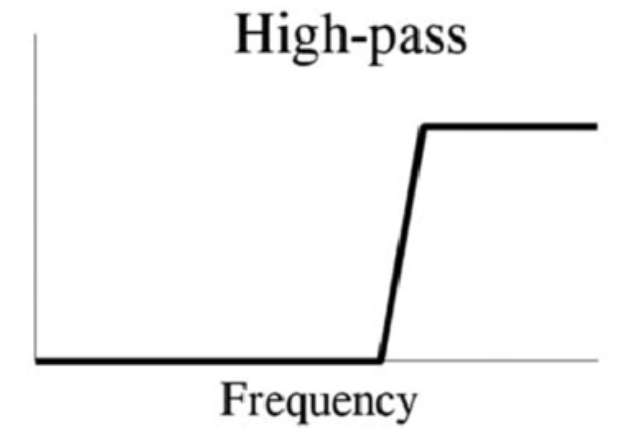
- High-pass filter, passes signals with a frequency higher than a certain cutoff frequency and attenuates signals with frequencies lower than the cutoff frequency.
- A band-pass filter can be formed by cascading a high-pass filter and a low-pass filter.
- A band-reject filter is a parallel combination of low-pass and high-pass filters.
Now lets see a sample data ,which would be ideal to work with
As you can see the distortion caused by a lot of noise has deformed actual data which is a sin wave data.
- Sample Period ? 5 sec (t)
- Sampling Freq ? 30 samples / s , i.e 30 Hz (fs)
- Total Samples ? (fs x t) = 150
- Signal Freq = 6 signal / 5 sec = 1.2 Hz
This means we need a filter that would pass the signal with at most frequency of 1.2 Hz , However in real life the signal frequency may fluctuate , hence it would be good if we choose a slightly higher number than the ideally calculated frequency.
You can also try using FFT (Fast Fourier Transform) to find investigate the frequencies and amplitudes of the Signal vs the noise components, more details along with code can be found here
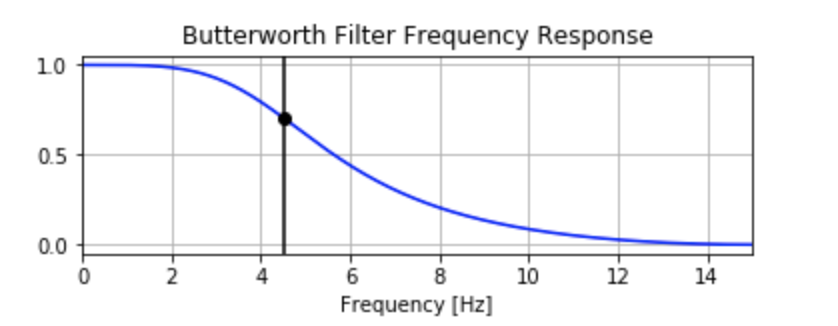
Butterworth Filter
The frequency response of the Butterworth filter is maximally flat (i.e. has no ripples) in the passband and rolls off towards zero in the stopband, hence its one of the most popular low pass filter.
Nyquist Frequency
The term Nyquist is often used to describe the Nyquist sampling rate or the Nyquist frequency.
The Nyquist rate or frequency is the minimum rate at which a finite bandwidth signal needs to be sampled to retain all of the information. If a time series is sampled at regular time intervals dt, then the Nyquist rate is just 1/(2 dt ).
Lets jump into Code
Step 1 : Define the filter requirements
- Sample Period ? 5 sec (t)
- Sampling Freq ? 30 samples / s , i.e 30 Hz (fs)
- Total Samples ? (fs x t) = 150
- Signal Freq = 6 signal / 5 sec = 1.2 Hz
- Nyquist Frequency = 0.5 * fs
- order = Polynomial order of the signal
import numpy as npfrom scipy.signal import butter,filtfilt# Filter requirements.T = 5.0 # Sample Periodfs = 30.0 # sample rate, Hzcutoff = 2 # desired cutoff frequency of the filter, Hz , slightly higher than actual 1.2 Hznyq = 0.5 * fs # Nyquist Frequencyorder = 2 # sin wave can be approx represented as quadraticn = int(T * fs) # total number of samples
Step 2 : Create some sample data with noise
# sin wavesig = np.sin(1.2*2*np.pi*t)# Lets add some noisenoise = 1.5*np.cos(9*2*np.pi*t) + 0.5*np.sin(12.0*2*np.pi*t)data = sig + noise
Step 3 : Filter implementation using scipy
def butter_lowpass_filter(data, cutoff, fs, order): normal_cutoff = cutoff / nyq # Get the filter coefficients b, a = butter(order, normal_cutoff, btype=’low’, analog=False) y = filtfilt(b, a, data) return y
Step 4 : Filter and plot the data
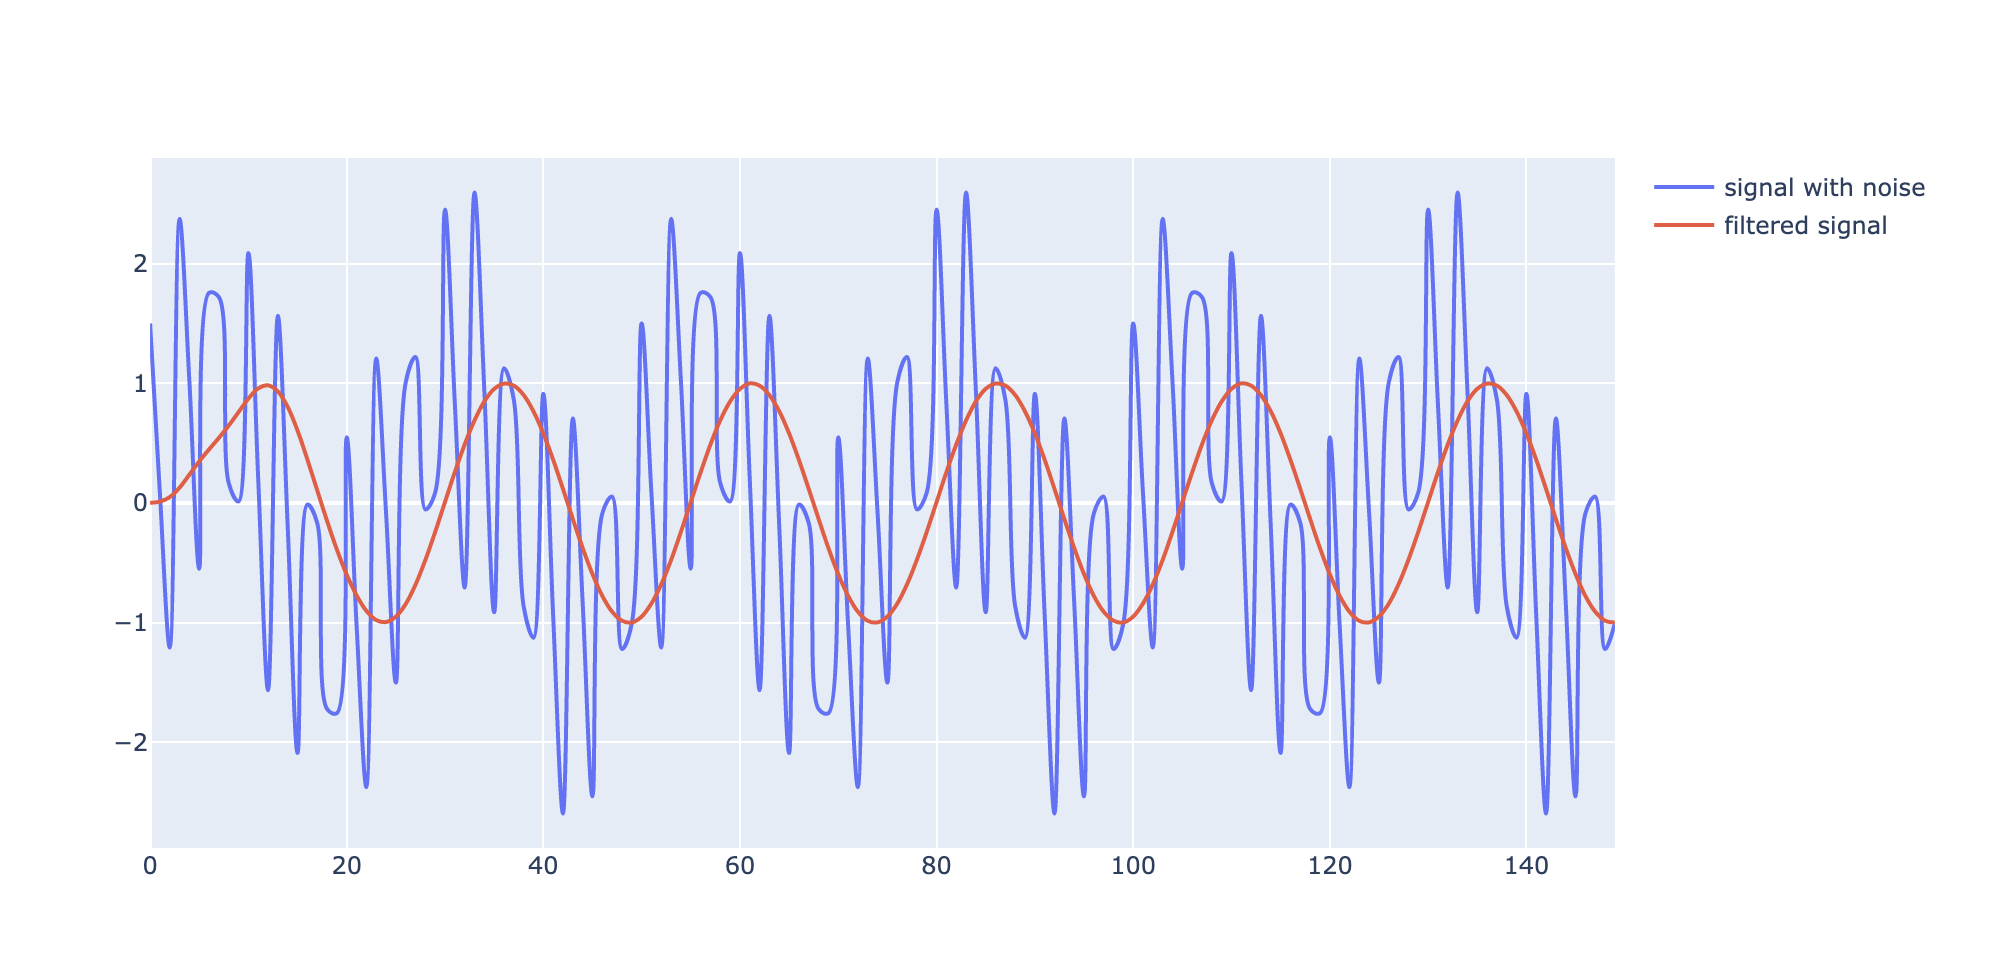
# Filter the data, and plot both the original and filtered signals.y = butter_lowpass_filter(data, cutoff, fs, order)fig = go.Figure()fig.add_trace(go.Scatter( y = data, line = dict(shape = ‘spline’ ), name = ‘signal with noise’ ))fig.add_trace(go.Scatter( y = y, line = dict(shape = ‘spline’ ), name = ‘filtered signal’ ))fig.show()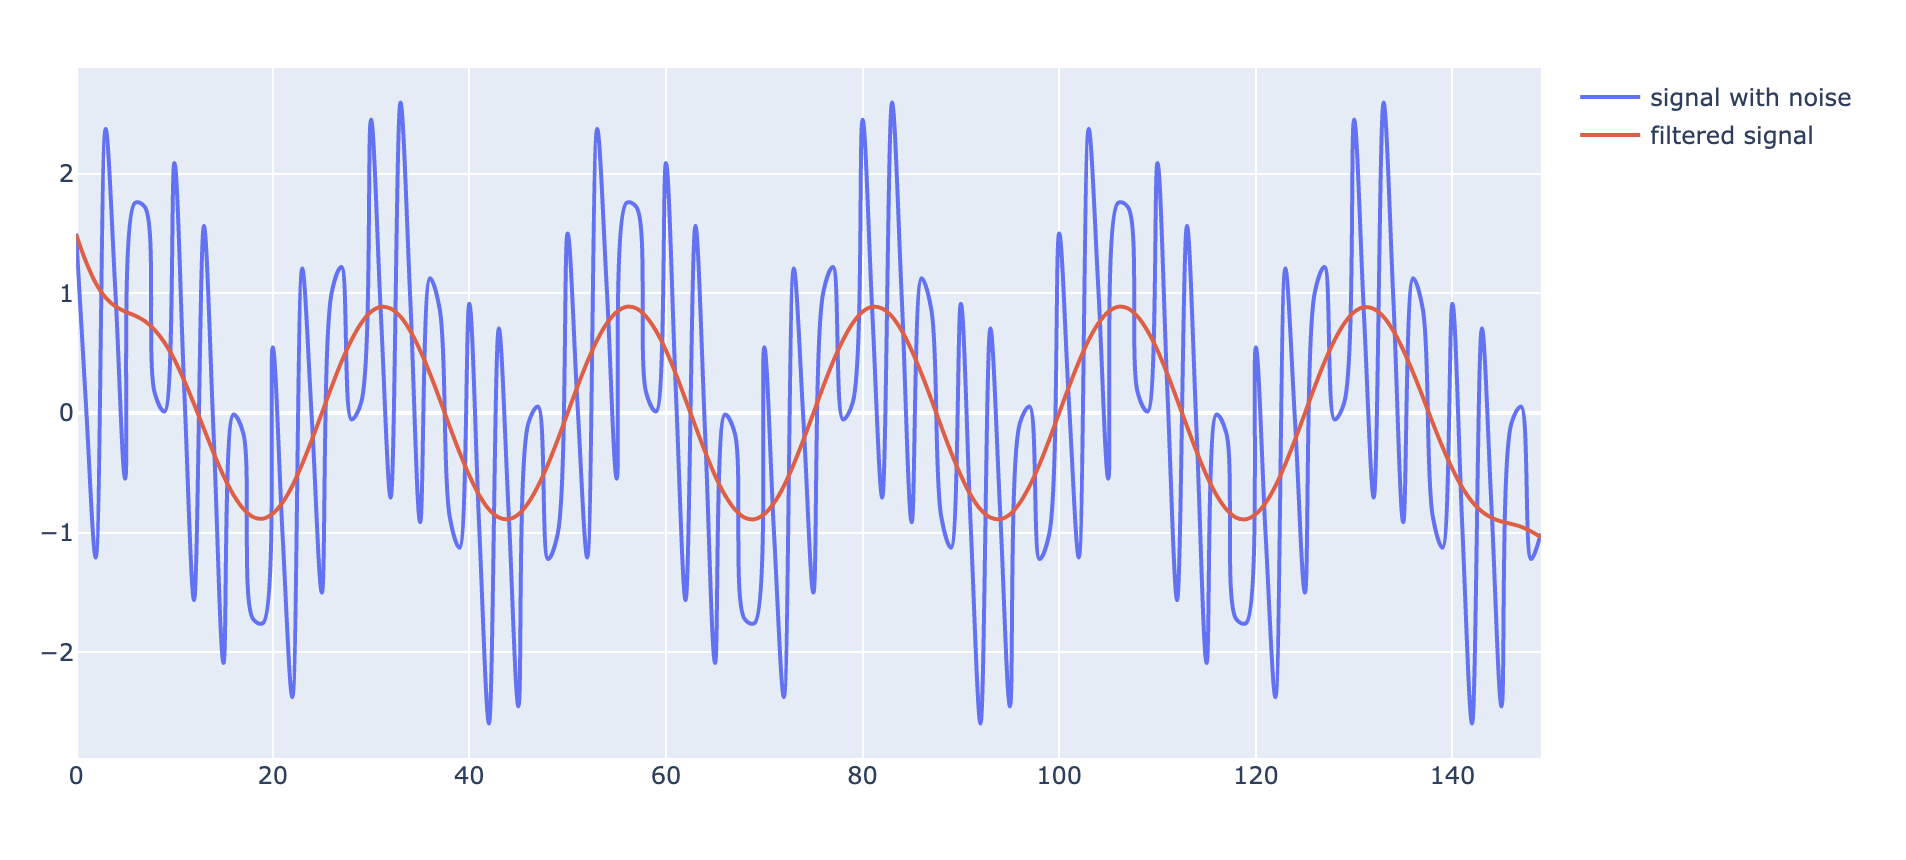
It?s surprising how smoothly the filtered signal aligns to the data, feels like ?butter?.

And that?s it for today ! Happy Filtering
Check out my other articles
