Often times ?raw? Data received for analysis are impossible to analyze due to the format they are in for example dataset might contain missing values or column names might be too long for analyst to type again and again. This is where process of Data Munging comes to handy. Basically, Data Munging is a process of converting ?dirty data? into clean data that can be use for further analysis . After performing Exploratory Data Analysis (EDA), many times analyst will try to rename column names to shorter names so that analysis can be carried out with ease. Renaming the column names/variable names can be done in multiple ways in R. However, this post will enable analyst to identify index numbers of rows and columns. So that renaming of rows or column name can be carried out based on index numbers,thus saving time for further analysis on the dataset.
Let?s get started?
Getting Column Index numbers
Step 1: Setting up working directory and Dataset Importing
Import Dataset and select appropriate working directory. If you are not sure how to setup working directory to desktop please follow my first post (For this post,I will use the Dataset that was obtained from Kaggle.com and was used in first post).
Note: Dataset contains 63 Variables and 17938 observations after removing NA?s from Dataset.
Step 2: Finding Column index numbers
- Type below code in R
colnames(df) #Colnames will return column names present in the dataset,df=DataFrame name
 Output of above code
Great ! we can see column names and index numbers of few columns. How can we get index numbers of entire column names?
2. Simple, just use data.frame() function around colnames code as shown below.
Type below R-code.
data.frame(colnames(df)) #Returns column index numbers in table format,df=DataFrame name Output of above code
Eureka! we have achieved what we were looking for. The column index numbers are circled in red in above image. The names next to the numbers corresponds to our variable/column names.
Note: Since dataset contained 63 variables only few variables were displayed in screenshot. However, your output will contained rest of the variables.
Getting Row Index numbers
Let?s repeat the steps we used to get column index numbers.
rownames(df) #Rownames will return rownumbers present in Dataset,df=DataFrame name Output of the above R code
Since, the index numbers are of integer datatype it will be better if we wrap as.integer() function around data.frame() function. Let?s see below how it can be done.
data.frame(as.integer(rownames(df))) #Returns Row index numbers in table format ,df=DataFrame name Output of above code
The Row Index numbers are highlighted in red, and row names are the numbers next to them i.e ?2? on left side is the index number and ?2? on right hand side is the row number. In this case, both of them as same.
Note: Since dataset contained 17938 observations/rows only few row numbers were displayed in screenshot. However, your output will contain all index numbers and row names.
Bonus:
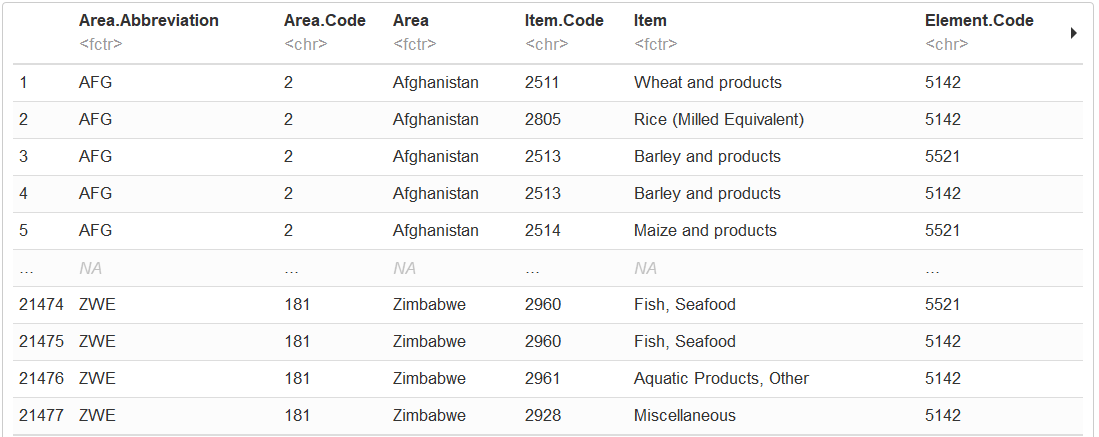
Let?s take a look at Head (Top 5 observations) and Tail (Last 5 observations)of the Dataset together in one Output. For this step ?Psych? package is needed. Please download ?Psych? package prior to processing to this step.
Assuming ?Psych? package is loaded, run below code in R.
R code: headTail(df,5) #Assuming “Psych” package is loaded , df=DataFrame name
 Output of Head and Tail of the Dataset
Summary:
- We learned how to find index numbers of columns and rows in a dataset.
- We learned how to view first five(Head) and last five (Tail) observations in a dataset.


