Figure out ahead of time if this is a person you want to follow

In this article, I?ll show you how to get and analyze the sentiment of tweets from a Twitter user using sentiment analysis.
?Sentiment analysis is the measurement of neutral, negative, and positive language. It is a way to evaluate spoken or written language to determine if the expression is favorable (positive), unfavorable (negative), or neutral, and to what degree.? ? Clarabridge
?Sentiment analysis: the process of computationally identifying and categorizing opinions expressed in a piece of text, especially in order to determine whether the writer?s attitude towards a particular topic, product, etc. is positive, negative, or neutral.?? Oxford English Dictionary
There are many methods and algorithms to implement sentiment-analysis systems, which can be classified as:
- Rule-based systems that perform sentiment analysis based on a set of manually crafted rules
- Automatic systems that rely on machine learning techniques to learn from data
- Hybrid systems that combine both rule-based and automatic approaches
Before you can start analyzing tweets and getting their sentiments from Twitter, you?ll first need a Twitter account yourself. You?ll need to create a Twitter application to get your keys.
The Twitter user whose tweets I?ll be analyzing is none other than Microsoft co-founder Bill Gates. I chose Bill Gates because he?s trying to make a positive impact on the world, so I suspect his tweets will also be mostly positive.
If you?d prefer not to read this article and would like a video representation of it, you can check out the YouTube video below. It goes through everything in this article with a little more detail and will help make it easy for you to start developing your own program ? or you can use both as supplementary materials for learning.
Start Programming
I?ll start by stating what I want this program to do. This program will analyze the sentiment of a Twitter account. More specifically, it?ll analyze the tweets/posts of one of Microsoft founders, Bill Gates.
# Description : This is a sentiment analysis program that parses the tweets fetched from Twitter using Python
Import The Libraries and Packages
Next, import some of the libraries that?ll be used within this program.
# Import the librariesimport tweepyfrom textblob import TextBlobfrom wordcloud import WordCloudimport pandas as pdimport numpy as npimport reimport matplotlib.pyplot as pltplt.style.use(‘fivethirtyeight’)
Load the Data and Authenticate to Twitter
I?m using Google?s website to write this program, so I?ll be using Google?s library to upload the CSV file that contains my Twitter app keys. You can just input your keys directly into the variables if you want.
# Load the datafrom google.colab import filesuploaded = files.upload()# Get the datalog = pd.read_csv(“Login.csv”)
Next, I?ll store the Twitter keys/API credentials in variables.
# Twitter Api CredentialsconsumerKey = log[“key”][0]consumerSecret = log[“key”][1]accessToken = log[“key”][2]accessTokenSecret = log[“key”][3]
Now, it?s time to create the authentication object. Set the access token and access token secret, and authenticate to Twitter.
# Create the authentication objectauthenticate = tweepy.OAuthHandler(consumerKey, consumerSecret) # Set the access token and access token secretauthenticate.set_access_token(accessToken, accessTokenSecret) # Creating the API object while passing in auth informationapi = tweepy.API(authenticate, wait_on_rate_limit = True)
Extract and Analyze the Data
It?s time to extract the tweets of a Twitter user. First, I?ll get the last 100 posts for the Twitter user Bill Gates and show only the five most recent tweets.
# Extract 100 tweets from the twitter userposts = api.user_timeline(screen_name=”BillGates”, count = 100, lang =”en”, tweet_mode=”extended”)# Print the last 5 tweetsprint(“Show the 5 recent tweets:n”)i=1for tweet in posts[:5]: print(str(i) +’) ‘+ tweet.full_text + ‘n’) i= i+1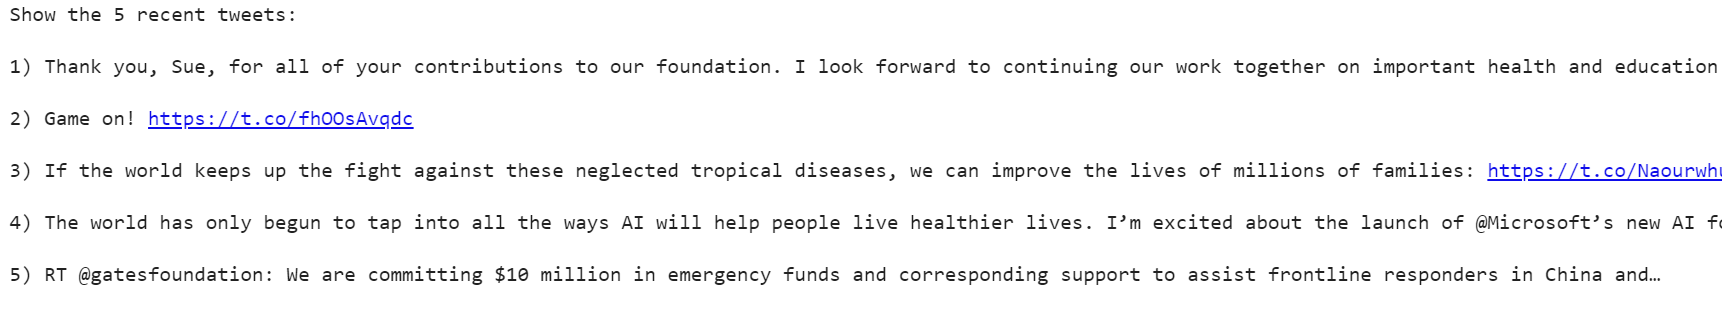 The five most recent tweets
Create a DataFrame with a column called Tweets that?ll contain the posts from the Twitter user, and then show the first five rows.
# Create a dataframe with a column called Tweetsdf = pd.DataFrame([tweet.full_text for tweet in posts], columns=[‘Tweets’])# Show the first 5 rows of datadf.head()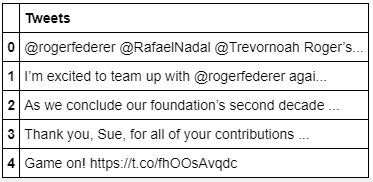
The data is a little dirty because it contains the @ symbol, hyperlinks, RTs, and may contain hash tags, so I?ll clean it up by creating a function to remove these symbols from the tweets. Then, I?ll apply that function to the tweets and show the results.
# Create a function to clean the tweetsdef cleanTxt(text): text = re.sub(‘@[A-Za-z0?9]+’, ”, text) #Removing @mentions text = re.sub(‘#’, ”, text) # Removing ‘#’ hash tag text = re.sub(‘RT[s]+’, ”, text) # Removing RT text = re.sub(‘https?://S+’, ”, text) # Removing hyperlink return text# Clean the tweetsdf[‘Tweets’] = df[‘Tweets’].apply(cleanTxt)# Show the cleaned tweetsdf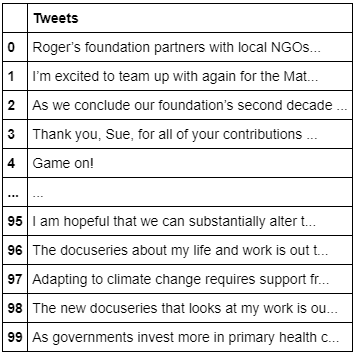
I want to add the tweets? subjectivity and polarity to the DataFrame. In order to do this, I?ll create two functions: one to get the tweets called Subjectivity (how subjective or opinionated the text is ? a score of 0 is fact, and a score of +1 is very much an opinion) and the other to get the tweets called Polarity (how positive or negative the text is, ? score of -1 is the highest negative score, and a score of +1 is the highest positive score).
Next I?ll store the results into two columns ? one called Subjectivity and the other called Polarity ? and show the results.
# Create a function to get the subjectivitydef getSubjectivity(text): return TextBlob(text).sentiment.subjectivity# Create a function to get the polaritydef getPolarity(text): return TextBlob(text).sentiment.polarity# Create two new columns ‘Subjectivity’ & ‘Polarity’df[‘Subjectivity’] = df[‘Tweets’].apply(getSubjectivity)df[‘Polarity’] = df[‘Tweets’].apply(getPolarity)# Show the new dataframe with columns ‘Subjectivity’ & ‘Polarity’df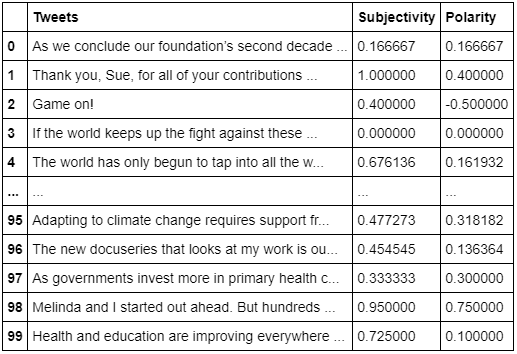
Let?s see how well the sentiments are distributed. A good way to accomplish this task is by understanding the common words by plotting word clouds.
A word cloud (also known as text clouds or tag clouds) is a visualization, the more a specific word appears in the text, the bigger and bolder it appears in the word cloud.
Let?s visualize all the words in the data using the word-cloud plot. It looks like the word ?health? appears a lot in Bill Gates past 100 tweets.
# word cloud visualizationallWords = ‘ ‘.join([twts for twts in df[‘Tweets’]])wordCloud = WordCloud(width=500, height=300, random_state=21, max_font_size=110).generate(allWords)plt.imshow(wordCloud, interpolation=”bilinear”)plt.axis(‘off’)plt.show()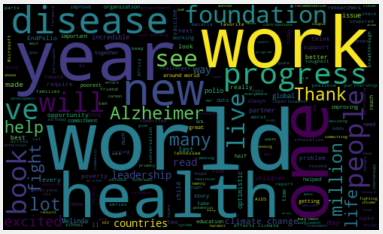
Create a function to compute the negative (-1), neutral (0), and positive (+1) analysis, and add the information to a new column called Analysis. Then, show the results.
# Create a function to compute negative (-1), neutral (0) and positive (+1) analysisdef getAnalysis(score):if score < 0: return ‘Negative’elif score == 0: return ‘Neutral’else: return ‘Positive’df[‘Analysis’] = df[‘Polarity’].apply(getAnalysis)# Show the dataframedf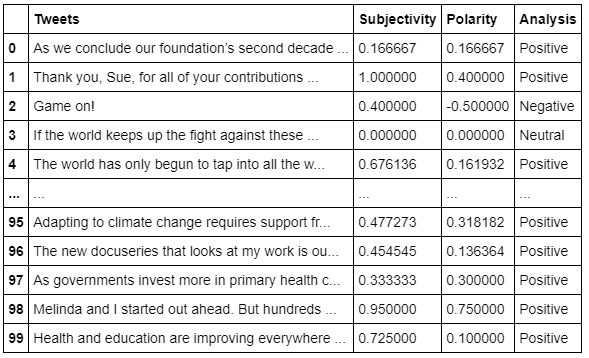
Print the positive tweets in ascending order. The most positive tweet is the #1 tweet.
# Printing positive tweets print(‘Printing positive tweets:n’)j=1sortedDF = df.sort_values(by=[‘Polarity’]) #Sort the tweetsfor i in range(0, sortedDF.shape[0] ): if( sortedDF[‘Analysis’][i] == ‘Positive’): print(str(j) + ‘) ‘+ sortedDF[‘Tweets’][i]) print() j= j+1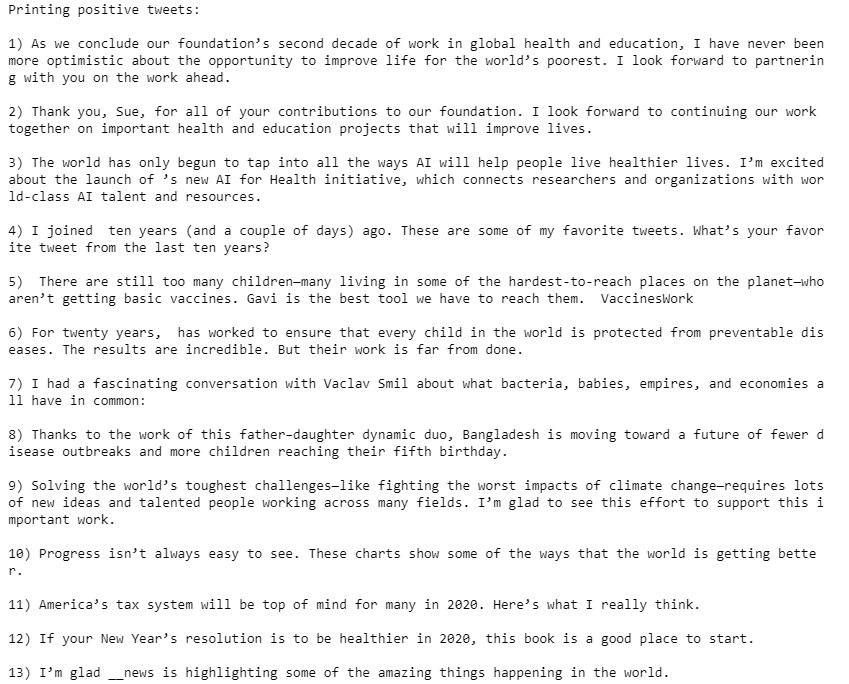
Print the negative tweets in descending order. The most negative tweet is the #1 tweet.
# Printing negative tweets print(‘Printing negative tweets:n’)j=1sortedDF = df.sort_values(by=[‘Polarity’],ascending=False) #Sort the tweetsfor i in range(0, sortedDF.shape[0] ): if( sortedDF[‘Analysis’][i] == ‘Negative’): print(str(j) + ‘) ‘+sortedDF[‘Tweets’][i]) print() j=j+1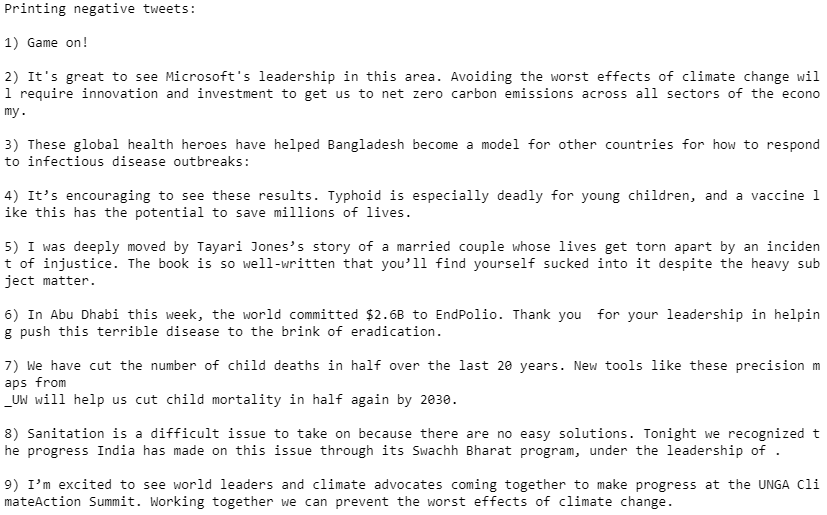
Plot the polarity and subjectivity as a scatter plot. It looks like the majority of the tweets are positive, as many of the points are on the right side of the polarity at value 0.00.
# Plotting plt.figure(figsize=(8,6)) for i in range(0, df.shape[0]): plt.scatter(df[“Polarity”][i], df[“Subjectivity”][i], color=’Blue’) # plt.scatter(x,y,color) plt.title(‘Sentiment Analysis’) plt.xlabel(‘Polarity’) plt.ylabel(‘Subjectivity’) plt.show()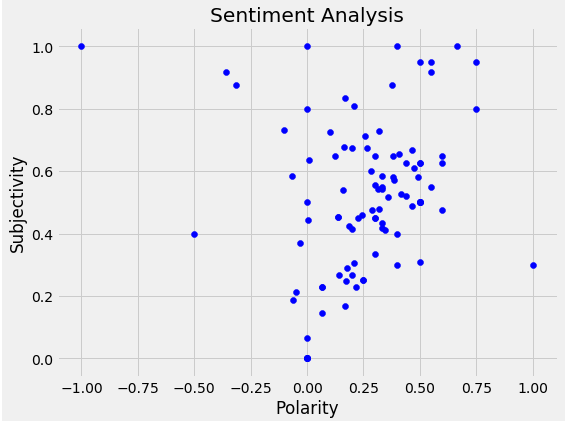
Print the percentage of positive tweets. About 81/100 of the tweets are considered positive tweets.
# Print the percentage of positive tweetsptweets = df[df.Analysis == ‘Positive’]ptweets = ptweets[‘Tweets’]ptweetsround( (ptweets.shape[0] / df.shape[0]) * 100 , 1)![]()
Print the percentage of negative tweets. About 9/100 tweets are considered negative tweets.
# Print the percentage of negative tweetsntweets = df[df.Analysis == ‘Negative’]ntweets = ntweets[‘Tweets’]ntweetsround( (ntweets.shape[0] / df.shape[0]) * 100, 1)![]()
Show the value counts. Now we can see 81 tweets are positive, 10 are neutral, and 9 are negative.
# Show the value countsdf[‘Analysis’].value_counts()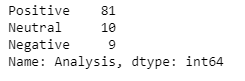
Visually show the value counts.
# Plotting and visualizing the countsplt.title(‘Sentiment Analysis’)plt.xlabel(‘Sentiment’)plt.ylabel(‘Counts’)df[‘Analysis’].value_counts().plot(kind = ‘bar’)plt.show()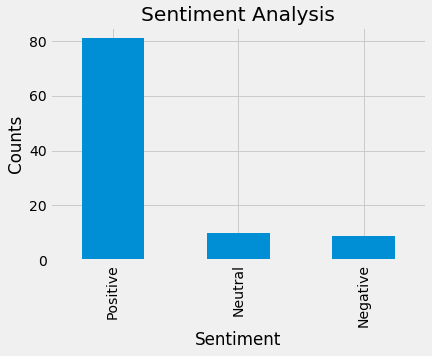
Conclusion
That?s all folks!
If you?re also interested in reading more on machine learning to immediately get started with problems and examples, then I strongly recommend you check out ?Hands-on Machine Learning with Scikit-Learn and TensorFlow: Concepts, Tools, and Techniques to Build Intelligent Systems.?
It?s a great book for helping beginners learn how to write machine learning programs and for understanding machine learning concepts.
Thanks for reading this article. I hope it?s helpful to you all!

