 We?ll use Aaron Rodgers? performance over the 49ers from October 2018 as an example to demonstrate the formula for calculating NFL passer rating in a spreadsheet.
Passer rating is a common formula used to analyze the effectiveness of a quarterback?s performance.
Historically, the term ?quarterback rating? was used interchangeably with passer rating. However, the advent of ESPN?s proprietary QBR metric means passer rating is almost exclusively used today.
Recently, I was working on a project for The Power Sweep, where I cover the Green Bay Packers to help make our readers and podcast listeners smarter Packers fans.
The project called for me to calculate passer rating on a row-by-row basis as well as summarized data. While I could use SUM and AVERAGE to calculate the per-game averages for simple stats like passing yards, touchdowns, completions, and attempts, that strategy doesn?t work for passer rating.
When I searched online for a formula I could use to calculate passer rating, I couldn?t find what I was looking for ? a simple, easy to use NFL passer rating formula that was ready for me to copy and paste into my spreadsheet.
The NFL calculates passer rating differently than college football, and my purpose is to show you how to calculate the NFL passer rating in Excel or Google Sheets.
Use these columns in Excel or Google Sheets to organize NFL passing stats:
- Completions in Column B
- Attempts in Column C
- Passing Yards in Column D
- Touchdowns in Column E
- Interceptions in Column F
Excel or Google Sheets formula to calculate NFL passer rating
NFL Passer Rating =IFERROR((((IF((((G2/H2)-0.3)*5)>2.375,2.375,IF((((G2/H2)-0.3)*5)<0,0,((G2/H2)-0.3)*5)))+(IF(((I2/H2)-3)*0.25>2.375,2.375,IF(((I2/H2)-3)*0.25<0,0,((I2/H2)-3)*0.25)))+(IF((((J2/H2))*20)>2.375,2.375,IF((((J2/H2))*20)<0,0,(J2/H2)*20)))+(IF(2.375-((K2/H2))>2.375,2.375,IF(2.375-((K2/H2))<0,0,2.375-(K2/H2)))))/6)*100,0)
A few notes:
- This formula will work in both Microsoft Excel or Google Sheets.
- This formula assumes your data is in Row 2 with headers in Row 1.
- These steps are designed for data that is in a single horizontal row, though you can adapt the formula if your data is configured vertically.
- 12/2019 Update: I?ve updated the formula to only allow for results between 0 and 158.3.
If you need more detailed instructions on how this formula works, see below. Otherwise, #GoPackGo!
For our example, we will use Aaron Rodgers? stats from his performance against the San Francisco 49ers on Monday, October 15, 2018.
Step 1: Understanding the formula for passer rating
Passer rating is calculated using a quarterback?s passing attempts, completions, yards, touchdowns, and interceptions. The highest possible passer rating possible using the NFL?s formula is 158.3, and you cannot have a passer rating below 0.
The passer rating formula is a combination of the values of four smaller formulas:
- Formula 1: Take the completions/attempts, subtract .3 and multiply the result by 5.
- Formula 2: Take the passing yards/attempts, subtract 3 and multiply the result by .25.
- Formula 3: Take the touchdowns/attempts and multiply the result by 20.
- Formula 4: Take 2.375 minus the result of interceptions/attempts multiplied by 25.
After calculating each of the four formulas, there is one final formula required to generate your passer rating:
- NFL Passer Rating = The sum of the results of Formula 1, Formula 2, Formula 3, and Formula 4 divided by 6. That result is then multiplied by 100.
Step 2: Organize and collect your data
One of the best tools to capture raw stats is Pro Football Reference. Their box scores are formatted like this:
 Example of a box score from Pro Football Reference.
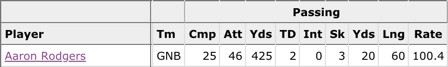
The official box score on the NFL?s website doesn?t give you as detailed of data on Rodgers? performance, but gives us the necessary ingredients to calculate passer rating:
 Example of a box score from NFL.com.
Regardless of the source you use to capture your data, it is vital to put the completions and attempts in separate columns.
Because Pro Football Reference organizes their completions and attempts in separate columns already, I would recommend using their data if you are working on a large scale project where you need to calculate multiple passer ratings.
Additionally, if you already have a data set where the completions and attempts are combined into one cell, you can use Excel?s Text to Columns tool to separate the values into different columns.
I?ve copied and pasted the values from Pro Football Reference?s box score of the game into a spreadsheet and formatted it for clarity:
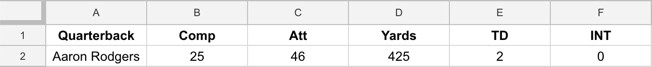 Make sure each data point is in separate columns and in this order, starting with completions in Column B.
Step 3: Verify your data and copy and paste the formula
After your data is in your spreadsheet, double check a few things:
? Do you have completions in a column before attempts?? Does your data start in Column B?? If you manually copied over the data, did you make any typos?? Are there any extra columns between the completions, attempts, passing yards, touchdowns and interceptions columns? If so, you will need to move them in order for the formula to produce a correct result without any modifications.? Is your data in Row 2? If not, you will need to either modify the formula or move the data so that it is in Row 2.
Now, add a heading in for Passer Rating:
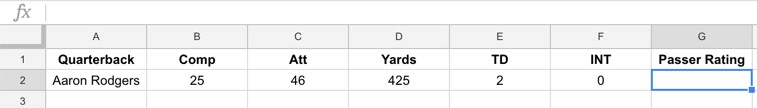 It?s a good idea to calculate passer rating in Column G, next to the data points you?re measuring.
Copy the formula below and paste it into cell G2.
=IFERROR((((IF((((G2/H2)-0.3)*5)>2.375,2.375,IF((((G2/H2)-0.3)*5)<0,0,((G2/H2)-0.3)*5)))+(IF(((I2/H2)-3)*0.25>2.375,2.375,IF(((I2/H2)-3)*0.25<0,0,((I2/H2)-3)*0.25)))+(IF((((J2/H2))*20)>2.375,2.375,IF((((J2/H2))*20)<0,0,(J2/H2)*20)))+(IF(2.375-((K2/H2))>2.375,2.375,IF(2.375-((K2/H2))<0,0,2.375-(K2/H2)))))/6)*100,0)
That?s it! Happy calculating.
Gary Zilavy is a digital marketer and business intelligence analyst by day and covers the Packers for The Power Sweep in his spare time.

