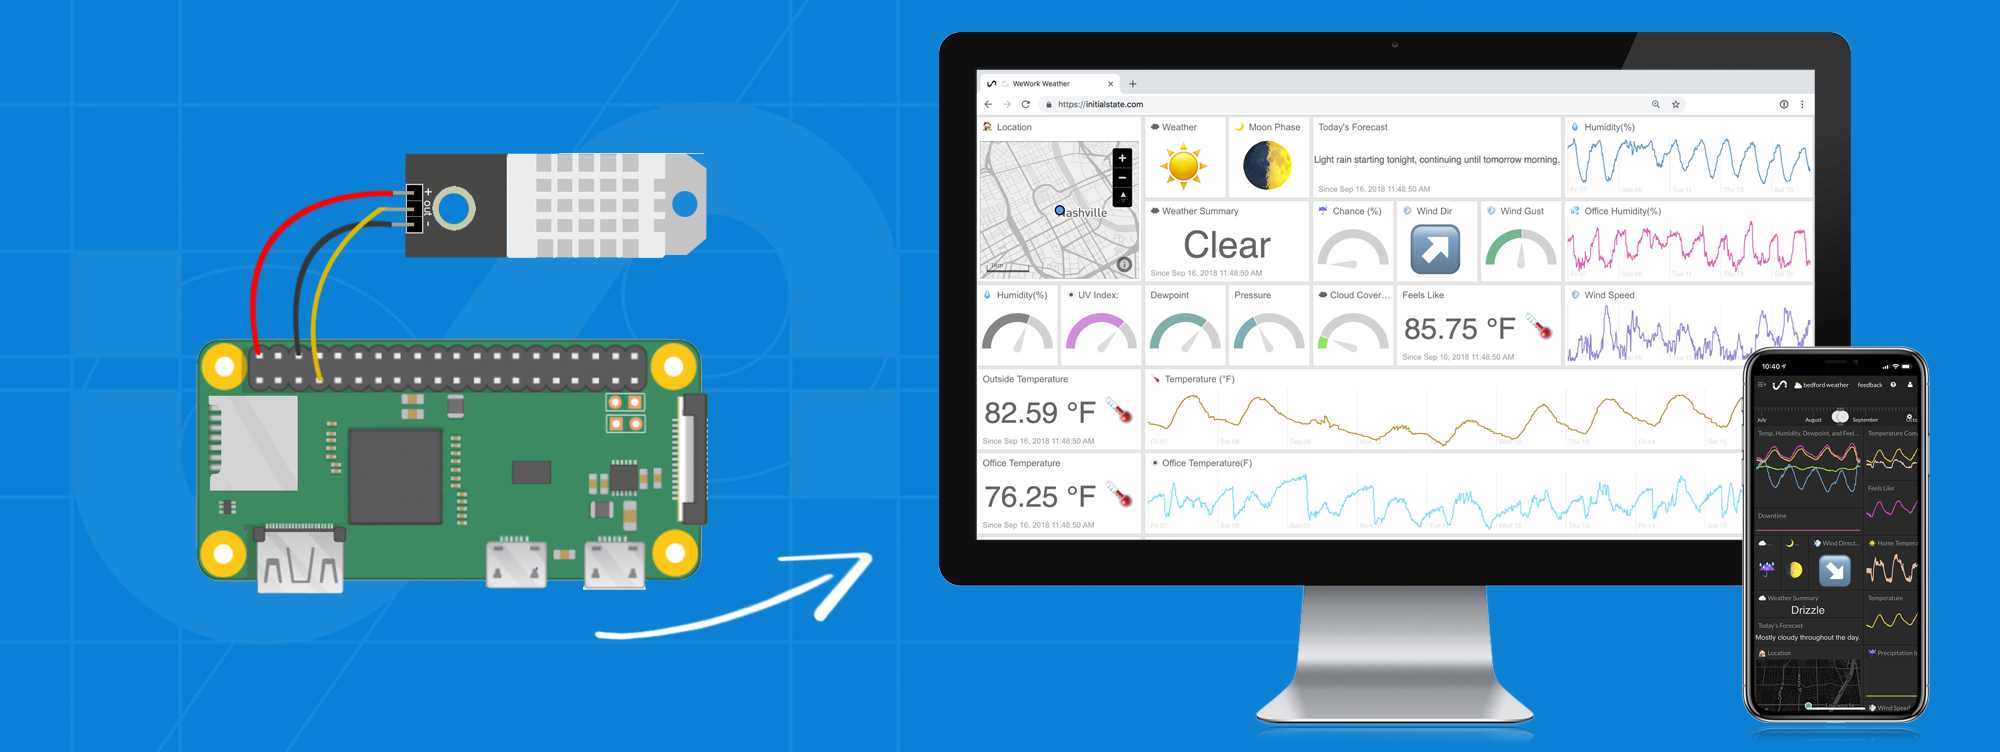
Temperature and humidity are vital data points in today?s industrial world. Monitoring environmental data for server rooms, commercial freezers, and production lines is necessary to keep things running smoothly. There are lots of solutions out there ranging from basic to complex and it can seem overwhelming on what your business needs and where to start.
We?ll walk through how to build and use a Raspberry Pi temperature sensor with different temperature sensors. This is a good place to start since these solutions are inexpensive, easy to do, and gives you a foundation to build off of for other environmental monitoring.
Raspberry Pi
A Raspberry Pi is an inexpensive single board computer that will allow you to connect to a temperature sensor and stream the data to a data visualization software. Raspberry Pi?s started out as a learning tool and have evolved to an industrial workplace tool. The ease of use and ability to code with Python, the fastest growing programming language, has made them a go to solution.
You?ll want a Raspberry Pi that has WiFi built in, which are any model 3, 4, and zero W/WH. Between those you can choose based on pricing and features. The Zero W/WH is the cheapest but if you need more functionality you can choose between the 3 and 4. You can only buy one Zero W/WH at a time due to limitations by the Raspberry Pi Foundation. Whatever Pi you choose, make sure to purchase a charger since that is how you?ll power the Pi and an SD card with Raspbian to make installation of the operating system as easy as possible.
There are other single board computer that can work as well, but that?s for another time and another article.
Sensors
There are four sensors we recommend using because they are inexpensive, easy to connect, and give accurate readings; DSB18B20, DHT22, BME280, and Raspberry Pi Sense HAT.
DHT22 ? This temperature and humidity sensor has temperature accuracy of +/- 0.5 C and a humidity range from 0 to 100 percent. It is simple to wire up to the Raspberry Pi and doesn?t require any pull up resistors.
DSB18B20 ? This temperature sensor has a digital output, which works well with the Raspberry Pi. It has three wires and requires a breadboard and resistor for the connection.
BME280 ? This sensor measures temperature, humidity, and barometric pressure. It can be used in both SPI and I2C.
Sense HAT ? This is an add on board for Raspberry Pi that has LEDs, sensors, and a tiny joystick. It connects directly on to the GPIO on the Raspberry Pi but using a ribbon cable gives you more accurate temperature readings.
Raspberry Pi Setup
If this is the first time setting up your Raspberry Pi you?ll need to install the Raspbian Operating System and connect your Pi to WiFi. This will require a monitor and keyboard to connect to the Pi. Once you have it up and running and connected to the WiFI, your Pi is ready to go.
Initial State Account
You?ll need somewhere to send your data to keep a historical log and view the real-time data stream so we will use Initial State. Go to https://iot.app.initialstate.com and create a new account or log into your existing account.
Next, we need to install the Initial State Python module onto your Pi. At a command prompt (don?t forget to SSH into your Pi first), run the following command:
$ cd /home/pi/$ curl -sSL https://get.initialstate.com/python -o – | sudo bash
After you enter the curl command in the command prompt you will see something similar to the following output to the screen:
pi@raspberrypi ~ $ curl -sSL https://get.initialstate.com/python -o – | sudo bashPassword:Beginning ISStreamer Python Easy Installation!This may take a couple minutes to install, grab some coffee :)But don’t forget to come back, I’ll have questions later!Found easy_install: setuptools 1.1.6Found pip: pip 1.5.6 from /Library/Python/2.7/site-packages/pip-1.5.6- py2.7.egg (python 2.7)pip major version: 1pip minor version: 5ISStreamer found, updating…Requirement already up-to-date: ISStreamer in /Library/Python/2.7/site-packagesCleaning up…Do you want automagically get an example script? [y/N]Where do you want to save the example? [default: ./is_example.py]Please select which Initial State app you’re using:1. app.initialstate.com2. [NEW!] iot.app.initialstate.comEnter choice 1 or 2:Enter iot.app.initialstate.com user name:Enter iot.app.initialstate.com password:
When prompted to automatically get an example script, type y. This will create a test script that we can run to ensure that we can stream data to Initial State. The next prompt will ask where you want to save the example file. You can either type a custom local path or hit enter to accept the default location. Finally, you?ll be asked which Initial State app you are using. If you?ve recently created an account, select option 2, enter your user name and password. After that the installation will be complete.
Let?s take a look at the example script that was created.
$ nano is_example.py
On line 15, you will see a line that starts with streamer = Streamer(bucket_ …. This lines creates a new data bucket named ?Python Stream Example? and is associated with your account. This association happens because of the access_key=?…? parameter on that same line. That long series of letters and numbers is your Initial State account access key. If you go to your Initial State account in your web browser, click on your username in the top right, then go to ?my settings?, you will find that same access key here under ?Streaming Access Keys?.
 Initial State Stream Access Keys
Every time you create a data stream, that access key will direct that data stream to your account (so don?t share your key with anyone).
Run the test script to make sure we can create a data stream to your Initial State account. Run the following:
$ python is_example.py
Go back to your Initial State account in your web browser. A new data bucket called ?Python Stream Example? should have shown up on the left in your log shelf (you may have to refresh the page). Click on this bucket and then click on the Waves icon to view the test data.
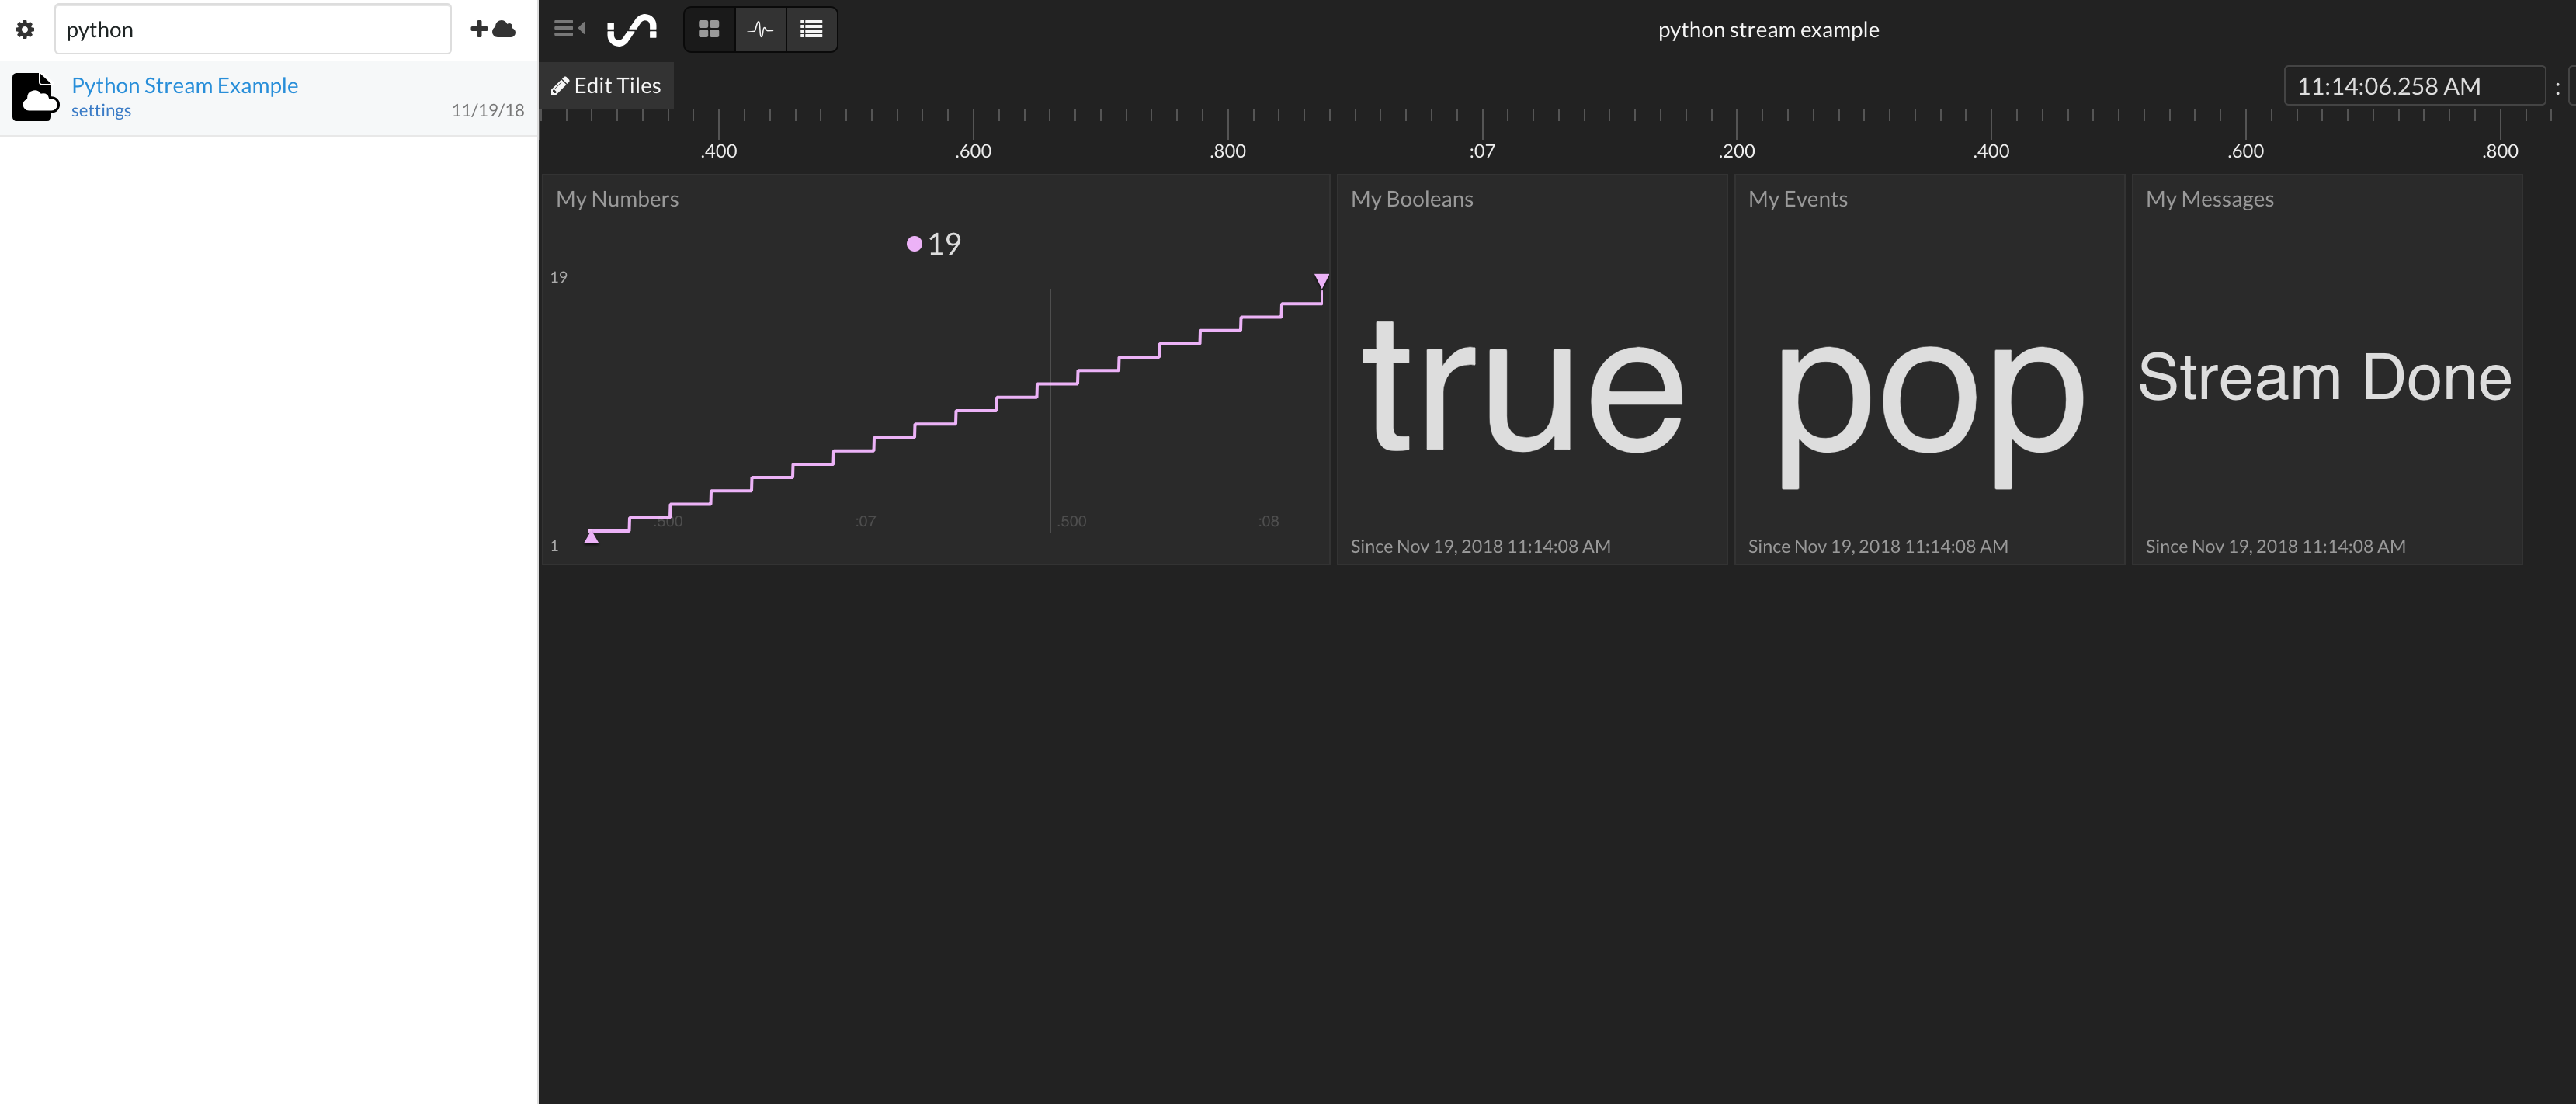 Initial State Python Stream Example dashboard
If you are using Python 3 you can install the Initial State Streamer Module you can install using the following command:
pip3 install ISStreamer
Now we are ready to setup the temperature sensor with the Pi to stream temperature to a dashboard.
DHT22 Solution
You?ll need the following items to build this solution:-DHT22 Temperature and Humidity Sensor
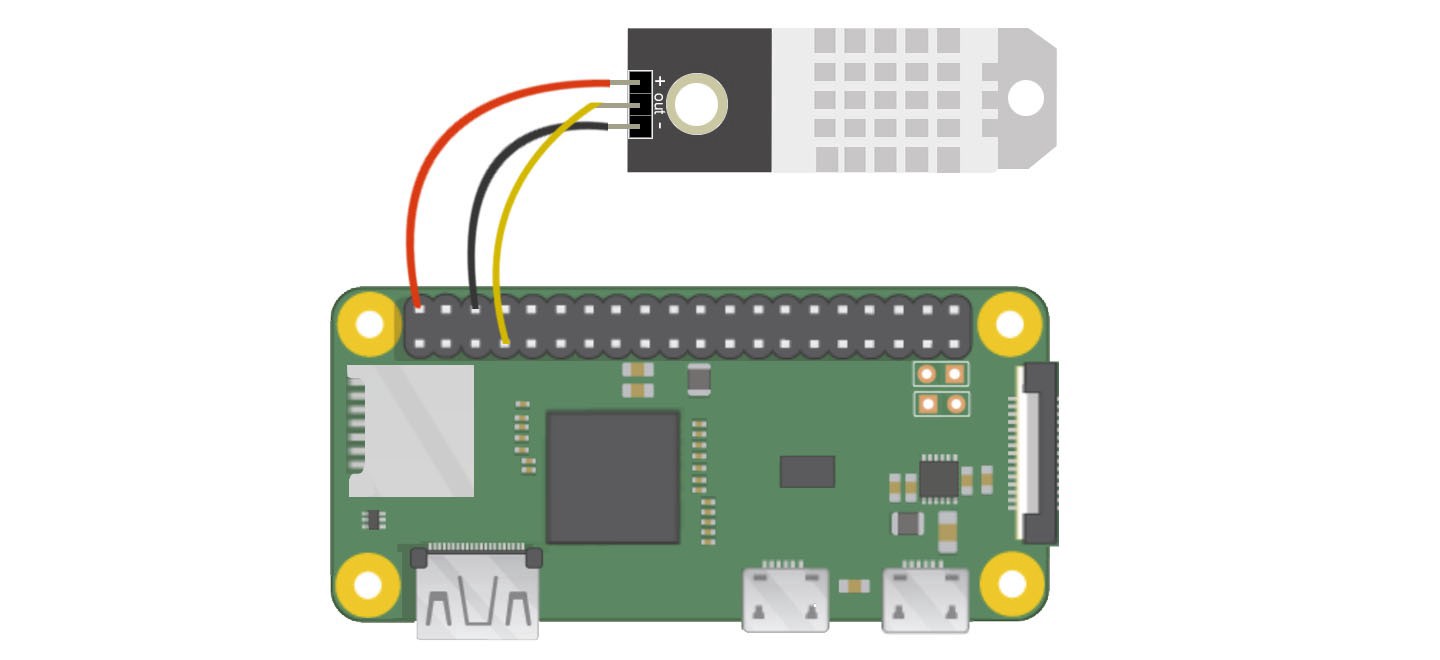
The DHT22 will have three pins ? 5V, Gnd, and data. There should be a pin label for power on the DHT22 (e.g. ?+? or ?5V?). Connect this to pin 2 (the top right pin, 5V) of the Pi. The Gnd pin will be labeled ?-? or ?Gnd? or something equivalent. Connect this to pin 6 Gnd (two pins below the 5V pin) on the Pi. The remaining pin on the DHT22 is the data pin and will be labeled ?out? or ?s? or ?data?. Connect this to one of the GPIO pins on the Pi such as GPIO4 (pin 7). Once this is wired, power on your Pi.
For this solution we will need to use Python 3 and the CircuitPython library as Adafruit has deprecated the DHT Python library.
Install the CircuitPython-DHT Python module at a command prompt to make reading DHT22 sensor data super easy:
$ pip3 install adafruit-circuitpython-dht$ sudo apt-get install libgpiod2
With our operating system installed along with our two Python modules for reading sensor data and sending data to Initial State, we are ready to write our Python script. The following script will create/append to an Initial State data bucket, read the DHT22 sensor data, and send that data to a real-time dashboard. All you need to do is modify lines 6?11.
https://gist.github.com/25be959d124f4b4c86f7160cf916f4d4.git
- Line 7? This value should be unique for each node/temperature sensor. This could be your sensor node?s room name, physical location, unique identifier, or whatever. Just make sure it is unique for each node to ensure that the data from this node goes to its own data stream in your dashboard.
- Line 8? This is the name of the data bucket. This can be changed at any time in the Initial State UI.
- Line 9? This is your bucket key. It needs to be the same bucket key for every node you want displayed in the same dashboard.
- Line 10? This is your Initial State account access key. Copy and paste this key from your Initial State account.
- Line 11? This is the time between sensor reads. Change accordingly.
- Line 12 ? You can specify metric or imperial units on line 11.
After you have set lines 7?12 in your Python script on your Pi, save and exit the text editor. Run the script with the following command:
$ python3 tempsensor.pyHere?s an example of using the DHT22 sensor with the Raspberry Pi
Now you will have data sending to an Initial State dashboard. Go to the final section of this article for details on how to customize your dashboard.
DSB18B20 Solution
You?ll need the following items to build this solution:-DSB18B20 Temperature Sensor-10K Resistor-Breadboard-40-Pin Breakout Board + Ribbon Cable-Wires
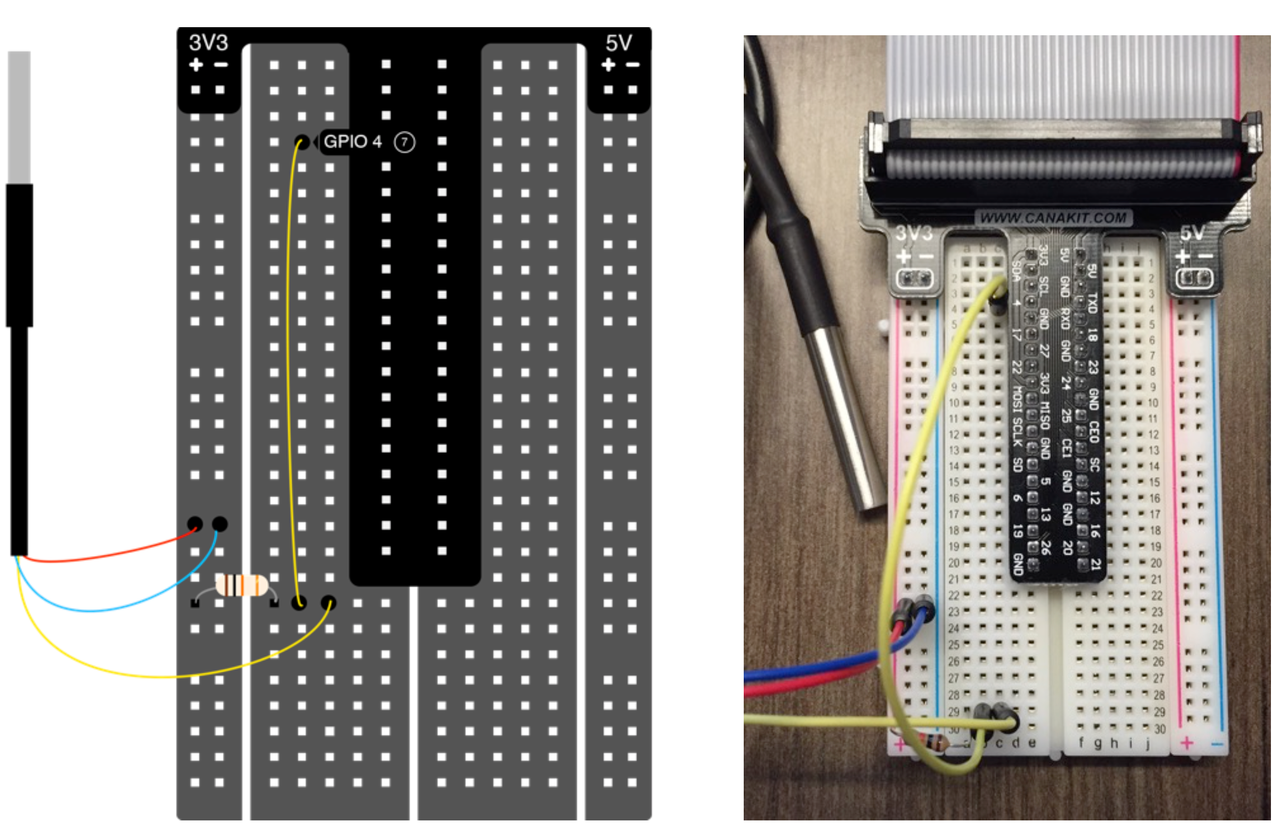
The ribbon cable connects to the GPIO pins on the Pi. The DS18B20 has three wires. The red wire connects to 3.3V. The blue/black wire connects to ground. The yellow wire connects to a pull-up resistor/pin 4. Once this is wired up, power on your Pi.
The latest version of Raspbian (kernel 3.18) requires an addition to your /boot/config.txt file for the Pi to communicate with the DS18B20. Run the following to edit this file:
$ sudo nano /boot/config.txt
If the following line is not already in this file (if it is, it is likely at the bottom of the file), add it and save the file.
dtoverlay=w1-gpio,gpiopin=4
Restart your Pi for the changes to take effect.
$ sudo reboot
To start the temperature sensor read interface we need to run two commands. Go to a command prompt on your Pi or SSH into your Pi. Type the following commands:
$ sudo modprobe w1-gpio$ sudo modprobe w1-therm
The output of your temperature sensor is now being written to a file on your Pi. To find that file:
$ cd /sys/bus/w1/devices
In this directory, there will be a sub-directory that starts with ?28-?. What comes after the ?28-? is the serial number of your sensor. cd into that directory. Inside this directory, a file named w1_slave contains the output of your sensor. Use nano to view the contents of the file. Once you?ve entered into the file, it will look something like this:
a2 01 4b 46 7f ff 0e 10 d8 : crc=d8 YESa2 01 4b 46 7f ff 0e 10 d8 t=26125
The number after ?t=? is the number we want. This is the temperature in 1/1000 degrees Celsius (in the example above, the temperature is 26.125 C). We just need a simple program that reads this file and parses out that number. We will get to that in just a second.
Everything is now ready for us to start streaming data. To open the text editor type the following in the command prompt:
$ nano temperature.py
Copy and paste the code below into the text editor.
https://gist.github.com/elizabethn119/c1ab0313c57d1cd5e2f3e3fed32cd7d3
You need to put your Initial State access key on line 6 in place of PUT_YOUR_ACCESS_KEY_HERE (copy the streaming key to your clipboard from ‘My Account’ and paste it into the code in nano in your terminal).
Line 6 will create a bucket named ?Temperature Stream? in your Initial State account (assuming you correctly specified your access_key on this same line). Lines 8 through 30 of this script simply interface with the DS18B20 sensor to read its temperature from the w1_slave file we discussed earlier. The read_temp_raw() function on line 15 reads the raw w1_slave file. The read_temp() function on line 21 parses out the temperature from that file. Line 34 calls these functions to get the current temperature. Line 35 converts the temperature from Celsius to Fahrenheit. Lines 35 and 36 streams the temperature to your Initial State account. Line 37 pauses the script for 0.5 seconds, setting how often the temperature sensor will be read and streamed.
We are ready to start streaming. Run the following command:
$ sudo python temperature.py
Go back to your Initial State account in your web browser and look for a new data bucket called Temperature Stream. You should see temperature data streaming in live. Vary the temperature of the sensor by holding it in your hand or putting it in a glass of ice.
Now you will have data sending to an Initial State dashboard. Go to the final section of this article for details on how to customize your dashboard.
BME280 Solution
You?ll need the following the build this solution:-BME280 Pressure, Temperature, & Humidity Sensor
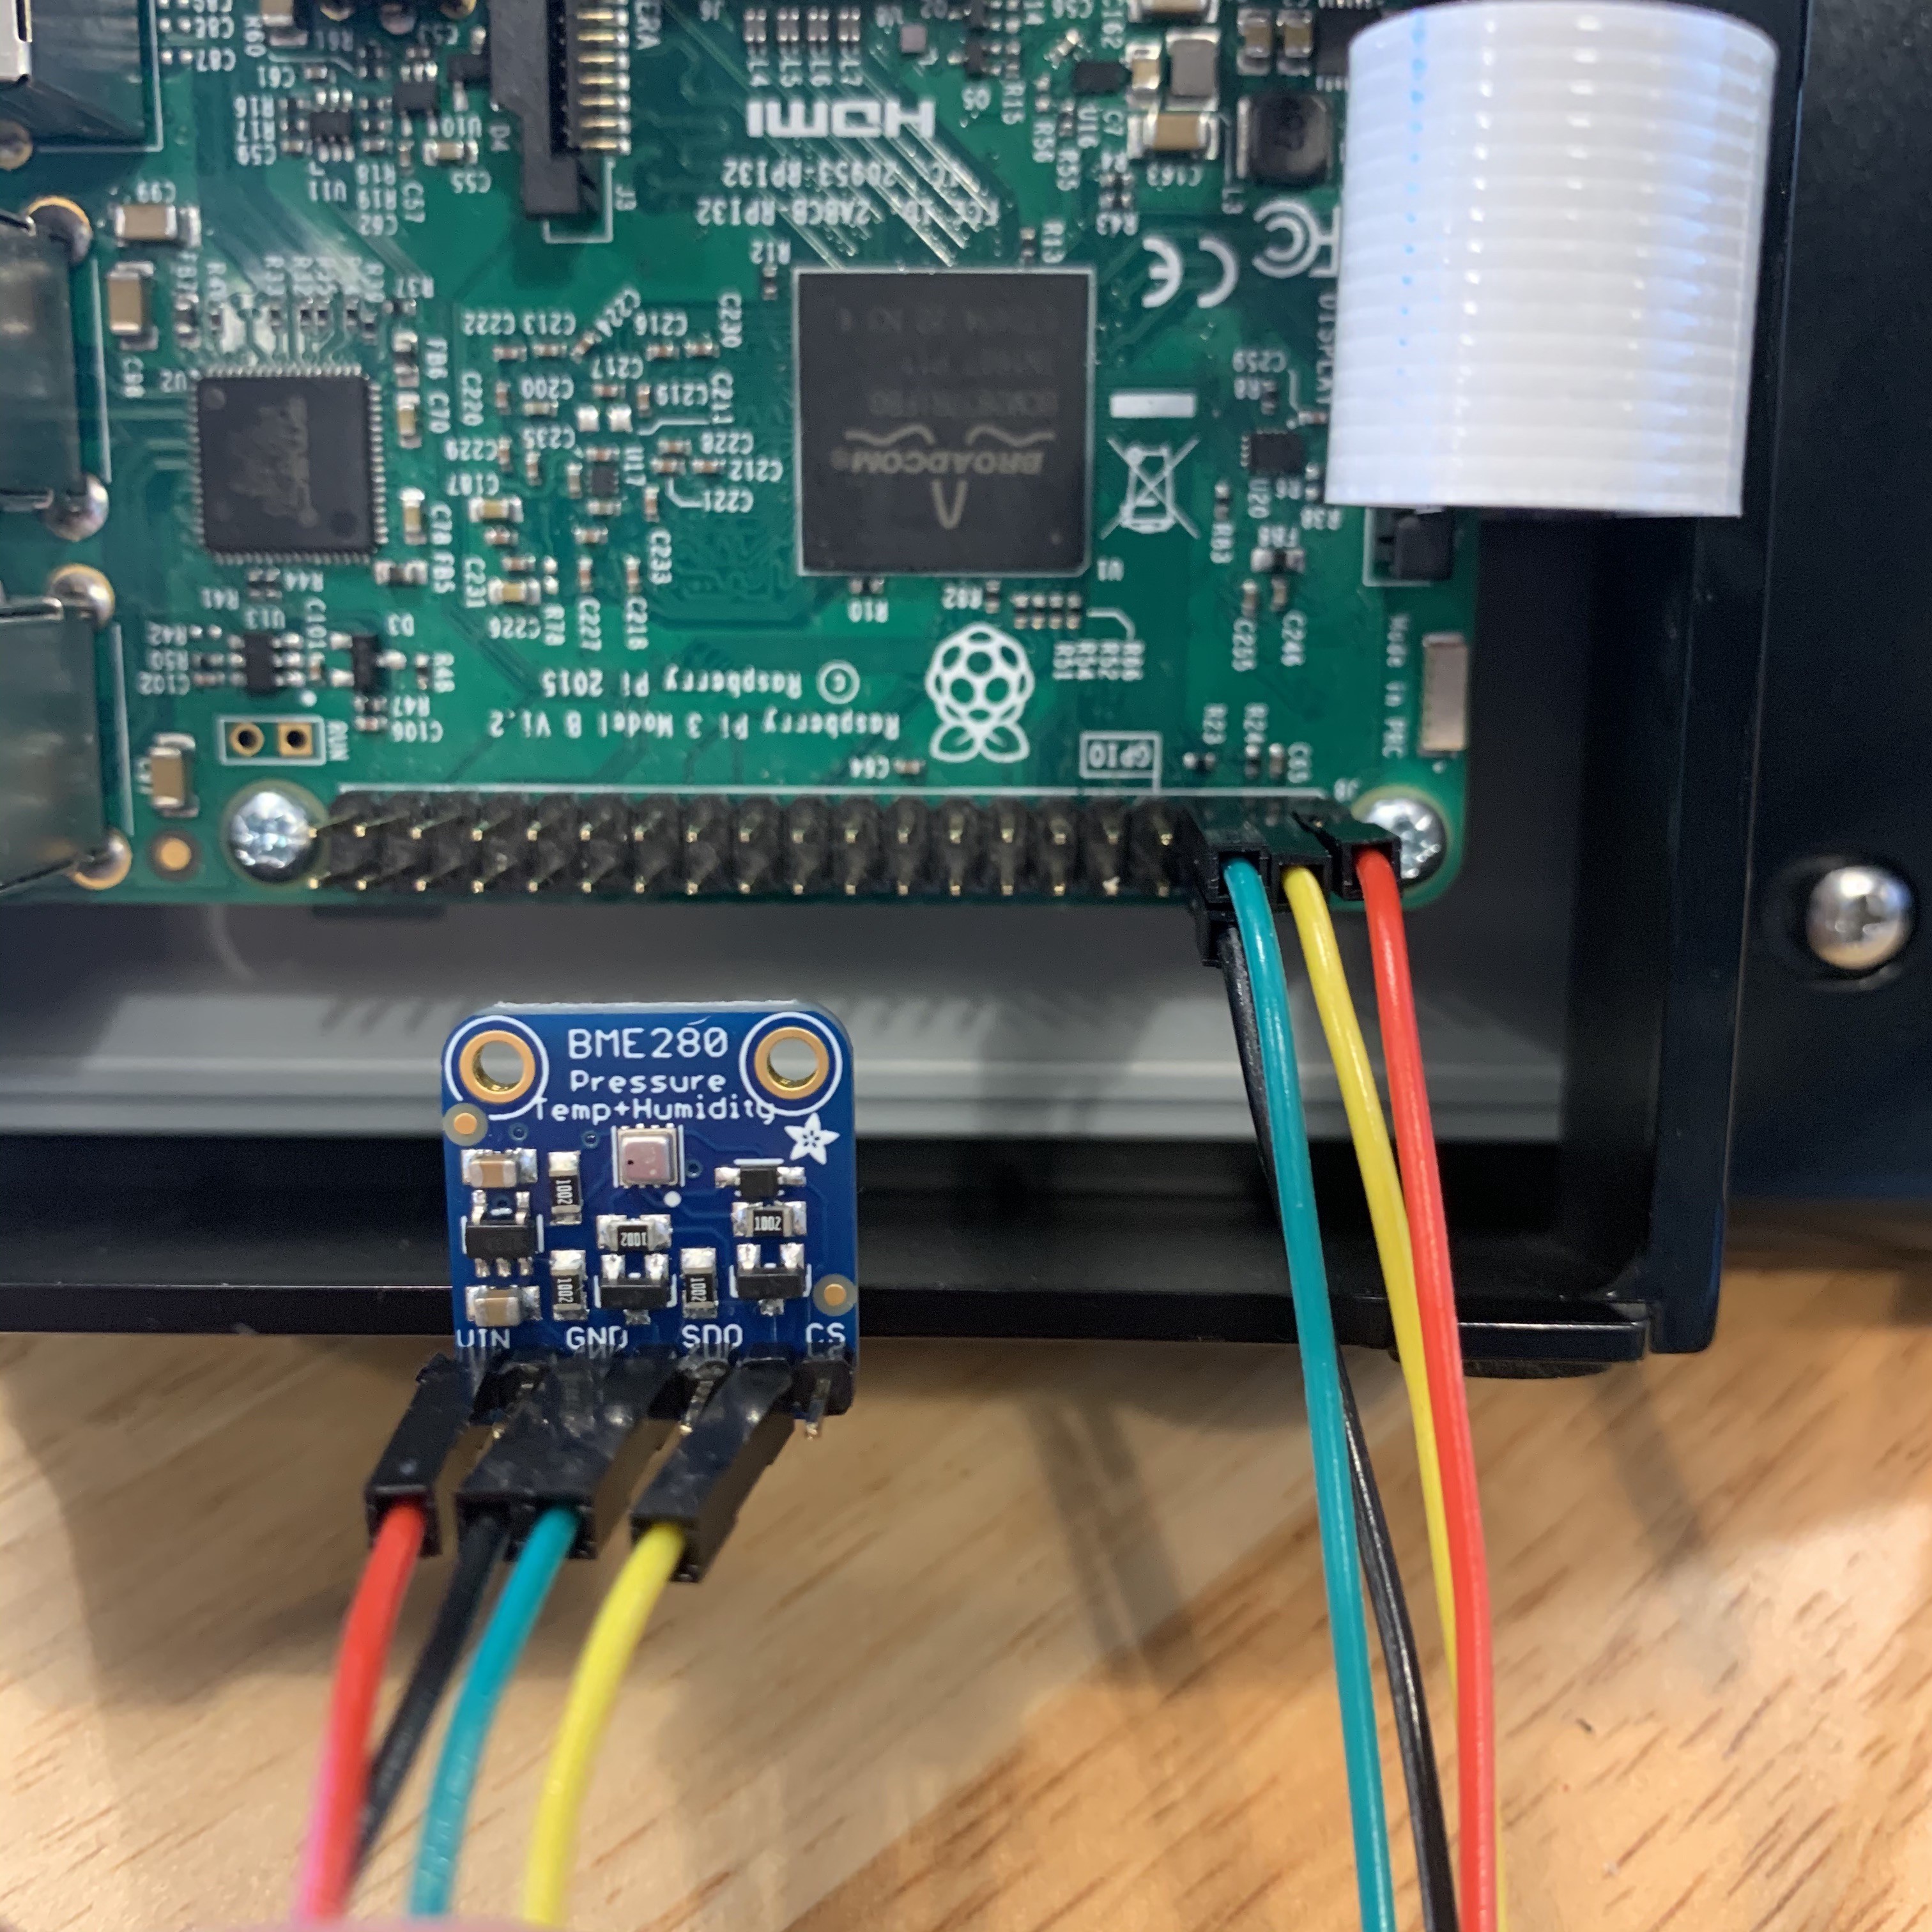
If you are using a BME280 that isn?t from Adafruit, your setup and code will be different. You can find an example of how to use that BME280 sensor in this article about crawl space humidity monitoring.
This sensor comes with pins that you?ll need to solder on the sensor. I recommend using a breadboard with the pins long side down into the breadboard to make soldering easier. Once you?ve completed this we need to wire the sensor to the Pi.
Connect the VIN pin on the sensor to 3.3V pin 1 on the Pi. Connect the GND pin on the sensor the ground pin 6 on the Pi. Connect the SCK pin on the sensor to the SCL pin 5 on the Pi. Connect the SDI pin on the sensor to SDA pin 3 on the Pi.
You?ll need to be using Python 3 for this solution and install the Initial State Streamer module using pip3 install method. You?ll also need to install a few Adafruit Python libraries.
pip3 install adafruit-blinkapip3 install pureiopip3 install spidevpip3 install adafruit-GPIOpip3 install adafruit-circuitpython-bme280
To use the sensor we need to enable I2C on the Pi.
sudo raspi-config
This will open the Raspberry Pi Software Configuration Tool. Go to Option 5 Interfacing Options. From here go to I2C. It will prompt to ask you if you want to enable I2C, Select Yes and Finish. Now you have I2C enabled to communicate with the sensor.
We can test this out by running the following:
sudo i2cdetect -y 1
This will verify that your Pi sees the sensor. In the way that it is connect, it should show the sensor at address 77. If you does not detect the sensor, reboot your Pi, reenable the I2C interface option on your Pi, and try again.
Once your sensor is detected, it?s time to run our main code that will send data to Initial State. Created a file called bme280sensor.py with the nano command. Copy and paste the code from the gist into the text editor. You?ll need to to make changes to lines 12?19.
https://gist.github.com/elizabethn119/33c4837290c6d5d21ca9359c90d014f4
- Line 12 ? This value should be unique for each node/temperature sensor. This could be your sensor node?s room name, physical location, unique identifier, or whatever. Just make sure it is unique for each node to ensure that the data from this node goes to its own data stream in your dashboard.
- Line 13 ? This is the name of the data bucket. This can be changed at any time in the Initial State UI.
- Line 14 ? This is your bucket key. It needs to be the same bucket key for every node you want displayed in the same dashboard.
- Line 15 ? This is your Initial State account access key. Copy and paste this key from your Initial State account.
- Line 17 ? This is your location?s pressure (hPa) at sea level. You can find this information on most weather websites.
- Line 18 ? This is the time between sensor reads. Change accordingly.
- Line 19 ? Here you can specify metric or imperial units.
After you have set lines 12?19 in your Python script on your Pi, save and exit the text editor. Run the script with the following command:
$ python3 bme280sensor.py
Now you will have data sending to an Initial State dashboard. Go to the final section of this article for details on how to customize your dashboard.
Sense HAT Solution
You?ll need the following items to build this solution:-Raspberry Pi Sense HAT-6″ 40-Pin IDE Male to Female Extension Cable (optional for temperature accuracy)
The first step in using the Sense HAT is to physically install it onto your Pi. With the Pi powered down, attached the HAT as shown below.
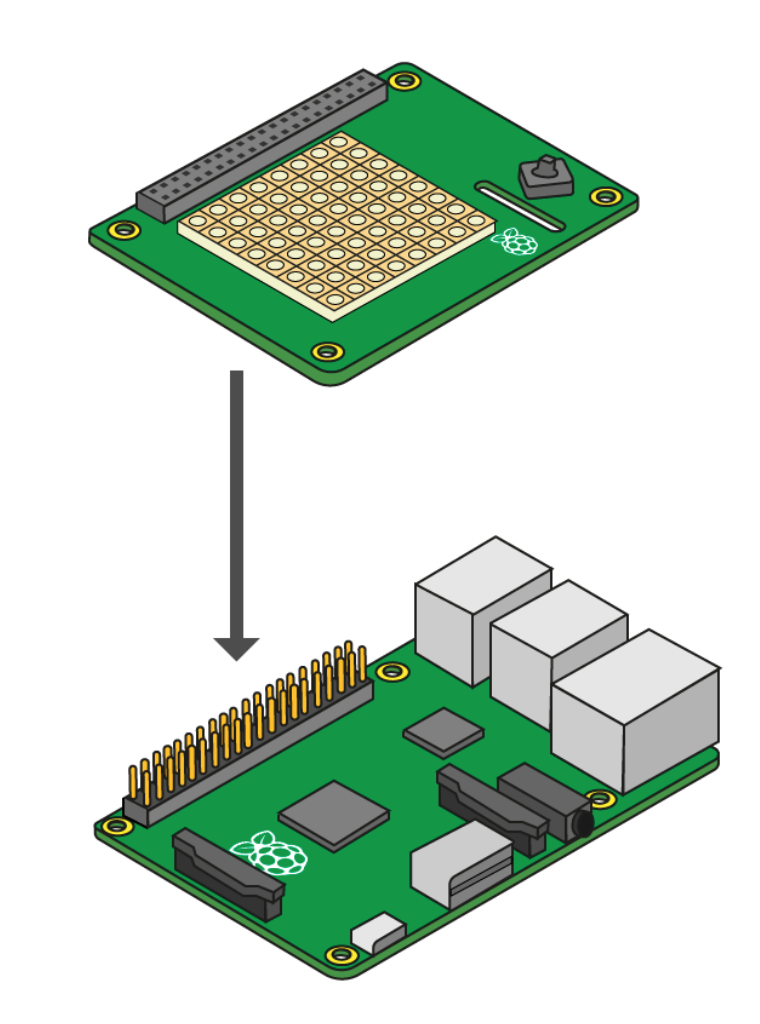 Sense HAT connection to Raspberry Pi
If you decide to use the solution as shown above you may notice that your Sense HAT?s temperature readings will be a bit high ? that?s because they are. The culprit is the heat generated from the Pi?s CPU heating up the air around the Sense HAT when it is sitting on top of the Pi. To make the temperature sensor useful, we need to either get the HAT away from the Pi or try to calibrate the temperature sensor reading. A good solution for getting the sensor away from the Pi is a cable that lets the Sense HAT dangle away from the Pi. A 6″, 40-pin IDE male to female extension cable cable will do the trick.
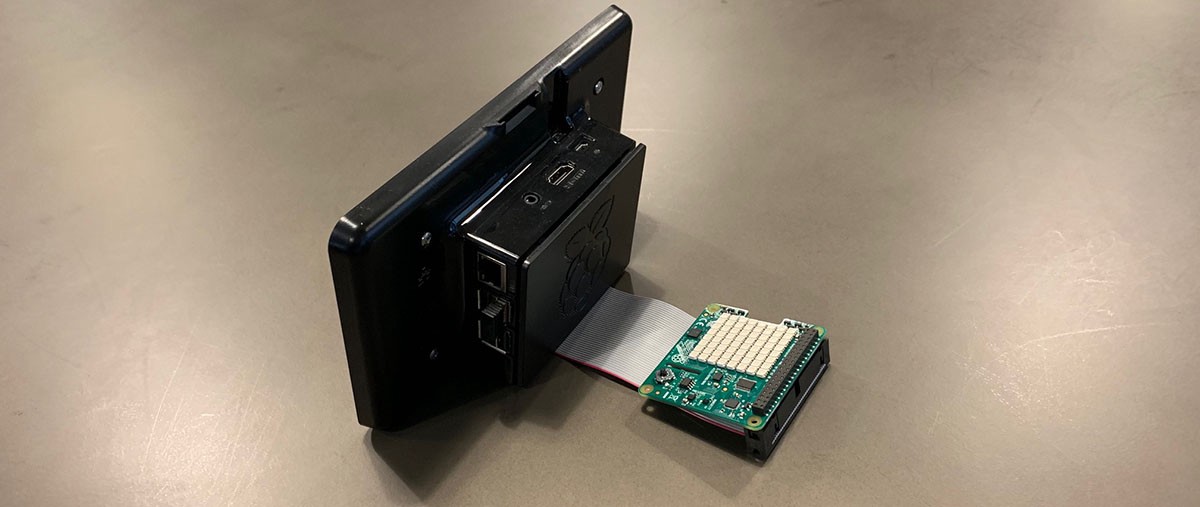 Raspberry Pi in a case with extension cable connecting to the Sense HAT
Once you decide on the two options, power on your Pi. We need to install the Python library to make it easy to read the sensor values from the Sense HAT. First, you will need to ensure that everything is up-to-date on your version of Raspbian:
$ sudo apt-get update
Next, install the Sense HAT Python library:
$ sudo apt-get install sense-hat
Reboot your Pi. We are ready to test the Sense HAT by reading sensor data from it and sending that data to Initial State.
Create a file called sensehat and open it in the text editor by entering the follwoing in the command prompt:
$ nano sensehat.py
Copy and paste the code below in the text editor.
https://gist.github.com/elizabethn119/cc93f6fb38519e890905d0c463e5f7aa
Notice on the first line that we are importing the SenseHat library into the script. Before you run this script, we need to setup our user parameters.
# ——— User Settings ———BUCKET_NAME = “Office Weather”BUCKET_KEY = “sensehat”ACCESS_KEY = “Your_Access_Key”SENSOR_LOCATION_NAME = “Office”MINUTES_BETWEEN_SENSEHAT_READS = 0.1# ———————————
Specifically, you need to set your ACCESS_KEY to your Initial State account access key. You can change BUCKET_NAME and SENSOR_LOCATION_NAME to the actual sensor location. Save and exit the text editor.
At a command prompt on your Pi, run the script:
$ sudo python sensehat.py
Now you will have data sending to an Initial State dashboard. Go to the final section of this article for details on how to customize your dashboard.
Customize Your Initial State Dashboard
With your Raspberry Pi temperature sensor built you can now go to your Initial State account and look at your data. You can right click on a Tile to change the chart type and click Edit Tiles to resize and move your Tiles around. I?d recommend using the gauge thermostat for temperature and the gauge liquid level for humidity. You can create line graphs for both temperature and humidity to see changes over time. You can also add a background image to your dashboard.
You can set Trigger alerts so you can get a SMS or email if the temperature drops below or goes above a certain threshold. Go to your data bucket and click on settings. From there go to the Triggers tab. Enter the stream key you want to monitor, the operator you want to use, and the threshold value. Click the plus sign to add the Trigger. Then you?ll enter your email or phone number to receive the alert at and click the plus sign. Once you?ve set all your Triggers click the Done button at the bottom.
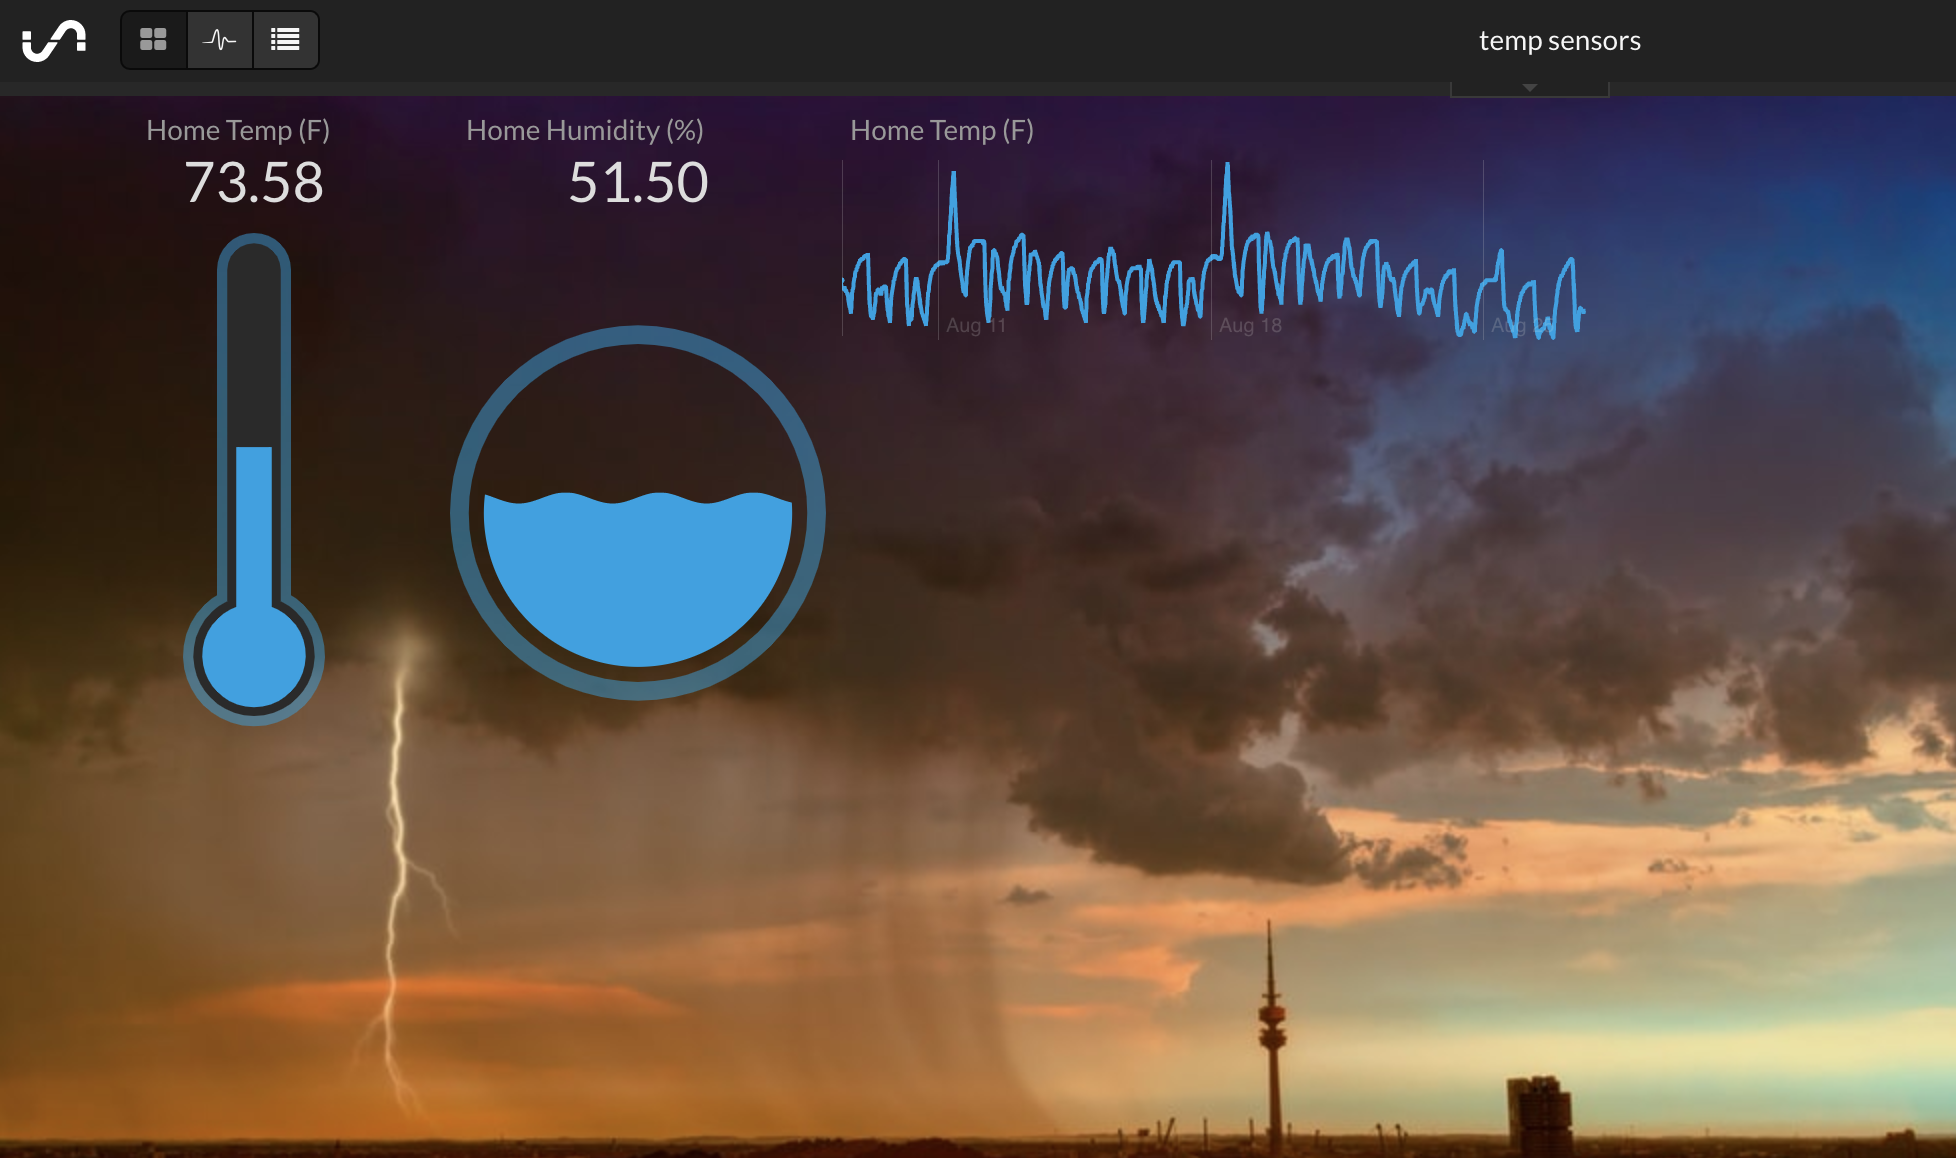 Initial State temperature dashboard
Now that you?ve created a Raspberry Pi temperature sensor using a sensor and a Raspberry Pi, you can start thinking about what other environmental data you can monitor next.
While Raspberry Pi is wildly popular and easy to use, I know many people have a preference for Arduino, which can be less expensive. If you are interested in using an ESP32 to monitor temperature instead of a Pi, you can check out this article about how use to ESP32 with a DHT22 sensor.
