Java Profilers and APM (Application Performance Management) Tools provide the means of monitoring and debugging performance issues in development and production environments. In practice, most of Java developers use a combination of these tools to get their performance monitoring needs done at work.
Types of Java Profilers
JVM Profilers
- Great for debugging tasks and tracking down memory leaks
- Show a large amount of details ? but relevance may depend on debugging task
Features:
- Tracking all the JVM details (CPU, threads, memory, garbage collection)
- Track all method calls with memory usage and and allow dive into the call structure
- Track details of all memory usage with responsible classes/objects
- CPU sampling feature to track and aggregate CPU time by class and method to help zero in on hot spots
- Allow to manually run garbage collection and review memory consumption (great way to find classes and processes that are holding on to memory in error)
Implementation details:
- A direct connection to the JVM is used (not favorable in production use)
- May slow down the application or require downtime (not favorable in production use)
Examples: VisualVM, JProfiler, YourKit, Java Mission Control
Transaction Profilers
There are 2 types of implementations for Transaction Profilers.
- Aspect Profilers ? Use aspect-oriented programming (AOP) to inject code into the start and end of specified methods (the injected code can start a timer and then report the elapsed time when the method finishes); Simple to set up; Need to prior knowledge/guessing on what to profile
- Agent Profilers ? Use Java Instrumentation API to inject code into the application; Have in-depth access to application since the code is being rewritten at the bytecode level ? allowing for any code running in application (written by us or came from 3rd party libraries) to be instrumented; More complicated to write
Examples: XRebel, Stackify Prefix
APM Tools
- Great for monitoring applications live in production environments
- Show a less amount of details (with aggregations and sampling) ? but mostly the right information which are smartly selected to have high relevance to common performance concerns
Implementation details:
- Use the Java Agent profiler method but with different instrumentation rules to allow them to run without affecting performance in productions
Examples: AppDynamics, Stackify Retrace, New Relic, Dynatrace
Usage Stats on Profiling Tools
According to an interesting survey done by RebelLabs, the following are the pioneering profiling tools used by the companies.
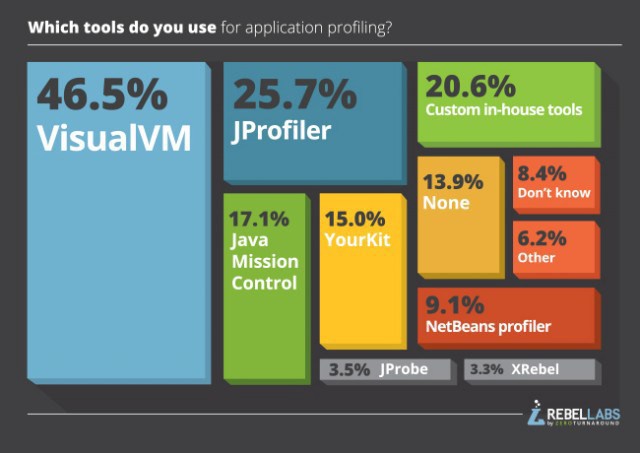 Profiling Tools ? Usage Stats (Image: Zeroturnaround.com)
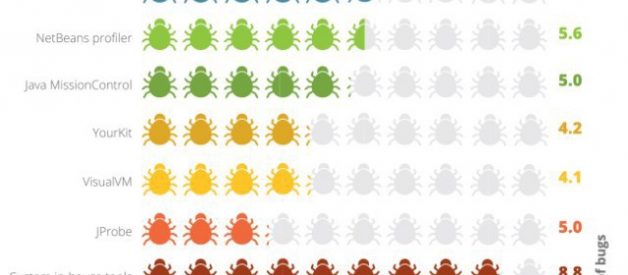
Also their survey reveals important insights on the performance of each tool when it comes to actual bug finding.
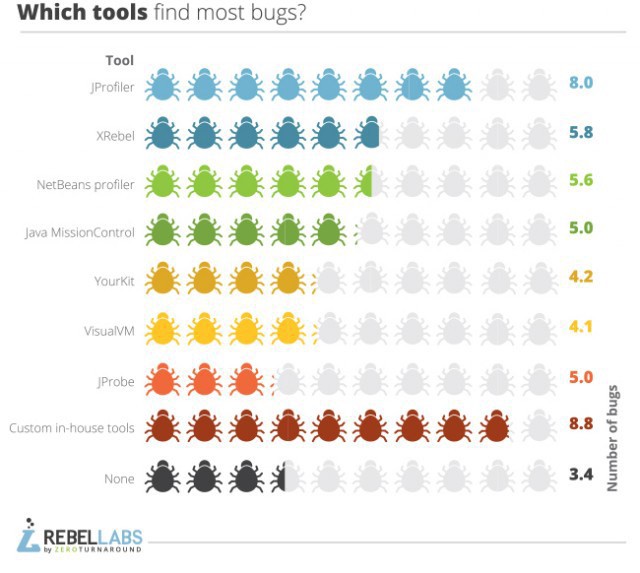 Tools Finding Most Bugs (Image: Zeroturnaround.com)
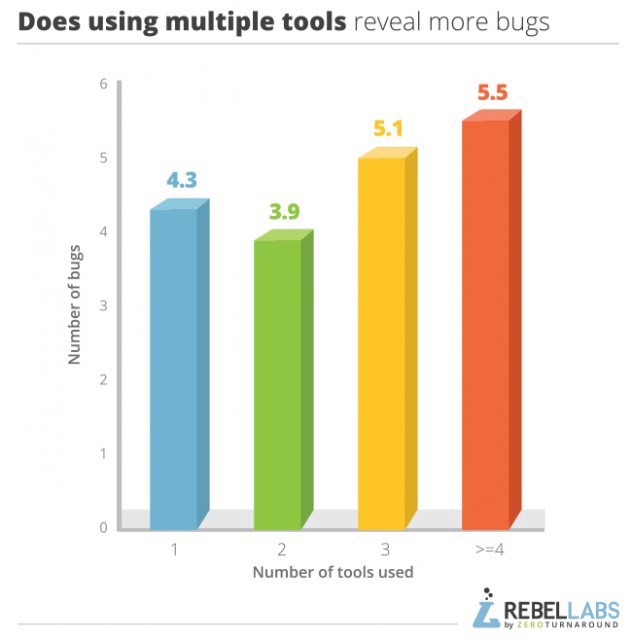 Using Multiple Tools for Finding Bugs (Image: Zeroturnaround.com)
A considerable number of these companies have claimed that they are using more than one tool for profiling tasks.
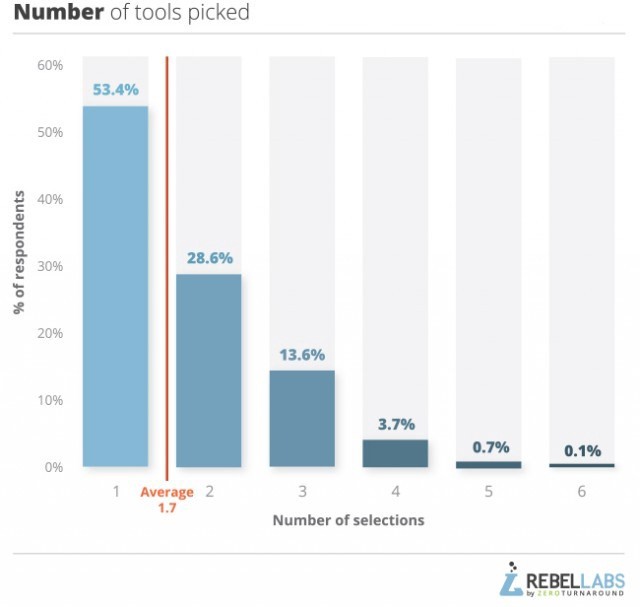 Number of Tools Picked (Image: Zeroturnaround.com)
These insights are a solid evidence to state that most of developers use multiple different tools to get their profiling tasks done (some even build in-house tools). Therefore, since almost all these tools give you the basic features, it is recommended to try what suits your needs and taste.
Now let?s look at some of the tools mostly used in Java environments.
List of Popular Command-line JVM Profilers
jstat
- Command line tool shipped with standard JDK (no installation/setup process)
- Useful for monitoring JVM memory, heap sizing, and garbage collection activity using command line
- Uses the built-in instrumentation in JVM, which is enabled by default (no need to start JVM with special commands)
- Identify the target Java process using virtual machine identifier (VMID)
- If you want only the current status of memory usage (instead of monitoring), use jmap
Using jstat
1) Run your Java program with some predefined performance constraints
java -Xmx120m -Xms30m -Xmn10m -XX:PermSize=20m -XX:MaxPermSize=20m -XX:+UseSerialGC AwesomeJavaProgram
2) Obtain the process id
ps aux | grep java
3) Run jstat with -gc option on terminal to start monitoring JVM Heap Memory usage
jstat -gc 21167 1000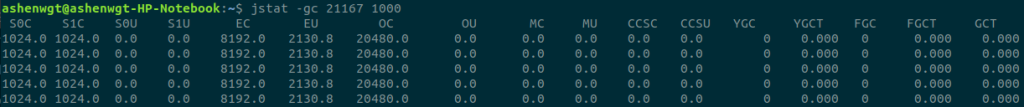
Here the last argument (1000) is sampling interval between each output, so it will print memory and garbage collection data every 1 second.
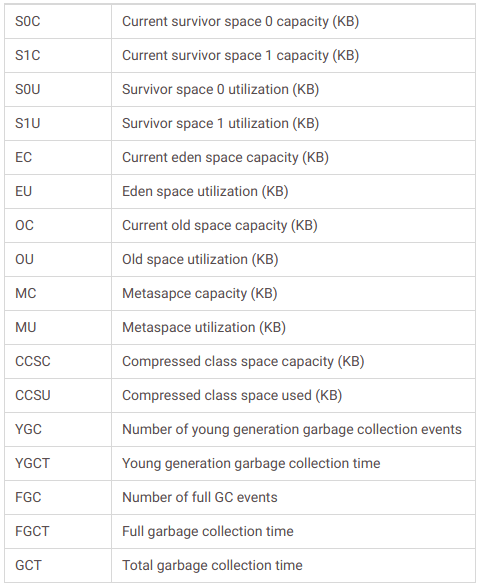 jstat gc options (Image: Betsol.com) ? here you can see the importance of learning Java Memory Model and Garbage Collection
jmap
- Command line tool shipped with standard JDK (no installation/setup process)
- Useful for printing out current memory-related statistics (heap summary, histogram of java object heap, class loader statistics, information on objects awaiting finalization, dump java heap in hprof binary format) for a running VM or core file
- Specially helpful to inspect underlying configurations and algorithms
- Recommended to use the latest utility, jcmd (since JDK 8) instead of jmap utility, for enhanced diagnostics and reduced performance overhead
- If you want to monitor memory usage (instead of current usage), use jstat
Using jmap to JVM heap details
jmap ?heap <JAVA_PID>
Using jmap to create a heap dump
jmap ?dump:file=<FILE> <JAVA_PID>
jcmd
- Command line tool shipped with standard JDK (no installation/setup process)
- Useful for send diagnostic command requests to the JVM
Using jcmd to create a heap dump
jcmd <JAVA_PID> GC.heap_dump filename=<FILE>
jhat
- Command line tool shipped with standard JDK (no installation/setup process)
- Useful for browsing the object topology in a heap snaphot (a.k.a. heap dump)
- Replaces the Heap Analysis Tool (HAT)
- Parses a heap dump in binary format (e.g. a heap dump produced by jcmd)
- Can help debug unintentional object relation (Java language equivalent of a memory leak ? an object that is no longer needed but is kept alive due to references through some path from the rootset)
- e.g. 1) an unintentional static reference to an object remains after the object is no longer needed
- e.g. 2) an observer or listener fails to unregister itself from its subject when it is no longer needed
- e.g. 3) a thread that refers to an object does not terminate when it should
Using jhat to analyze a heap dump
jhat <HPROF_FILE>
hprof
- Command line tool shipped with standard JDK (no installation/setup process)
- Useful for heap and CPU profiling when analyzing performance, lock contention, memory leaks and other issues
- Works as a dynamic-link library (DLL) that interfaces with the JVM using the Java Virtual Machine Tool Interface (JVMTI)
- Writes profiling information either to a file or to a socket in ASCII or binary format
- Can report CPU usage, heap allocation statistics, complete heap dumps and states of all the monitors and threads in the JVM, and monitor contention profiles
Implementation details:
- HPROF instructs the JVM to send it the relevant events depending on the type of profiling requested
- The tool then processes the event data into profiling information
- By default, heap profiling information is written out to java.hprof.txt (in ASCII) in the current working directory
Using hprof to profile a class
java ?agentlib:hprof ToBeProfiledClass
Using hprof to obtain heap allocation profile
javac ?J-agentlib:hprof=heap=sites Hello.java
This shows the amount of allocation that occurs in various parts of the program.
Using hprof to create a heap dump
javac ?J-agentlib:hprof=heap=dump Hello.java
This consists of the root set as determined by the garbage collector, and an entry for each Java object in the heap that can be reached from the root set.
Using hprof to collect CPU usage
javac ?J-agentlib:hprof=cpu=samples Hello.java
Here the HPROF agent periodically samples the stack of all running threads to record the most frequent active stacktraces.
List of Popular JVM Profilers with GUI
Java VisualVM with Visual GC plugin
- GUI tool shipped with standard JDK (no installation/setup process)
- Useful for monitoring CPU sampling, memory sampling, run garbage collections, analyze heap errors, take snapshots and more using GUI
- Can develop new functionalities as plugins
- Supports local and remote profiling (does not provide support for ssh tunneling, need to configure JMX ports for remote profiling)
- Can take snapshots of profiling sessions for later analysis
- Relies on other standalone tools provided in the JDK, such as JConsole, jstat, jstack, jinfo, and jmap
Using jvisualvm and jvisualgc
1) Run your Java program with some predefined performance constraints
java -Xmx120m -Xms30m -Xmn10m -XX:PermSize=20m -XX:MaxPermSiz e=20m -XX:+UseSerialGC AwesomeJavaProgram
2) Run jvisualvm on terminal to start monitoring JVM Heap Memory usage
jvisualvm
3) Now the Java VisualVM application will open up. Go to Tools > Plugins, and install Visual GC plugin (There will be a list of other available plugins too. You can try them as necessary)
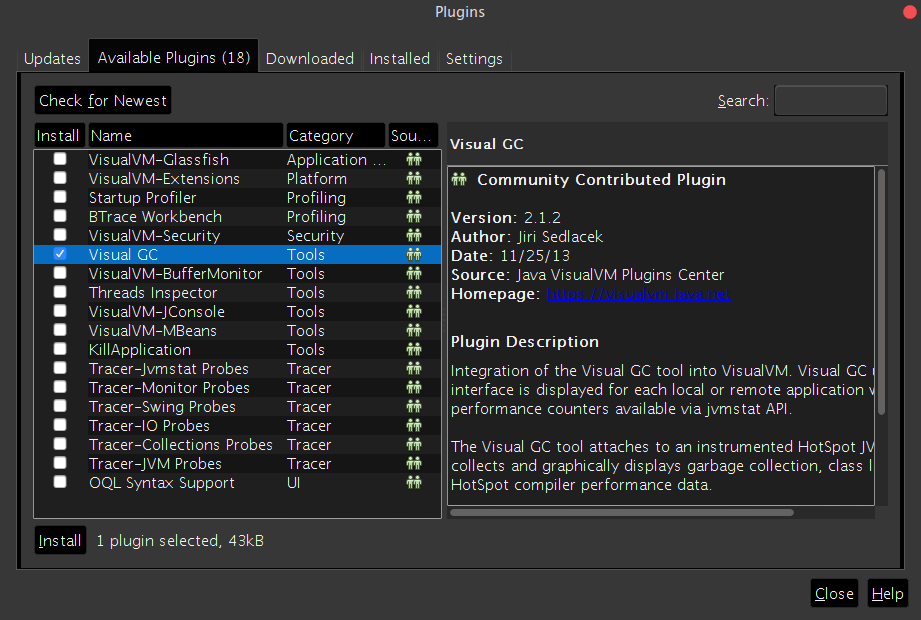 Install Visual GC plugin from Java VisualVM application
4) Now feel free to play with the different options and see what you can learn about your application.
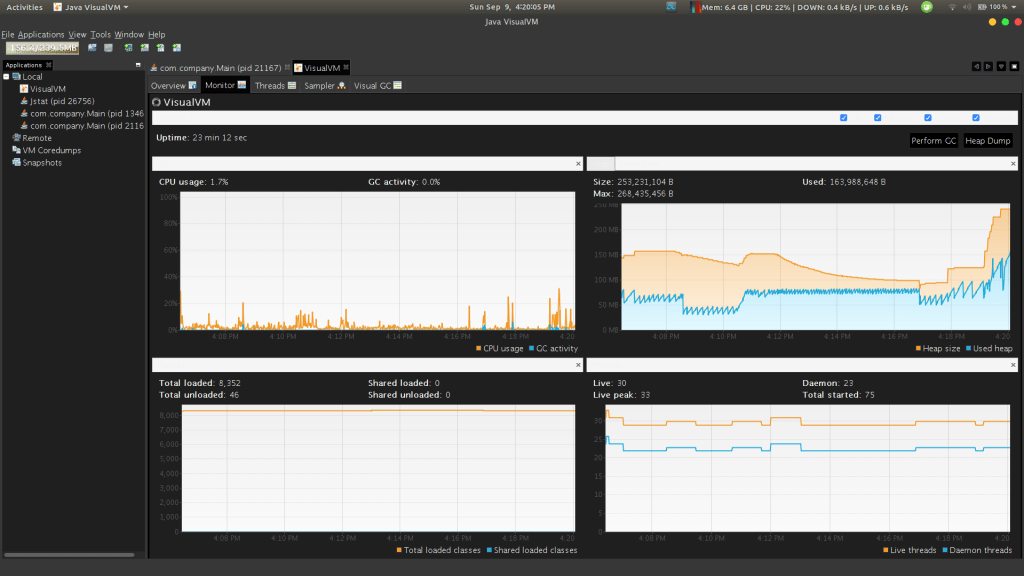 Java VisualVM
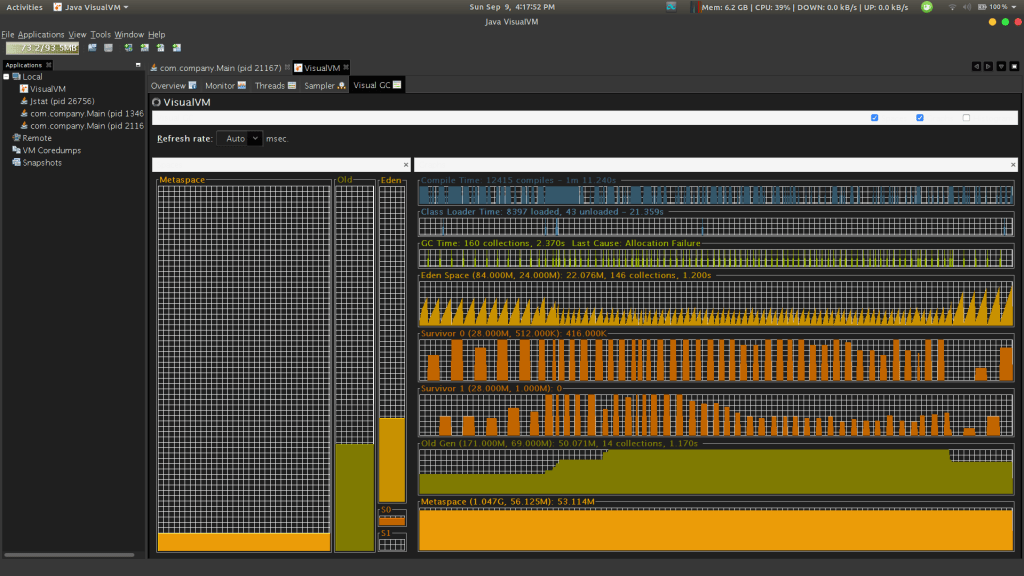 Java VisualGC
Connecting VisualVM to Remote JVM by Enabling JMX Remote Ports
- Not a profiling tool
- Useful for VisualVM and other profiling tools in remote machines to connect to the local JVM in order to view the CPU utilization, memory sampling, threads etc.
- Can generate thread dumps and memory dumps remotely when connected through JMX Remote port
JVM Options for enabling JMX Remote Ports at startup
-Dcom.sun.management.jmxremote -Dcom.sun.management.jmxremote.port=<Port>
Java Flight Recorder (JFR) & Java Mission Control (JMC)
- Complete tool chain to continuously collect low level and detailed runtime information enabling after-the-fact incident analysis
- JFR ? profiling and event collection framework built into the Oracle JDK, gather detailed low level information about JVM and application
- JMC ? advanced set of tools that enables efficient and detailed analysis of the extensive of data collected by JFR
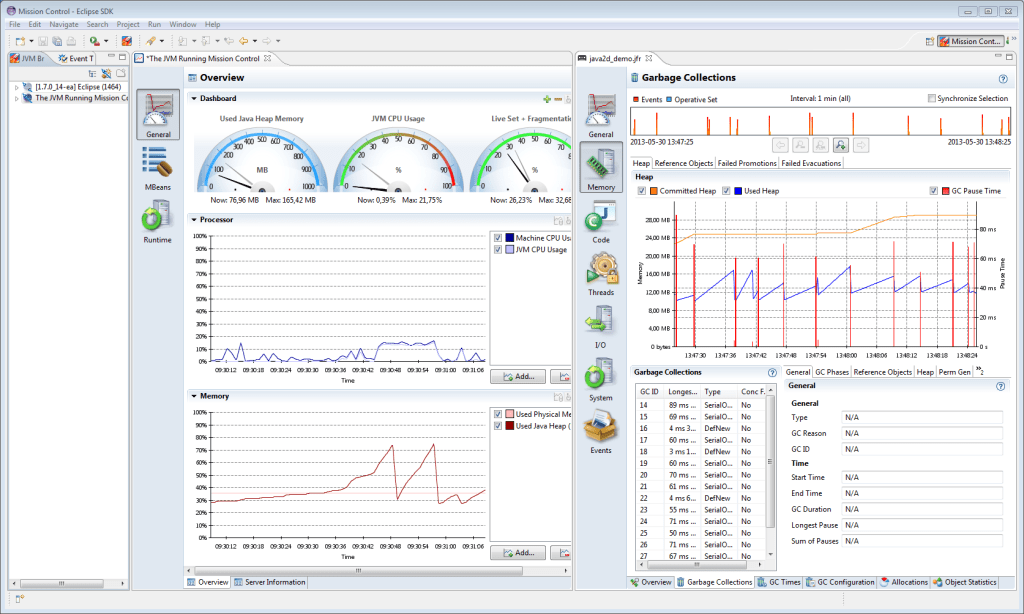 JMC (Image: Oracle.com)
JProfiler
- Top (paid) choice for many developers
- Includes almost all the features in VisualVM (viewing system performance, memory usage, potential memory leaks, and thread profiling), but the UI is more intuitive and friendlier to use
Cool features to know:
- Profiling remote applications
- Advanced profiling for both SQL and NoSQL databases
- Call tree of interactions with our database and connections that may be leaked
- Live memory usage for object declarations and instances or for the full call tree
- Integration with popular IDEs
- Navigate from snapshot to source code
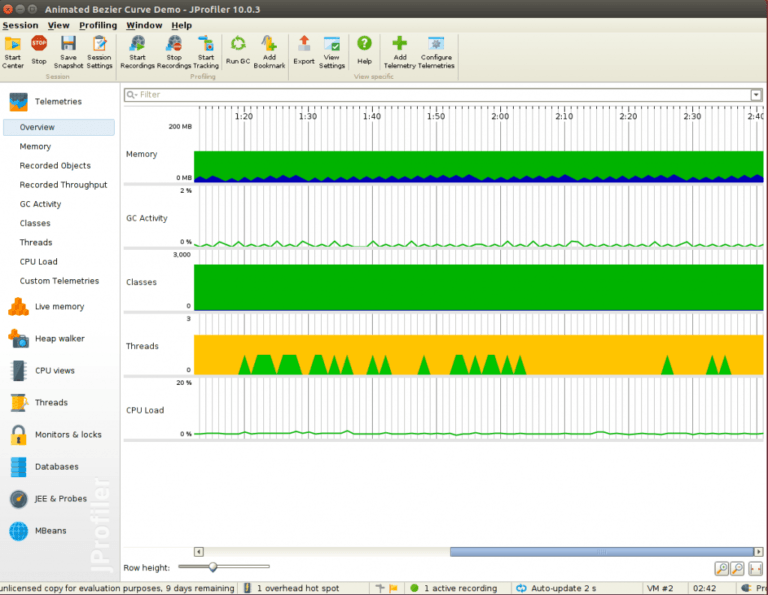 JProfiler overview interface with features (Image: Baeldung.com)
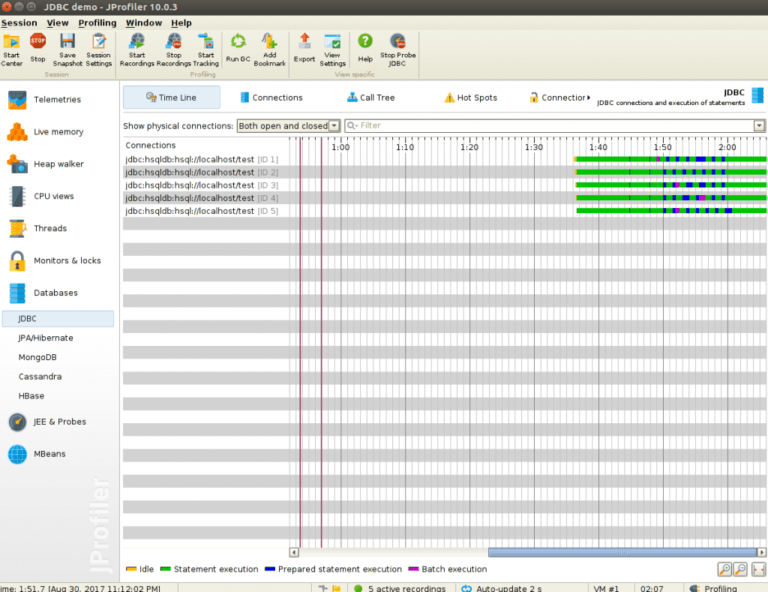 JProfiler JDBC probing view with a list of current connections (Image: Baeldung.com)
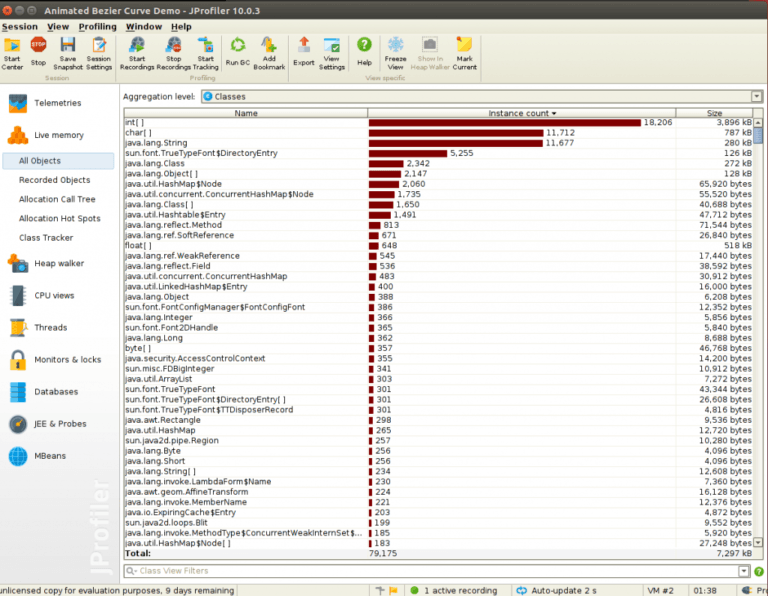 JProfiler live memory view (Image: Baeldung.com)
YourKit
- Top (paid) powerful choice for many developers
- Include core features like in VisualVM and JProfiler (visualizing threads, garbage collections, memory usage, and memory leaks, with support for local and remote profiling via ssh tunneling)
Cool features to know:
- Profile thrown exceptions
- Powerful CPU profiling feature that allows focused profiling on certain areas of our code such as methods or subtrees in threads
- Allows for conditional profiling through its what-if feature
- Profile SQL, and NoSQL database calls
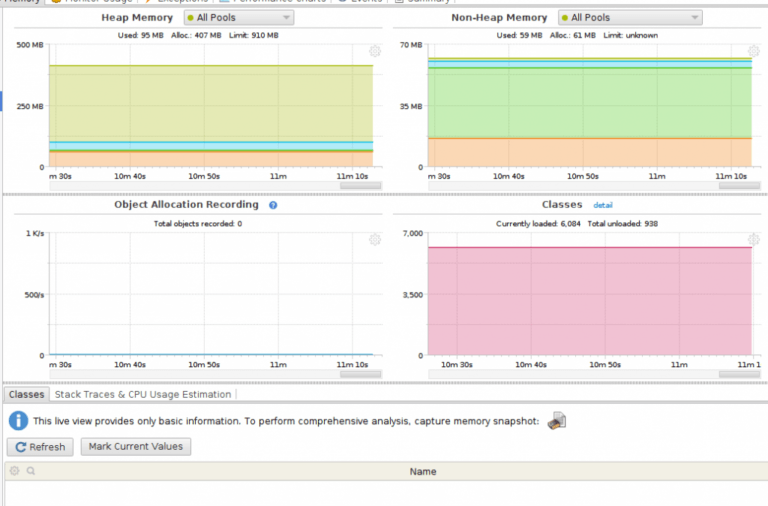 YourKit Java Profiler memory profiling of Tomcat server application (Image: Baeldung.com)
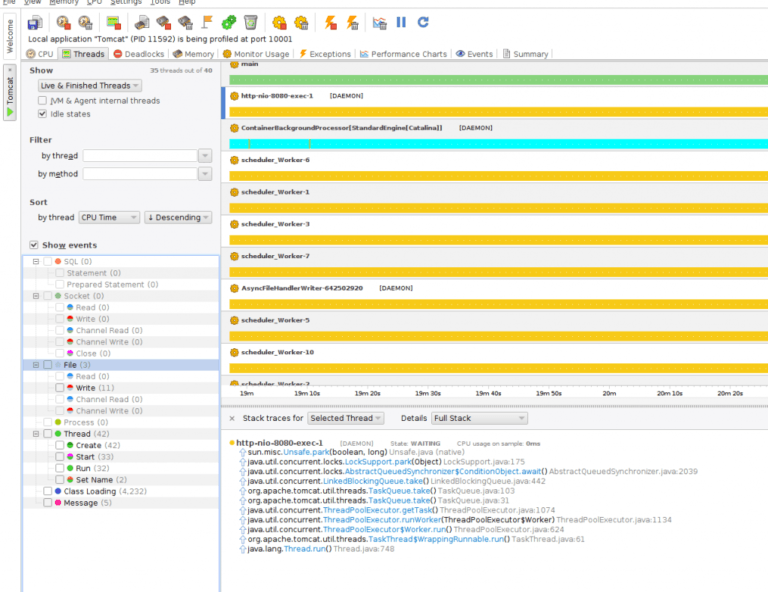 YourKit Java Profiler threads profiling interface (Image: Baeldung.com)
List of Popular Transaction Profilers
Stackify Prefix
- Developer-oriented Java Profiler
- Use Java Agent profiling method
Cool things to know:
- Have prior knowledge on the most desired classes and 3rd party libraries developers want to be instrumented
- e.g. 1) When running an application using Hibernate, Prefix will not only detail out the elapsed time for queries but also displays parameter values for the generated SQL
- e.g. 2) When your app calls to a SOAP/REST API, Prefix provides the request and response content
- Cost: FREE
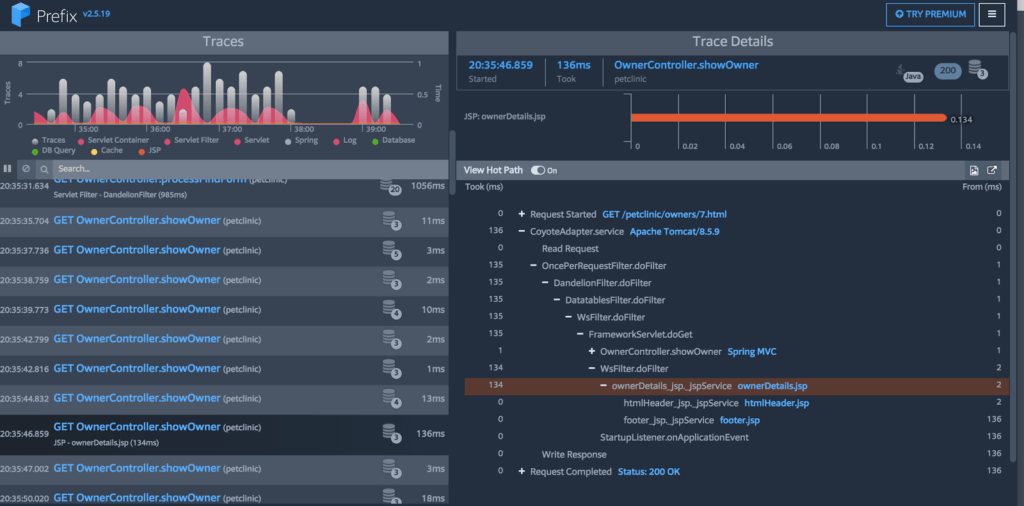 Prefix Screenshot ? Tomcat Web Request Trace (Image: Stackify.com)
XRebel
- Provides real time feedback on application performance in local development (made for the developer, not the operations analyst)
- Supports many developer-level profiling needs, great tools for debugging tasks
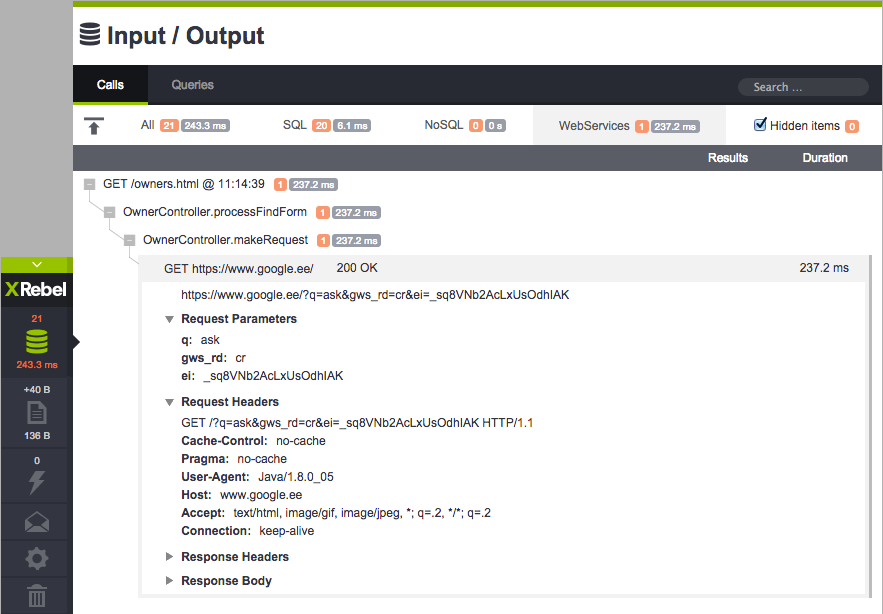 XRebel HTTP Calls (Image: Zeroturnaround.com)
List of Popular APM Tools
New Relic
- Top (paid) choice for many developers
- Great set of features for enterprise-grade production use
- Cost: $75?600 per month per server, cheaper annually
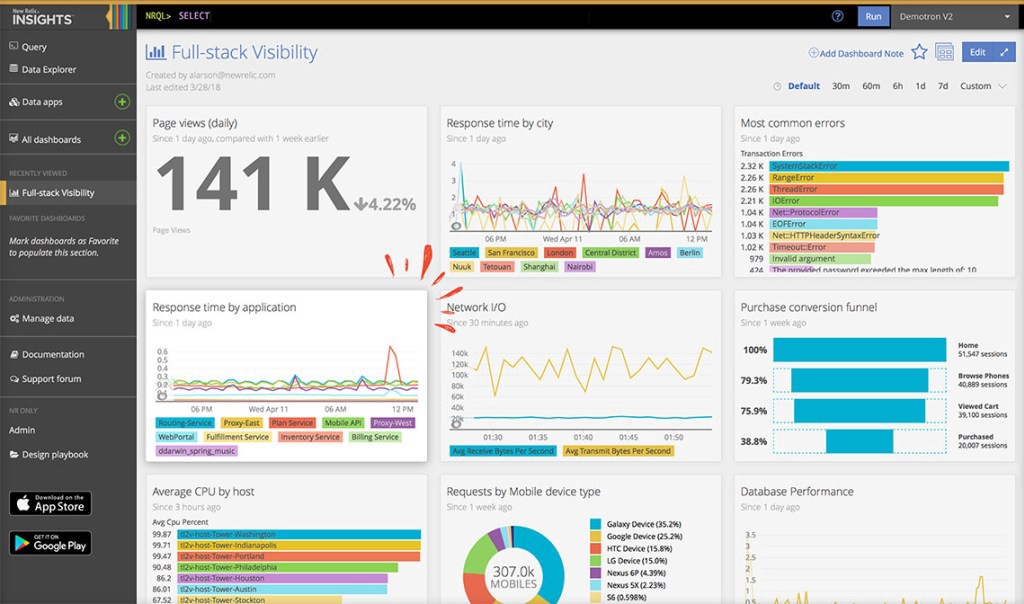 New Relic (Image: NewRelic.com)
AppDynamics
- Considered as an application intelligence platform
- Covers from data collection to processing, monitoring, and deriving insights and knowledge
- Great set of features for enterprise-grade production use
- Cost: $230 per month per server
Stackify Retrace
- Provides method-level visibility to application code that is running in production
- e.g. A slow web request will translate into a trace and from there the problematic methods can be searched
- Underlying tech is similar to Stackify Prefix (Transaction Profiler version from the same vendor), but adjusted to run smoothly in staging and production environments
- Cost: $25?50 per month per server, $10 for non-production
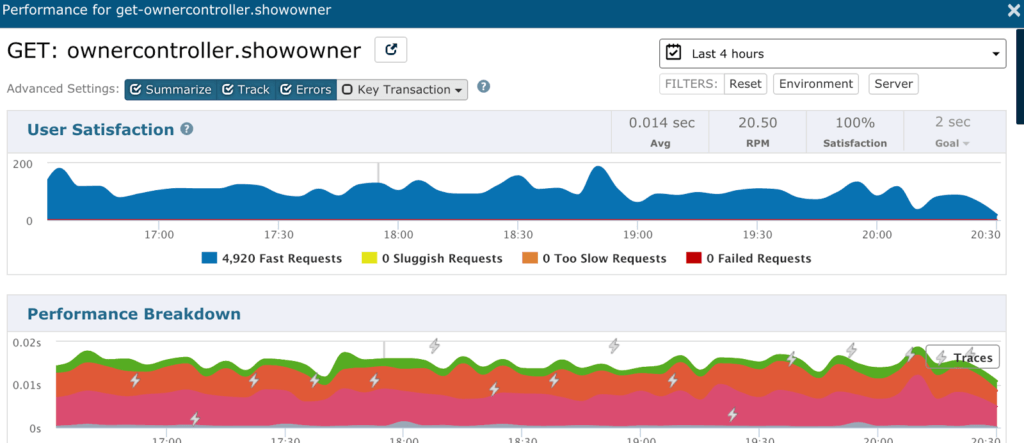 Retrace Screenshot: Web Request Aggregation over 4 hours (Image: Stackify.com)
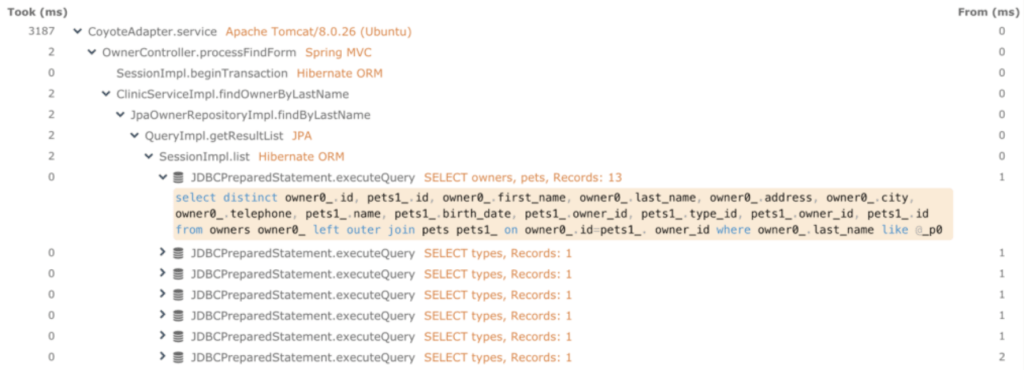 Retrace Screenshot: Tomcat Web Request Trace (Image: Stackify.com)
Dynatrace
- First self-learning Application Performance Monitoring Software (take some time to learn)
- Not only a performance tool, provides auto-discovered topology visualizations of applications and their components
- Performance issues in web-scale applications discovered with artificial intelligence
- Cost: $216 per month per server for SaaS version
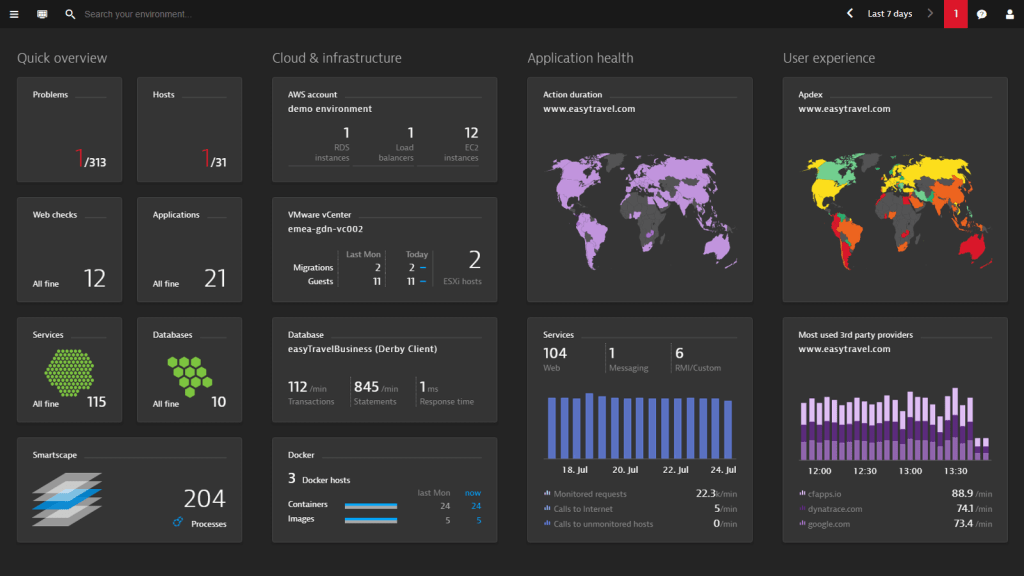 Dynatrace (Image: Dynatrace.com)
Summary
- Standard JVM Profilers and Transaction Profilers are great choices for debugging tasks in development, while APM Tools are the choice for monitoring tasks in production.
- For not-so-large firms, APM Tools can be an overpriced solution to digest (e.g. purchasing a $200-per-month-per-server APM subscription for a $100-per-month AWS server. Wow, seriously?). I would recommend you to start with free tools and go for advanced tools only when you have a real use case.
- People who performance test their application using multiple profilers tend to find more performance issues than just using one.
Be sure to follow me on Twitter @ashen_wgt and send me your feedback, comment any questions you have, let me know your suggestions and I?ll surely check it out/retweet! You can also share this post with your friends and check my other articles on PlatformEngineer.com
References
- List of Java Profilers: 3 Different Types and Why You Need All of Them (https://stackify.com/java-profilers-3-types/?utm_referrer=https%3A%2F%2Fwww.google.lk%2F)
- Developer Productivity Report 2015: Java Performance Survey Results (https://zeroturnaround.com/rebellabs/developer-productivity-report-2015-java-performance-survey-results/)
- Java Memory Management for Java Virtual Machine (JVM) (https://betsol.com/2017/06/java-memory-management-for-java-virtual-machine-jvm/)

