
Many blogs explain these topics separately but not many explain the difference between them.
In simple words:
Variance tells us how much a quantity varies w.r.t. its mean. Its the spread of data around the mean value. You only know the magnitude here, as in how much the data is spread.
Covariance tells us direction in which two quantities vary with each other.
Correlation shows us both, the direction and magnitude of how two quantities vary with each other.
Variance is fairly simple. We now elaborate on covariance and correlation.
Covariance
If 2 quantities have a positive covariance, they increase/decrease together. For example, salary has a positive covariance with respect to no. of hours worked. If a person works for more hours, their salary is higher. Example of a negative co-variance would be the no. of hours you practice a game w.r.t the chances of losing the game. The more you practice, the lesser are your chances of losing the game.
Directional relationship between two variables.

When we calculate the time taken for a ball to reach the ground when thrown from a fixed height, we know that the mass does not affect the time taken. Hence mass has zero covariance to the time taken. Now, if air resistance is high, the ball takes longer to fall. More the resistance, more the time it takes. This is a positive covariance. If the ball is thrown with more force, lesser the time it takes to reach the ground. This is a negative covariance.
Correlation
Correlation shows us both, the direction and magnitude of how two quantities vary with each other. Eg. No. of products bought from a store would have a stronger correlation to the profits than the no. of advertisements would have to the profits.
Hence, Corr(no. of products,profit)>Corr(ads posted,profit).
One must note that both will be positive correlations, with ?no. of products? having a higher positive value.
This is used in feature selection to determine which feature affects the result the most.
A correlation of +1 indicates a perfect positive correlation.
A correlation of -1 indicates a perfect negative correlation.
A correlation of 0 indicates that there is no relationship between the different variables (mass of a ball does not affect time taken to fall).
Values between -1 and 1 denote the strength of the correlation.
Lets take a look at the formulae:
Variance
A random variable is compared against itself.
Var(X) = E(X.X) ? E(X).E(X)
Covariance
Two random variables compared against each other.
Cov(X,Y) = E(X.Y) ? E(X).E(Y)
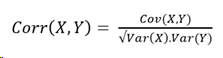
Correlation
Normalized
