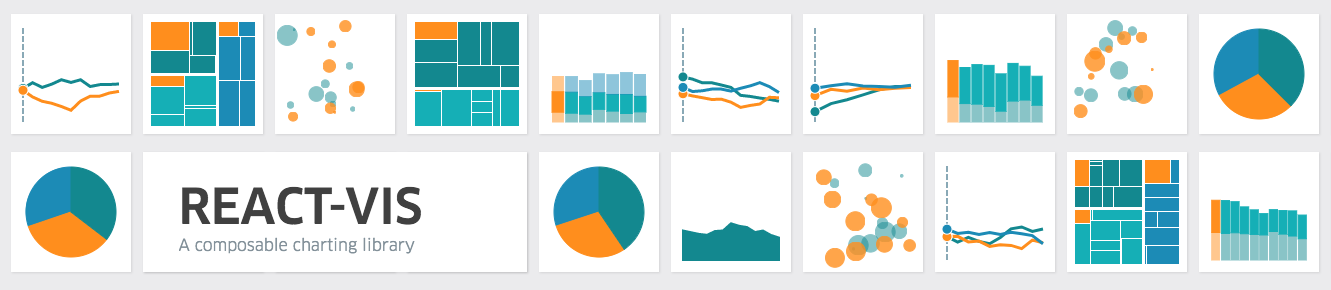
What is react-vis?
React-vis is a React visualization library created by Uber. With it you can easily create common charts, such as line, area, bar charts, pie and donut charts, tree maps and many more.
React-vis is a good option because it is:
- Simple
- Flexible
- Integrated with React.
In this article I want to show how to build a simple line chart using react-vis.
Installation
First of all you need to install react-vis on your project. For demo purpose I used an empty project created with create-react-app.
Installing react-vis is as easy as npm install react-vis –save
Examples
Of course it is supposed that you have some data you want to visualize. For my example I will use dataset from Github Language Statistics with amounts of pull-requests per programming language.
Nothing new here, I fetch data in componentDidMount, than set state of my app and pass it as a props to the child component. As I am interested in JavaScript statistics, I also filter results.
import React, {Component} from ‘react’;import ‘./App.css’;import Chart from ‘./components/chart’const API_URL = “https://nataliia-radina.github.io/react-vis-example/”;class App extends Component { constructor(props) { super(props) this.state = { results: , }; } componentDidMount() { fetch(API_URL) .then(response => { if (response.ok) { return response.json() } else { throw new Error (‘something went wrong’) } }) .then(response => this.setState({ results: response.results.filter((r)=>{ return r.name === ‘JavaScript’; }) }) )} render() { const {results} = this.state; return ( <div className=”App”> <Chart data={results}/> </div> ); }}export default App;
Now let?s move further to our Chart component.
Chart component is a functional component because it has no state. On my chart I want to display the number of pull-requests at the specific period of time. That is why I will go for a simple LineSeries diagram.
To be able to use it I import the necessary components from the library
import {XYPlot, XAxis, YAxis, VerticalGridLines, LineSeries} from ‘react-vis’;
XYPlot is a wrapper for the rest of elements. Axes are there to show X and Y axis. VerticalGridLines to create a grid and LineSeries is a type of chart itself.
Simple use-case
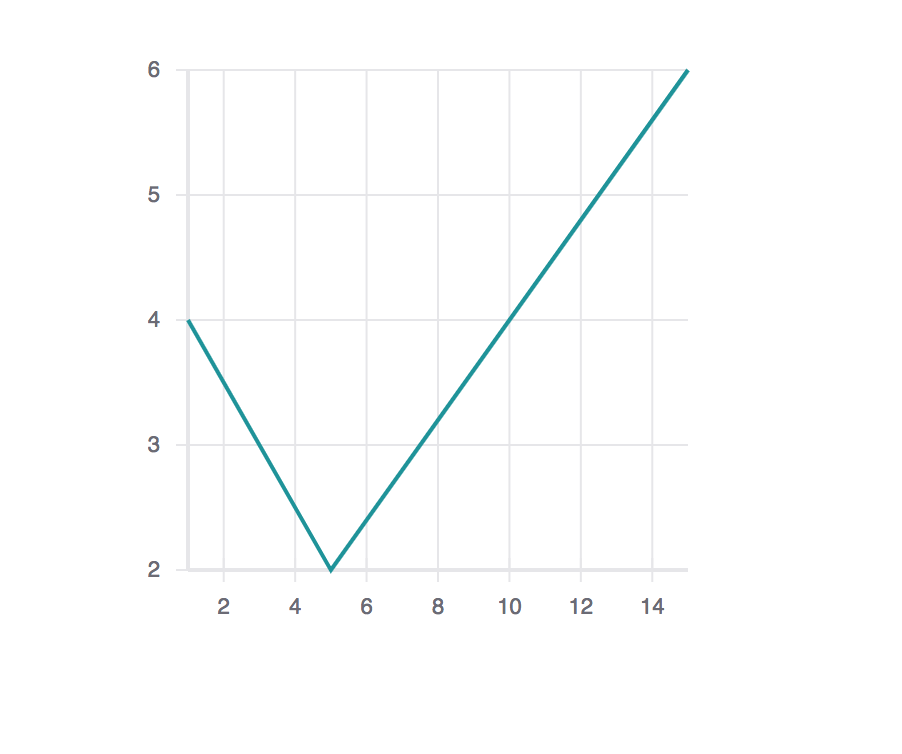
Now let?s create chart component with some random data first, just to get an idea how it works:
import React from ‘react’;import {XYPlot, XAxis, YAxis, VerticalGridLines, HorizontalGridLines, LineSeries} from ‘react-vis’;const Chart = (props) => { return ( <XYPlot width={300} height={300}> <VerticalGridLines /> <HorizontalGridLines /> <XAxis /> <YAxis /> <LineSeries data={[ {x: 1, y: 4}, {x: 5, y: 2}, {x: 15, y: 6} ]}/> </XYPlot> );}export default Chart;
As you can see I pass an array of objects containing x and y values I want to show on the diagram to LineSeries component.
And here comes some magic! My chart component at this point looks like this :
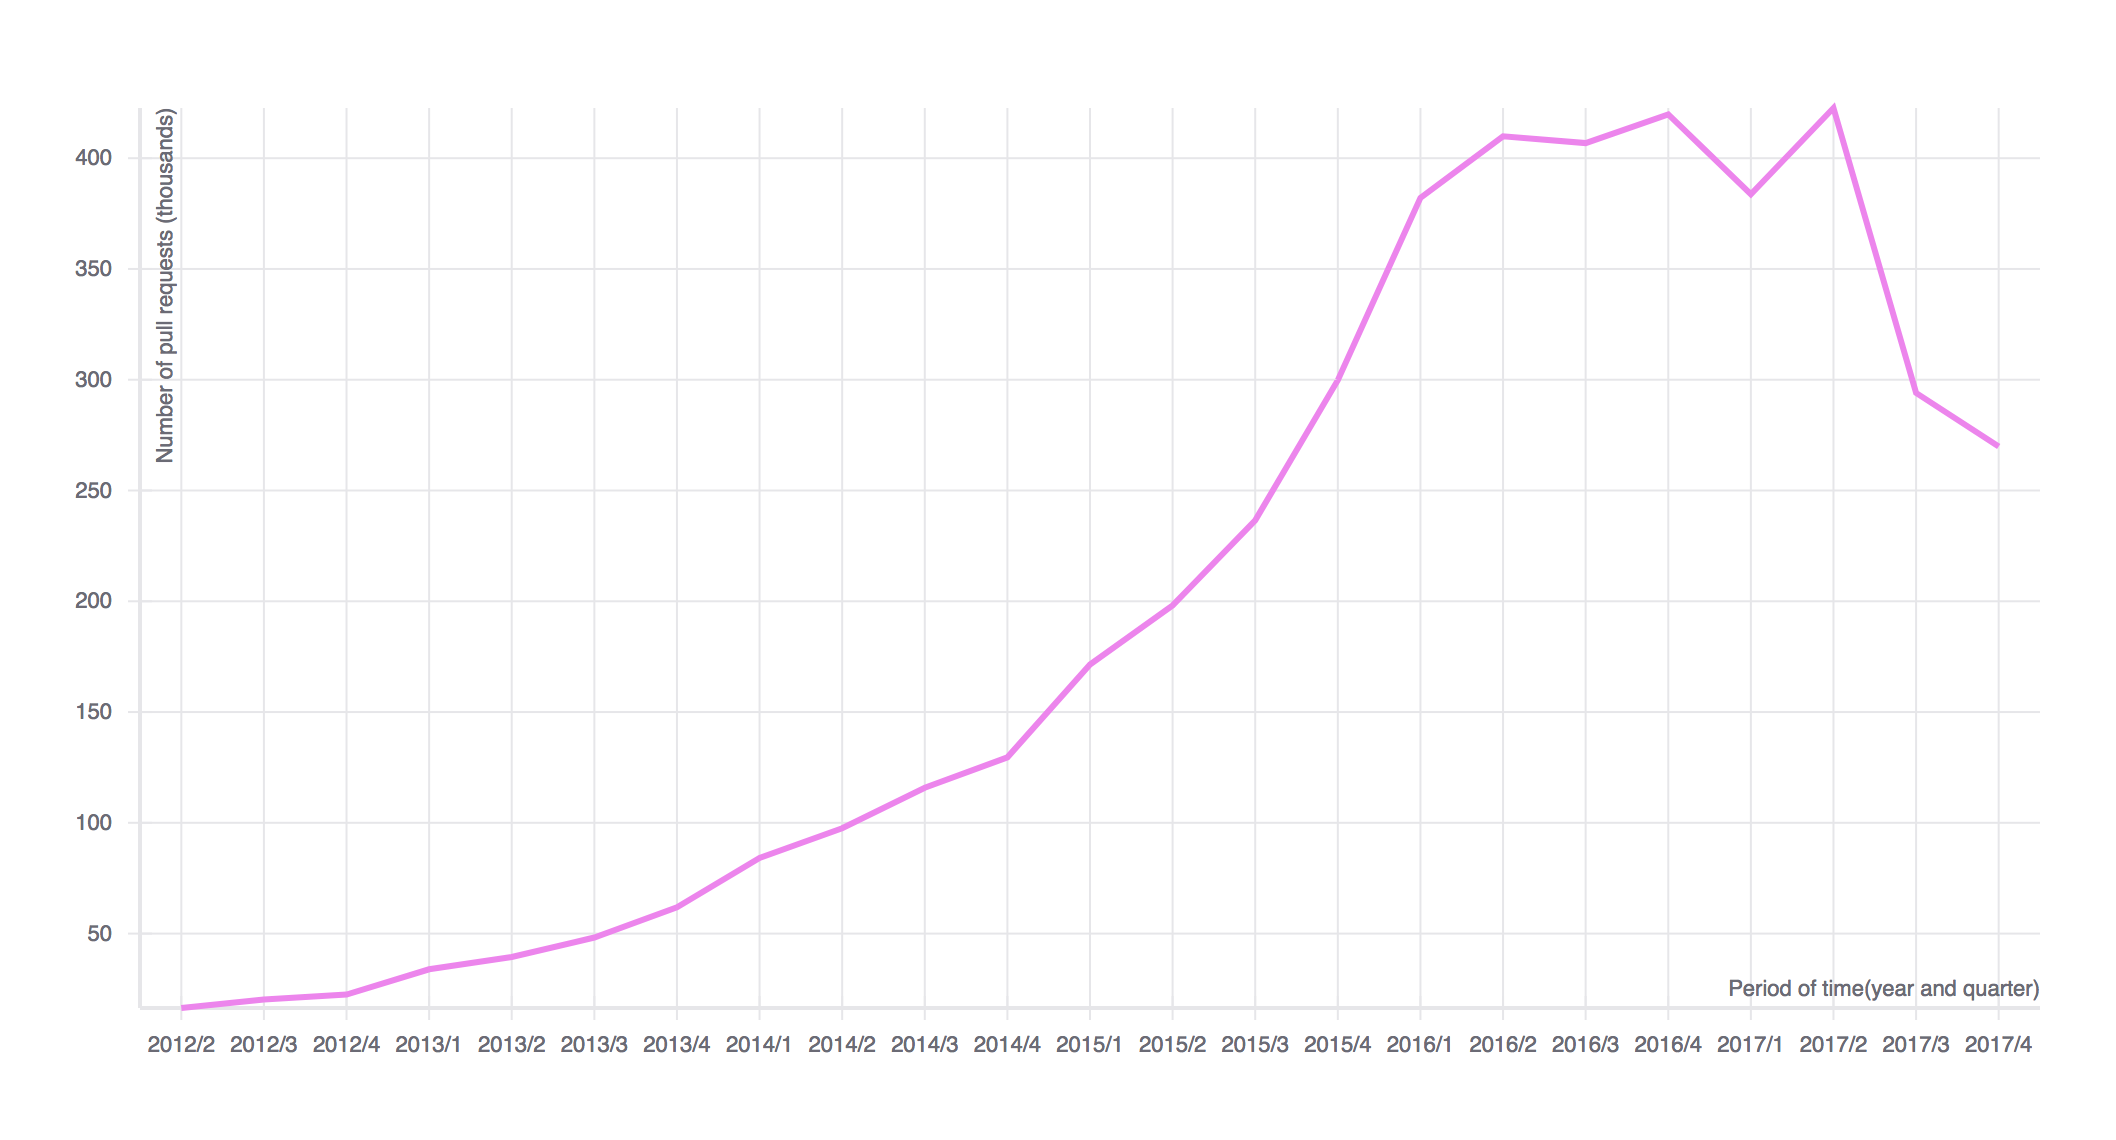
Applying real data
Now let?s pass actual data to our component. I want to show the amount of pull-requests for a specific period of time. It is ?count?, and both ?year? and ?quarter? from my dataset. So I will create an array with x and y values from this data:
const dataArr = props.data.map((d)=> { return {x: d.year + ‘/’ + d.quarter, y: parseFloat(d.count/1000)}});
Let?s see what happens when I pass my array to LineSeries component
<LineSeries data={dataArr}/>
Because on the x axis I want to show quarters, I need to specify the type of the axes as following:
xType=”ordinal”
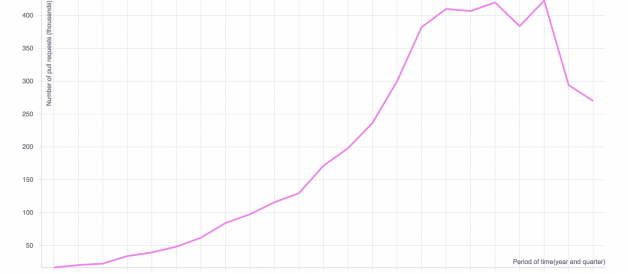
Not bad, but I still want to modify the look of my chart a little bit. So I will add some styles as well:
<LineSeries data={dataArr} style={{stroke: ‘violet’, strokeWidth: 3}}/>
Here is the full code for chart component:
import React from ‘react’;import {XYPlot, XAxis, YAxis, VerticalGridLines, HorizontalGridLines, LineSeries} from ‘react-vis’;const Chart = (props) => { const dataArr = props.data.map((d)=> { return {x: d.year + ‘/’ + d.quarter, y: parseFloat(d.count/1000)} }); return ( <XYPlot xType=”ordinal” width={1000} height={500}> <VerticalGridLines /> <HorizontalGridLines /> <XAxis title=”Period of time(year and quarter)” /> <YAxis title=”Number of pull requests (thousands)” /> <LineSeries data={dataArr} style={{stroke: ‘violet’, strokeWidth: 3}}/> </XYPlot> );}export default Chart;
And here we go:
Conclusion
I hope that you are convinced now that react-vis is easy to use powerful tool. It is a good choice for presenting any type of data.
For further information and experiments check react-vis documentation and examples.
Enjoy your data visualization!

