A data dictionary is a list of key terms and metrics with definitions, a business glossary. While it is sounds simple, almost trivial, its ability to align the business and remove confusion can be profound. In fact, a data dictionary is possibly one of the most valuable artifacts that a data team can deliver to the business.
Most businesses have at least one concept, term, or metric that is used or interpreted differently among teams. When this happens, confusion reigns. Decision makers may disagree about what the data show and what actions to take. Reports among teams might show different numbers for the same metric from the same data source due to inconsistent business logic. Teams may even argue about the correct definition and defend their turf, perhaps because their definition makes their numbers look better. This is not good for business.
Once you have a data dictionary, it is a document that all staff can reference and be on the same page, it makes onboarding new staff easier, and the business intelligence (BI) team have crystal clear requirements for implementation of those metrics.
To be clear, here, we are not considering raw database table documentation although that is important too, but a higher-level list of business terms and metrics. How does the business as a whole think of ?user?, ?revenue?, or ?cost of acquisition?? Does everyone have the same understanding or ?sales territory?, ?average ship time?, or ?session?? The goal should be that a junior, non-technical member of staff, such as a customer service agent, will be able to read the section for their part of the business and understand the relevant terms but sufficiently detailed and accurate to capture the business logic of those metrics.
In this post, I?ll detail some best practices surrounding data dictionaries and a process of how to create one. This is by no means the only process that will work but it has at least worked for me. Here, I assume that the BI team are driving this process. In my view, they should own the data dictionary and the implementation of metrics in BI tools.
1. Collect terms
The first step is to compile a list of terms. That is, the BI team should create a spreadsheet with a list of the names of the business concepts and metrics (measures) and how data is sliced and diced (the dimensions). While this sounds daunting, one approach is to go business team by business team and examine a sample of all their standard reports and dashboards. List out all the axis labels from charts, column headers from report tables, and the dimensions of how data is pivoted. Thus, a report showing revenue by territory (for some time period) yields two key terms: ?revenue? and ?territory?. At this stage, you are just compiling a list of term names not their definitions.
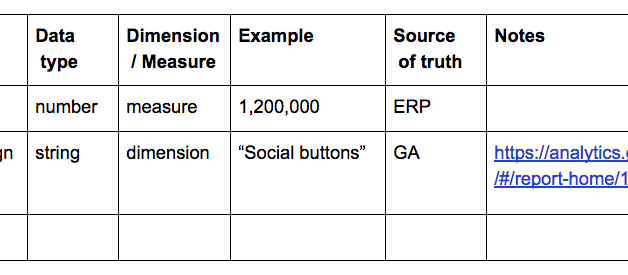
The output is a list of team name, term name, data type, an example value or two, and perhaps a link to an example report using that term. Additional columns the can be useful to add are a column indicating whether this is a dimension or measure (there is generally more agreement on dimensions than measures), and a column specifying the source of truth.
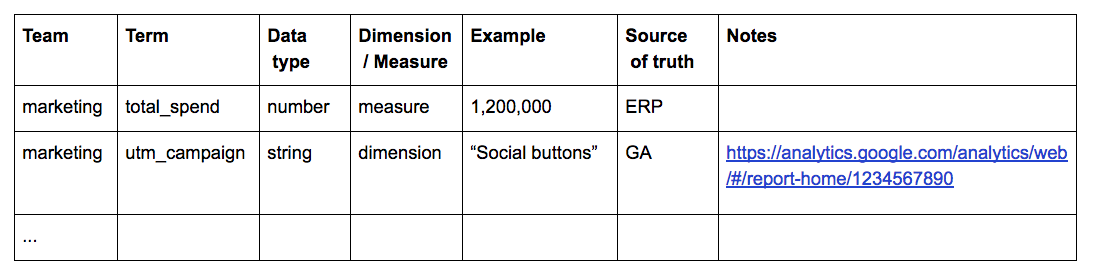 Step 1: a list of terms without definitions
Organize and group the list by business function, such as financial metrics, marketing metrics, customer service metrics etc. You may also want to break out really generic dimensions (?year?, ?product_id?, ?country? etc) that span across many teams to their own section too.
The list is probably not as long as you might expect. That is because teams tend to have a relatively small set of metrics that they are trying to track and optimize with a relatively small set of levers at their disposal ? for instance, online marketing might focus on a few key facets such as campaign, channel, spend, and segment.
Ask the business team to take a look over the list, especially their section and add any terms that are missing. If they have a robust set of dashboards and reports, you probably have a comprehensive list. If they do not, then this provides additional concepts that are valuable to collect.
2. Define terms
The BI team should now make a first pass at trying to collate or create definitions.
First, pull any definitions from any existing documentation. This could be from a wiki, annual reports, or from actual code such as SQL queries or Excel macros. Definitions should be clear and unambiguous. If it is clearer to show a simple formula (such as ARPU = total_revenue / number_subscribers) rather than write out a definition then show that. Most staff should be able to understand the definition, even if they need to cross reference some of the terms.
Second, sit down with the teams, one by one, and ask for their help to set out any missing definitions or to refine the definitions. (You?ll make better progress starting with a definition, even if wrong, than with a blank cell.) This may require some back and forth until you get some agreement within that team. It may also require some research on how a metric is currently calculated.
Importantly, don?t ask ?what is the current definition?? but ?how should this be defined?? If the current implementation is not their ideal definition, this is the perfect chance for the business team to set out their ideal state. For instance, this is a chance to simplify if you have inherited an overly complex definition. Once that ideal definition is captured then there is additional pressure on the data team, tech team, or other parts of the business to deliver on that metric as defined.
3. Identify conflicts
This is a key step: root out any terms where its definition differs among teams.
4. Get alignment
For those terms that differ among teams, bring the relevant teams into the same room (and lock the door). Have them discuss how and why they differ.
For this meeting, there should be agreement with only 2 outcomes:
* one team agrees to adopt definition of the other team.
* they have legitimate reasons why they differ. In this case, agree on a new name for one or both terms.
(A third option where both teams agree to modify their definition to some common definition is possible but less likely.)
Names should be as long as necessary to avoid ambiguity or confusion. If ?community_adjusted_editba? is a more appropriate and apt term which distinguishes it from regular ?ebitda?, then use that longer, more descriptive term. The goal is to eliminate confusion not to be terse.
5. Get Sign off
Have the team heads sign off. This is crucial. You don?t want the BI team defining a term and the business team secretly disagreeing. In that case, the business will just go and implement their own logic in Excel and you are back to square one. As the domain experts and as the people who will be making business decisions based on those metrics, those business owners have to be fully on board.
At Warby Parker, we leveraged the help of the co-CEOs to require that team heads sign off and do that by a certain date. The team heads are busy and a data dictionary may not seem top-priority, even if they can see the value. Thus, this top-down support proved to be very valuable.
6. Publish
Publish the data dictionary as a single page document where it is accessible to the whole company ? thus, not just in a BI tool. These definitions should be widely understood and adopted, not just by execs, analysts, and decision makers, but by all staff. Therefore, visibility is crucial. If the company uses a wiki heavily, them publish there. It should should be where people expect.
Conceptually, these terms are independent of any single system or data source and thus are not tied to a BI tool. However, the individual definitions should also be baked into the BI tools where possible. If the tool supports this, when you mouse over a dimension or measure, the definition and example should pop up.
Given that these definitions might appear in multiple places, the data team should strive to auto-generate the data dictionary from a single source, such as a database table or code repository, rather than manually maintain a static table. For instance, at Warby Parker, our data dictionary was generated from a Jenkins job. If the repository was modified, it regenerated our documentation (a dedicated internal website or ?data book? for all data documentation).
7. Maintain
While key metrics should be relatively stable, there may be legitimate business reasons why a metric?s definition might has to change. That change and new definition should come from the business team. However, it will require the help of the data team to implement the change and communicate it.
The BI team should assess the impact of the change before it is rolled out. For instance, prepare a chart showing the metric with both the old and new definition of the metric to set expectations of how the numbers might change.
Treat that definition change like a product release: communicate the definition change in advance, tell people what to expect, and document the change in the data dictionary, such as with a change log at the bottom of the document.
Do not let different systems get out of sync; hence, why auto-generation of documentation is valuable.
To create a data dictionary following the process above is not a small effort. It will likely take a few months as it requires conversations and coordination among many members of staff. It is a large team effort, driven and coordinated by the BI team, but requiring broad buy in, cooperation, and effort, and a dash of top-down reinforcement.
I do not suggest taking the process piecemeal. For instance, don?t create a fully-baked marketing data dictionary with the expectation of getting to finance data dictionary at a later date. This makes it harder to get to those (step 4) alignment discussions among teams, and that is where the real payoff happens. Also, the sequential nature makes it is easier to lose steam. You need the concurrent discussions among teams with a common sign off date to achieve the goal.

