In my previous post of Data Cleaning, we discussed How to Handle Missing Values. In this post, we?re going to be looking at how to scale and normalize data. If you are comfortable with this technique, you can skip to A Machine Learning Classification Model in Python ? Part I.
To get started, Download the required Dataset which I?m going to use in this post. You can download it from my GitHub link.
Here?s what we?re going to do today:
- Get our environment set up
- Scaling vs. Normalization: What?s the difference?
- Practice scaling
- Practice normalization
Let?s get started!
Get our environment set up
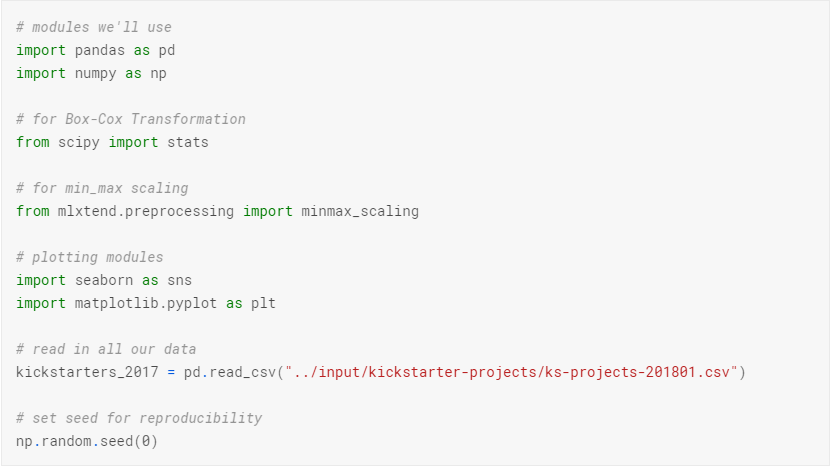
The first thing we?ll need to do is load in the libraries and datasets we?ll be using.
Now that we?re set up, let?s learn about scaling & normalization. (If you like, you can take this opportunity to take a look at some of the data.)
Scaling vs. Normalization: What?s the difference?
One of the reasons that it?s easy to get confused between scaling and normalization is because the terms are sometimes used interchangeably and, to make it even more confusing, they are very similar! In both cases, you?re transforming the values of numeric variables so that the transformed data points have specific helpful properties. The difference is that, in scaling, you?re changing the range of your data while in normalization you?re changing the shape of the distribution of your data. Let?s talk a little more in-depth about each of these options.
Scaling
This means that you?re transforming your data so that it fits within a specific scale, like 0?100 or 0?1. You want to scale data when you?re using methods based on measures of how far apart data points, like support vector machines, or SVM or k-nearest neighbors, or KNN. With these algorithms, a change of ?1? in any numeric feature is given the same importance.
For example, you might be looking at the prices of some products in both Yen and US Dollars. One US Dollar is worth about 100 Yen, but if you don?t scale your prices methods like SVM or KNN will consider a difference in price of 1 Yen as important as a difference of 1 US Dollar! This clearly doesn?t fit with our intuitions of the world. With currency, you can convert between currencies. But what about if you?re looking at something like height and weight? It?s not entirely clear how many pounds should equal one inch (or how many kilograms should equal one meter).
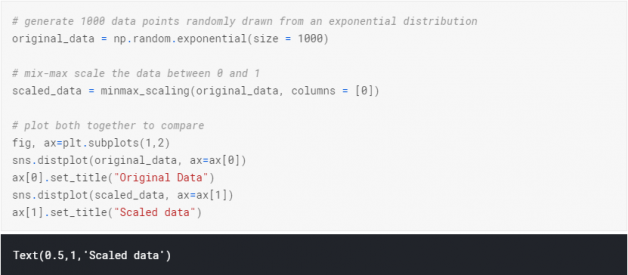
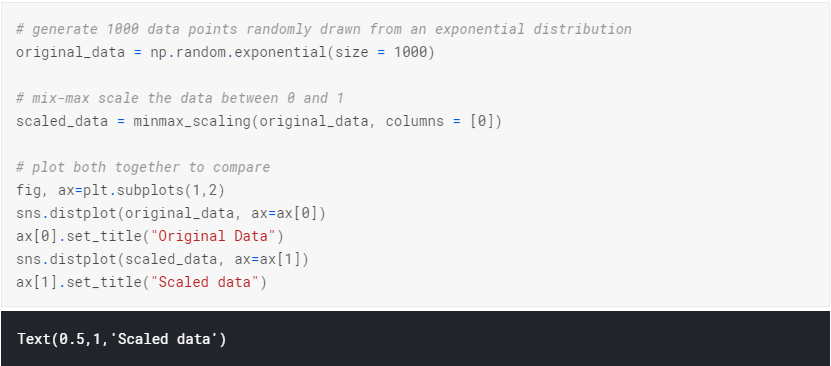
By scaling your variables, you can help compare different variables on equal footing. To help solidify what scaling looks like, let?s look at a made-up example. (Don?t worry, we?ll work with real data in just a second, this is just to help illustrate my point.)
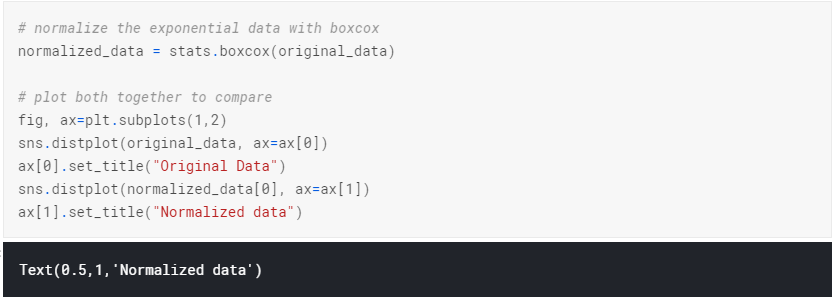
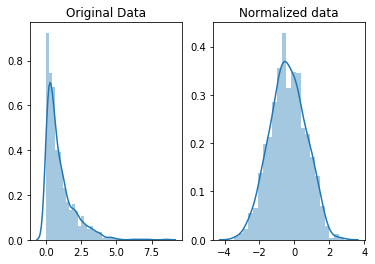
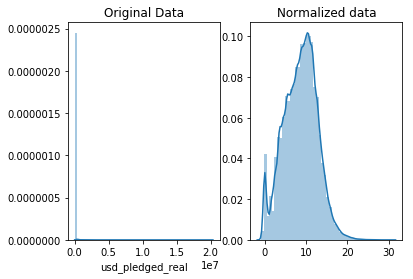
Notice that the shape of our data has changed. Before normalizing it was almost L-shaped. But after normalizing it looks more like the outline of a bell (hence ?bell curve?).
Your turn!
For the following example, decide whether scaling or normalization makes more sense.
- You want to build a linear regression model to predict someone?s grades given how much time they spend on various activities during a normal school week. You notice that your measurements for how much time students spend studying aren?t normally distributed: some students spend almost no time studying and others study for four or more hours every day. Should you scale or normalize this variable?
- You?re still working on your grades study, but you want to include information on how students perform on several fitness tests as well. You have information on how many jumping jacks and push-ups each student can complete in a minute. However, you notice that students perform far more jumping jacks than push-ups: the average for the former is 40 and for the latter only 10. Should you scale or normalize these variables?
Practice scaling
To practice scaling and normalization, we?re going to be using a dataset of Kickstarter campaigns. (Kickstarter is a website where people can ask people to invest in various projects and concept products.)
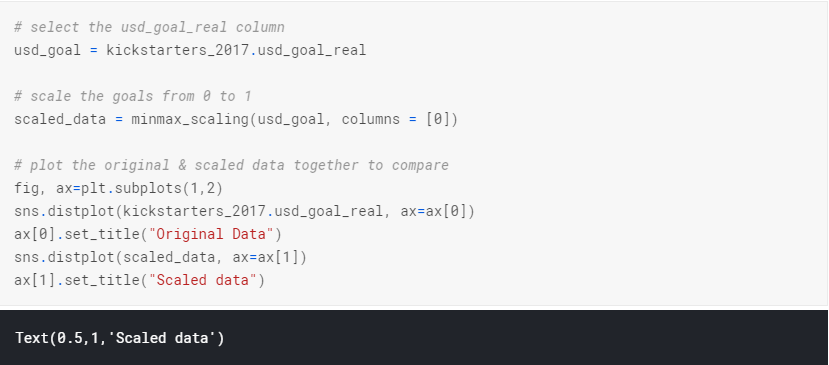
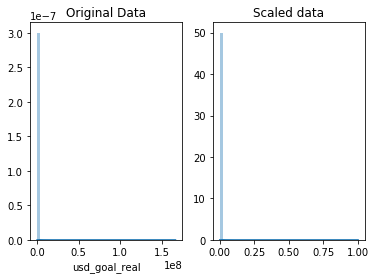
Let?s start by scaling the goals of each campaign, which is how much money they were asking for.
Practice normalization
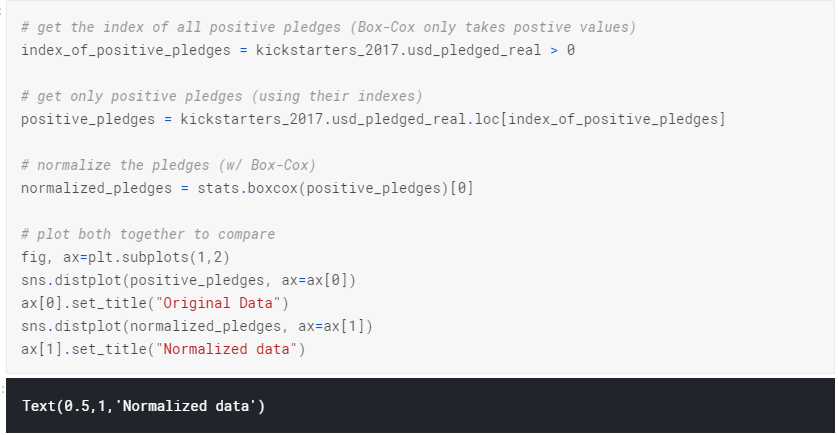
Ok, now let?s try practicing normalization. We?re going to normalize the amount of money pledged to each campaign.
And that?s it! In my next Post on Data Cleaning, I’ll discuss How to Parse Dates.
If you have any questions, be sure to post them in the comments below.
I welcome feedback and constructive criticism and can be reached on Facebook.
You may also like my article over ReactJS.
Happy coding!!
