
If something works in reality, an economist would be interested in whether it works in theory.
You have probably heard of the marketing people saying ?product A and product B are complementary?. It is a widely used concept in the design of an optimal product mix. The idea is that a retailer can increase its sales by offering products that are complementary to each other. A supermarket might put bread and butter on the same shelf to make the customer more likely to purchase both at the same time; a fast-food restaurant is likely to offer a variety of soda-drinks for customers to include with their meal.
A hidden concept is that the definition of ?complementarity? and ?substitutability? really depends on what you are talking to. Fanta and Coke might be substitutable to some customer, but any supermarket who sells Coke will probably sell Fanta as well ? because they are complementary products to attract people who are interested in buying soda drinks. Hold up a minute! Did you mean substitutable goods could be complementary too? Yes, and that?s because the plain English definition of ?complements? and ?substitutes? are not rigorous enough to discuss the topic methodologically.
What do we mean by complements/substitutes?
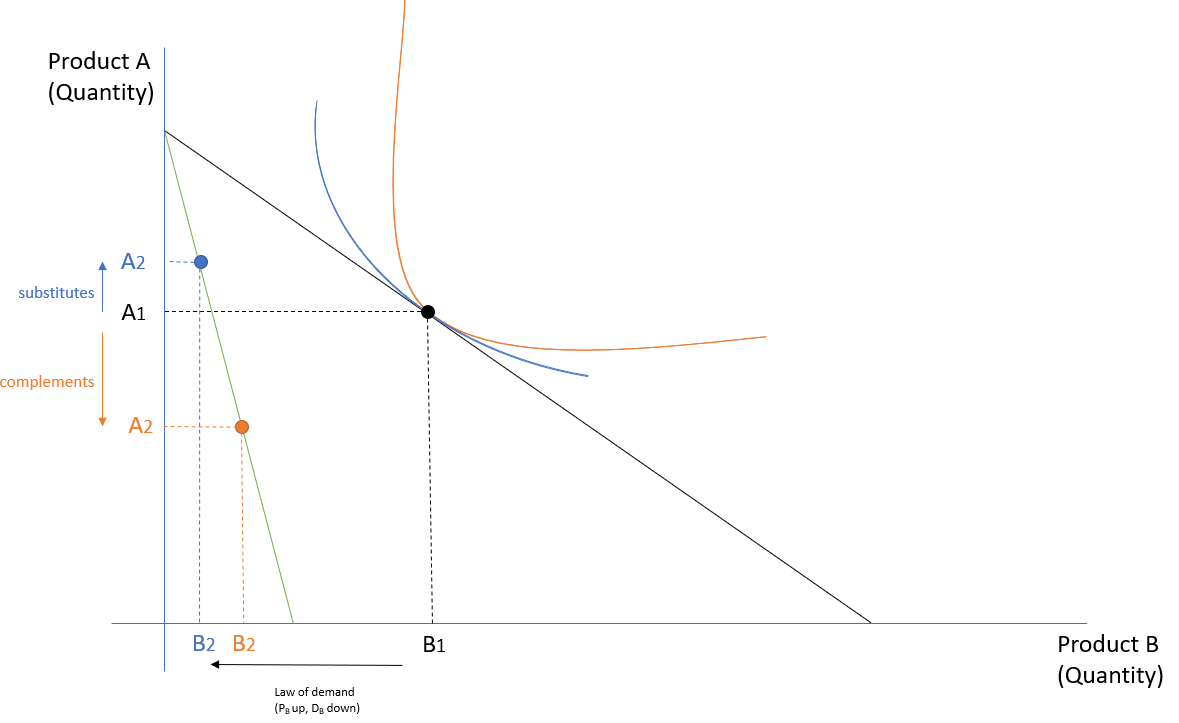
When we say something is complementary to something else, what we mean is that it is ideal to have them both. But as explained above, whether it is ideal to have something together really depends on your goal. But in economics, there is a well-established definition of ?substitutes? vs ?complements? that is invariant to who you are talking to. It goes like the following: ?Product A and B are substitutes if the consumption of A will increase when the price of B increases, all else equal.? The definition of ?complements? is the opposite ? ?Product A and B are complements if the consumption of A will increase when the price of B decreases, all else equal.?
This definition seems unnecessary at first but provides a consistent explanation to a lot of the things we observe in reality ? including why highly substitutable goods can be complementary to a seller (as I said, when something works in reality, an economist is interested in whether it holds in theory).
The structural perspective
The definition of complements/substitutes in economics is a classical structural approach to a problem ? i.e. it builds rules based on rules (see more in my previous article about causation vs correlation). The base assumption is the Law of Demand, which states that when the price of a good increase, its demand fall, all else equal. The law is in turn based on other assumption about how human preference work. Without getting into the technical details, you only need to understand (or be convinced) that when the (relative) price of product A increases, it is human nature to look for substitutes ? so the demand for goods that are substitutes to the product A will increase. It follows that if the demand for product B increase as a result of the increase in the price of product A, these two products are very substitutable. For complements, the definition goes the other way ? when the price of product A increases, the demand for A will decline based on the Law of Demand; then, the demand for B will also decline if A and B are often consumed together (i.e. complements).
How does this definition help to explain the complementarity of highly suitability goods to a seller? Well, the definition above is based on a structural model of human preference ? it does not create any new assumption other than the law of demand. Consequently, we have established a link between the extent of substitutability (or complementarity) and our assumption about human preference. Specifically, whether product A and B are complementary depends on how fast the marginal rate of substitution change along the indifference curve. As explained in Wikipedia, goods that are completely substitutable with each other are called perfect substitutes ? They may be characterized as goods having a linear utility function or a constant marginal rate of substitution.
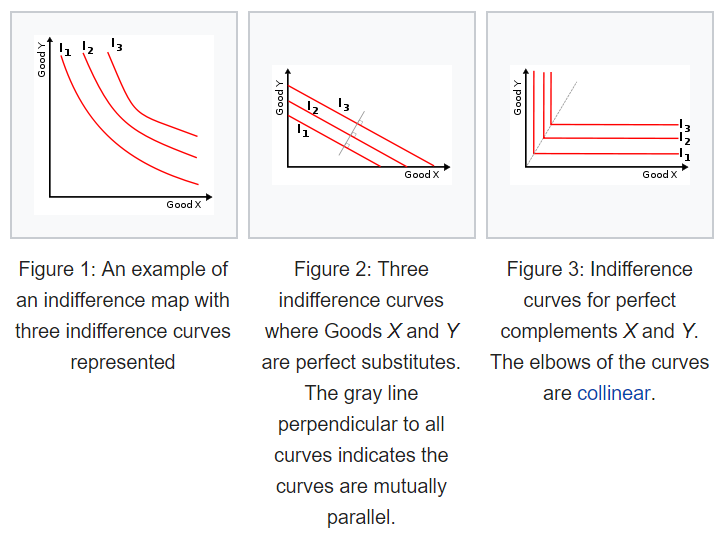 Indifference curve for two goods X and Y if they are perfect substitutes (middle) or perfect complements (right) or anything in between (left). The image is from Wikipedia.
Intuitively, the slope of the utility curve (marginal rate of substitution) measures a person?s willingness to trade A for B conditional on how much of A or B the person already possess. The starting point is that everything is complementary???thinking about money and leisure. If I already have a lot of money but not much leisure, I would be willing to sacrifice a lot of money in exchange for leisure; if I already have a lot of leisure but not much money, I would be willing to work more hours in exchange for extra pay. So naturally, an indifference curve should have a ?convex? shape where the slope flattens along the axis (left chart from above). However, in the case of perfect substitutes, a certain amount of A is valued as the same as a certain amount of b regardless of how much A or B one possesses. For example, if I always value one can of Coke the same as one can of Pepsi no matter what. My marginal rate of substitution is going to be one which means my indifference curve is a straight line (like the middle chart from above). I will let you think about the scenario where the two goods are perfect complements.
Here is the punch line: if I am always willing to trade one Coke for one Pepsi, and I am in a mood to buy some, I will always buy the cheaper one. Technically this means the indifference curve will ?intercept? with the budget constraint at either the X or Y axis ? meaning that I will never buy both unless their prices are the same (then I am indifferent which is not very interesting).
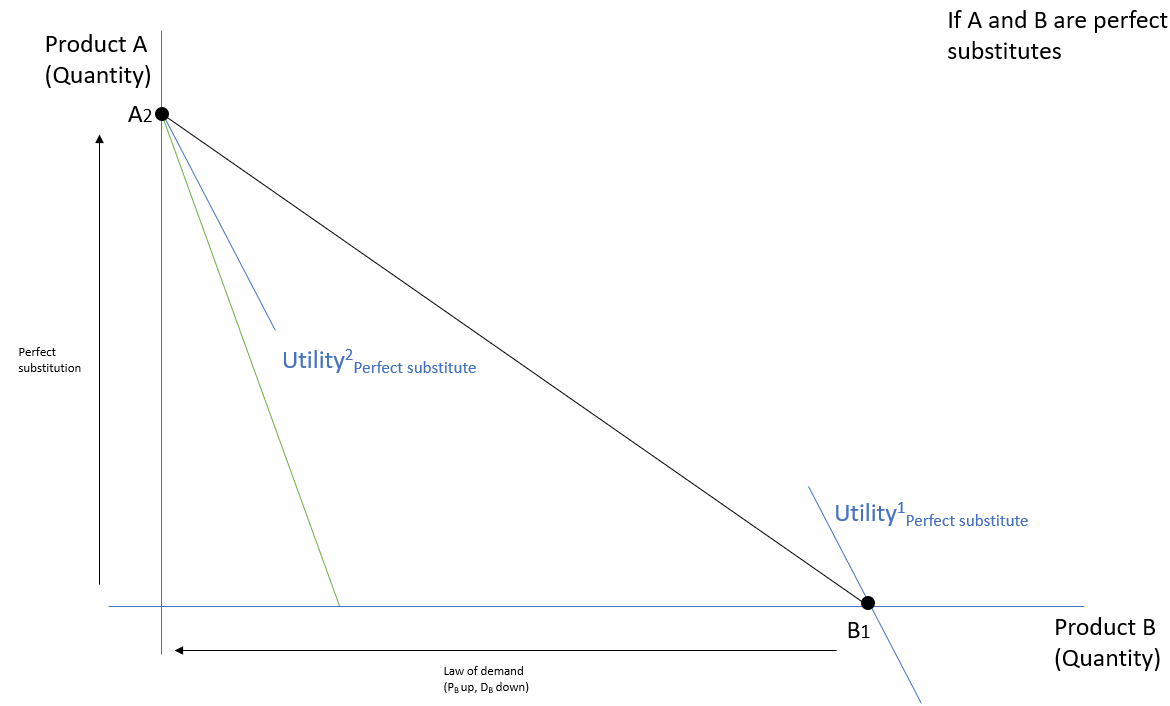
From the seller?s point of view, if two products are so highly substitutable to the extent of perfect, one type of customers will always buy A and the other type will always buy B at their given relative prices ? but if you only offer the cheaper one, a customer is likely to buy anyway (if it is not offered elsewhere in the ?local? area).
The empirical perspective
In reality, we can never ?observe? the decision-making process in people?s mind. Instead, all we see is their actual behavior. In the era of big data, it is not uncommon for retailers to track how often do customers buy something together, either in the same transaction or during a certain period. Such data can be collected either from a loyalty program or direct access to bank account transactions.
Now, the relevant question is, would the structural thinking we have been through help us to develop a ?practical complementarity? index to advise a seller whether he/she should provide both A and B, using the transaction data? The answer is yes. First of all, there is a standard way of measuring the ?association? between the purchase of A and B ? Yule?s Q. The idea is to compute the average probability of A and B being bought together (or neither), relative to the probability of either one being purchased alone.
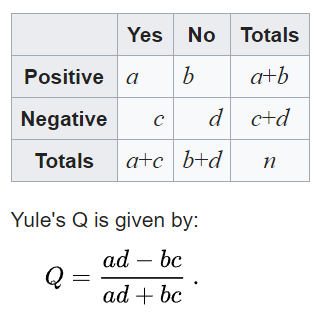 Definition of Yule?s Q from Wikipedia
The Yule?s Q above is calculated based on whether Product A and B are bought together ? that?s called ?transaction Yule?s Q?. A similar figure can be calculated based on whether customers who bought A has also bought B (during a longer period of time) ? that?s called ?customer Yule?s Q?.
From what we have learned from the structural theory from Economics, we can use a combination of the transaction and customer Yule?s Q to come up with a better measure of ?practical complementarity?. If product A and B have very low transaction Yule?s Q (they are rarely bought together at the same time) but very high customer Yule?s Q (they are often bought by the same customer during a longer period of time), then the two goods are highly substitutable???so the complementarity depends on the distribution of different type of customers in the market and the relative cost of provision???selling only the cheap product might be optimal???an example is to just provide one type of soda-drinks in your local fast-food restaurant. In the opposite scenario where the two goods are often bought together (a higher transaction Yule?s Q implies a higher customer Yule?s Q), it becomes a no-brainer to provide both as they are ?directly complementary????an example is to provide at least one type of soft drink in your local fast-food restaurant.
Summary
The structural approach provides a causal link between the observed shopping behavior (whether people buy A and B together) with the fundamental assumption about human preference (how fast do you lost interest in A after you have acquired a lot, and instead pursue B).
The empirical perspective provides a practical way of measuring ?complementarity? between two products from a seller?s perspective. This can be really helpful in designing the optimal product mix ? which is very common question to be asked if you are a data analyst working for a company that sells different type of consumer products (e.g. a supermarket or shopping mall, etc.)

