Visual Studio Code a.k.a VS Code has quickly become one of the most popular general-purpose text editor. It is fast, has great extension system, and last but not the least, has an appealing UI. We are interested in trying C++ on VS Code, but couldn?t find a guide simple enough to build and debug C++ for Mac (macOs High Sierra 10.13.6). This guide will focus on how to do that.
Prerequisites:
Clang needs to be installed first. There are 2 ways to install Clang on Mac:
- Download XCode from AppStore, it will automatically install Clang
- Run xcode-select –install on terminal
Install VS Code:
- VS Code can be downloaded from here.
- Double-click to install it.
Steps to build and run C++:
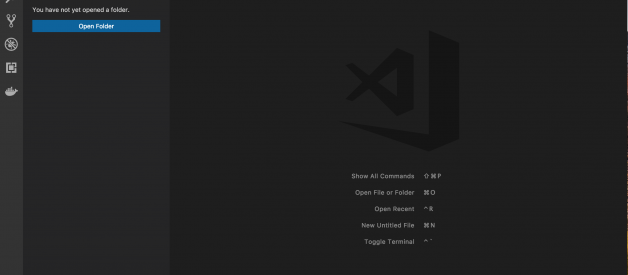
- Open VS Code.
- Open explorer tab (Cmd + Shift + E).
- To create a new project, click Open Folder.
- Create a new folder named hello and open it. Workspace folder is needed in order for build and debug commands to work.
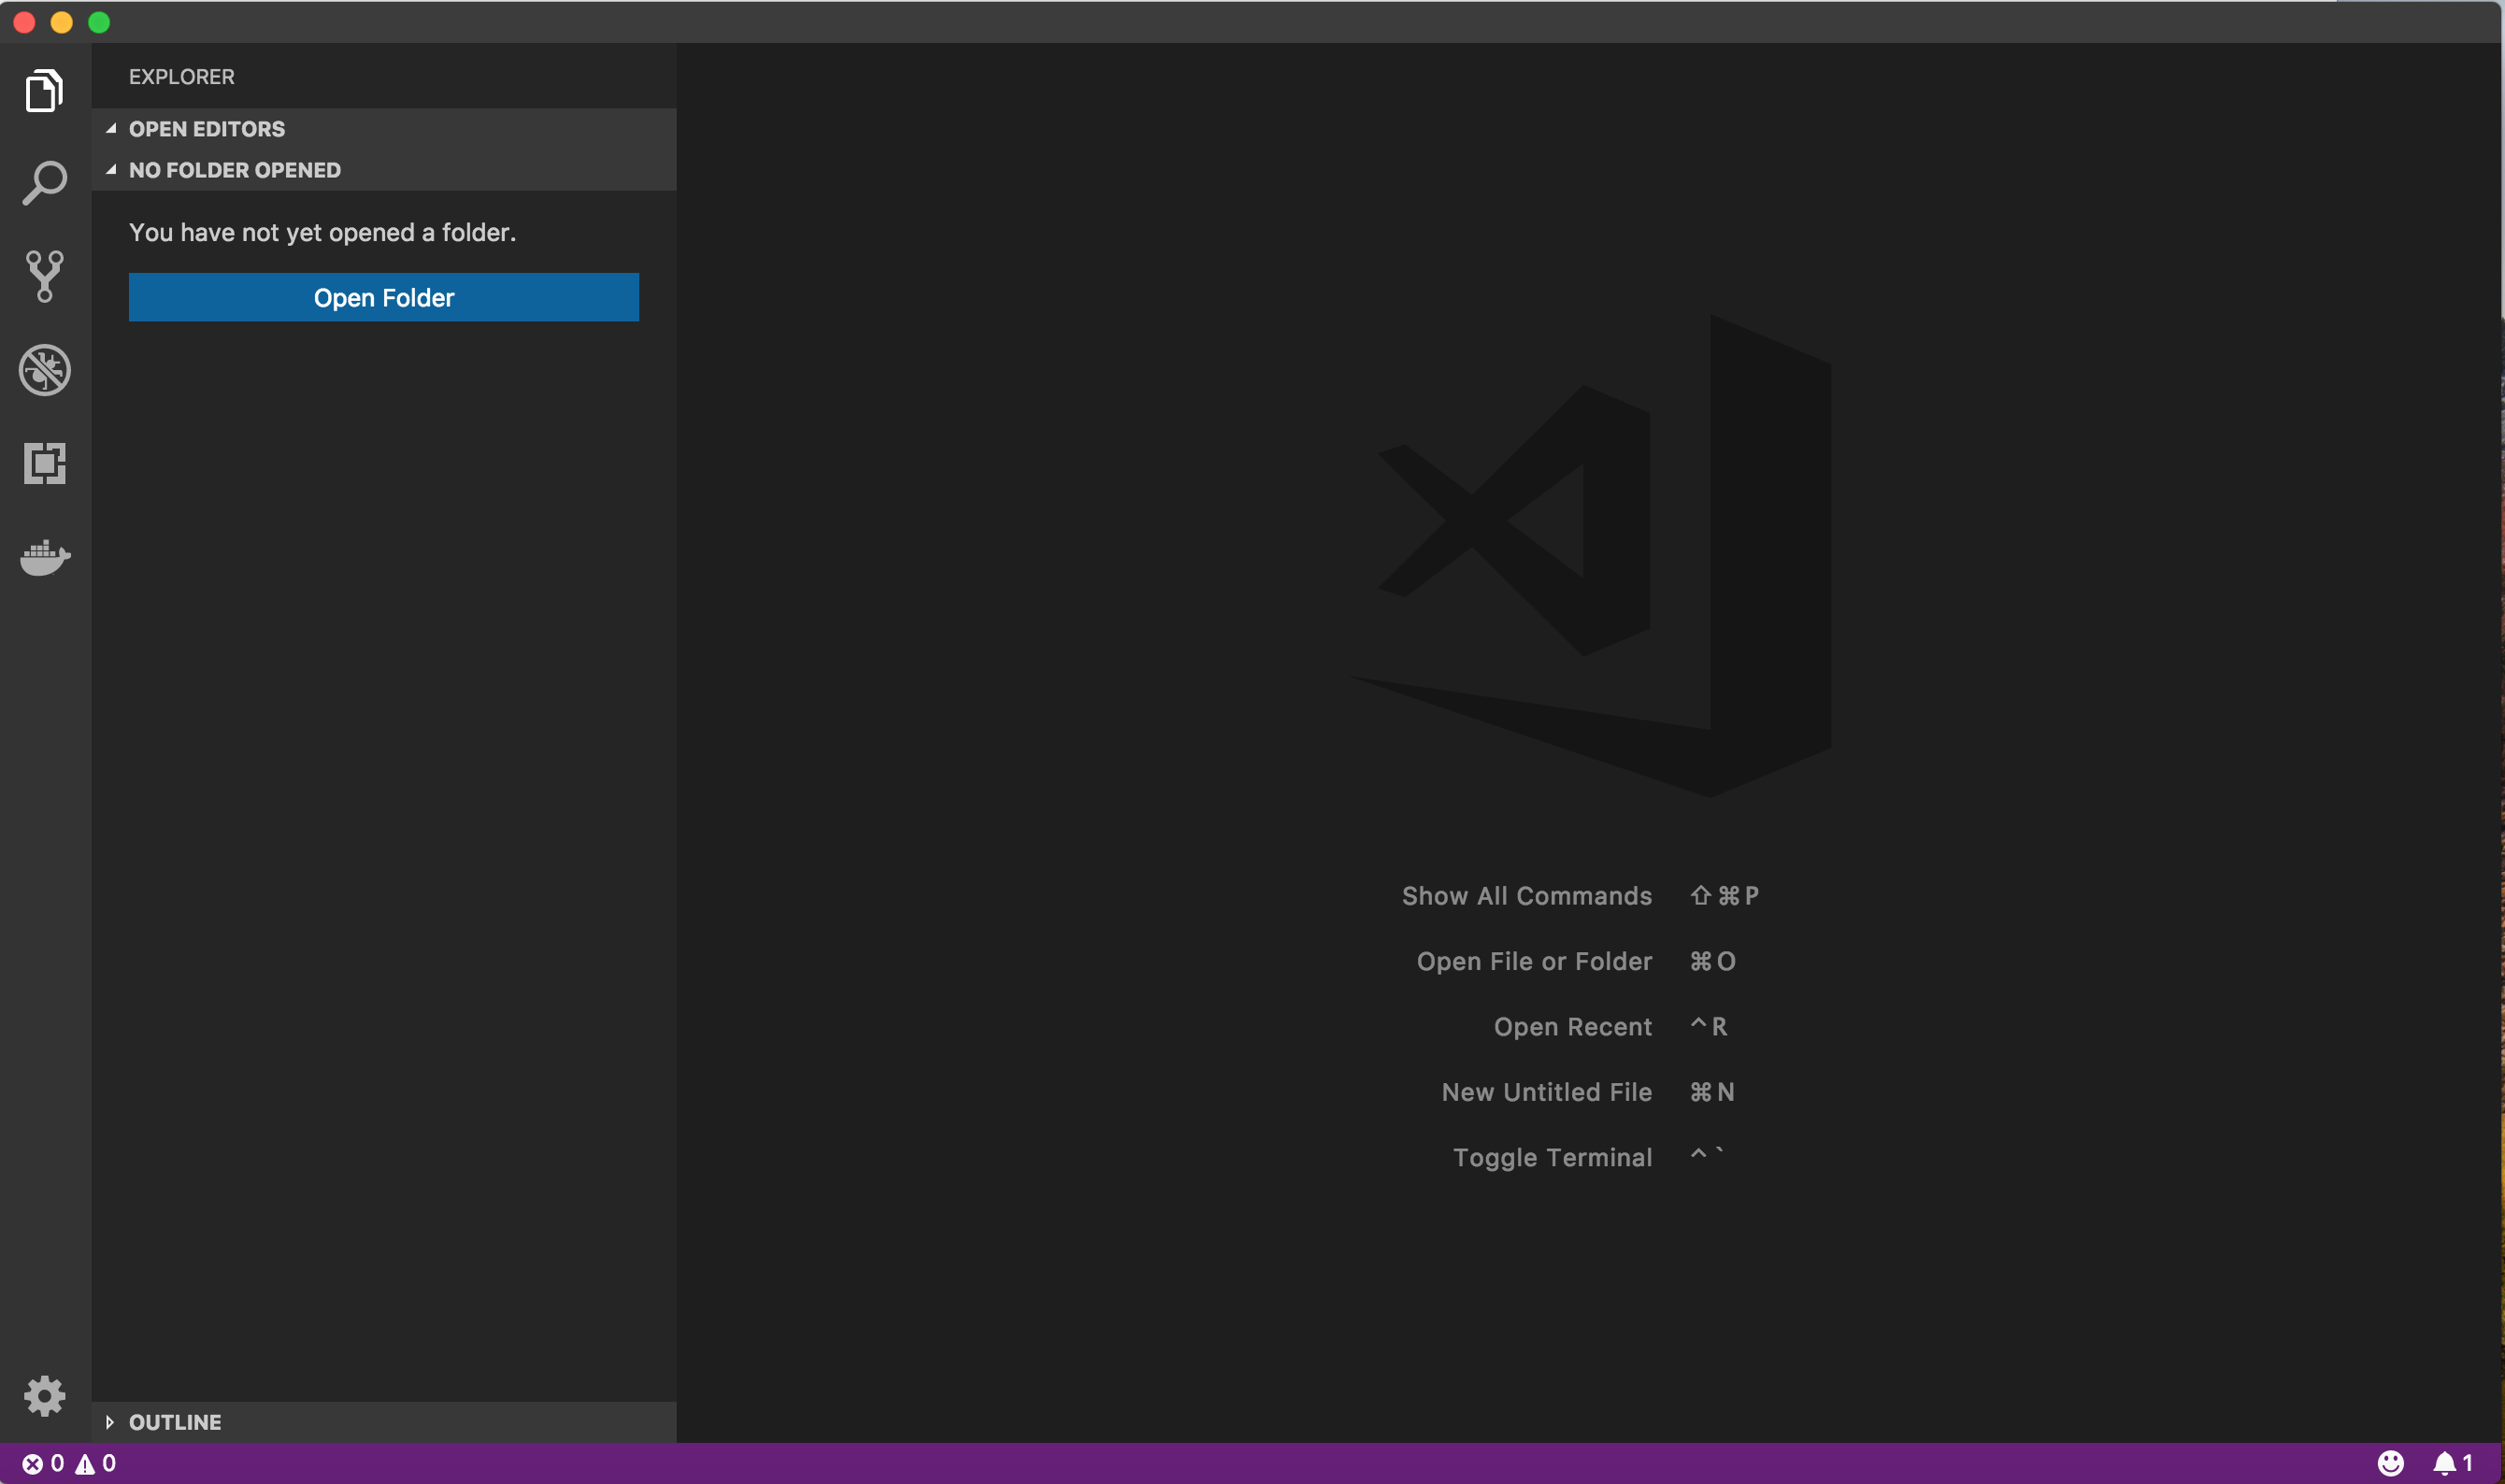 Explorer tab
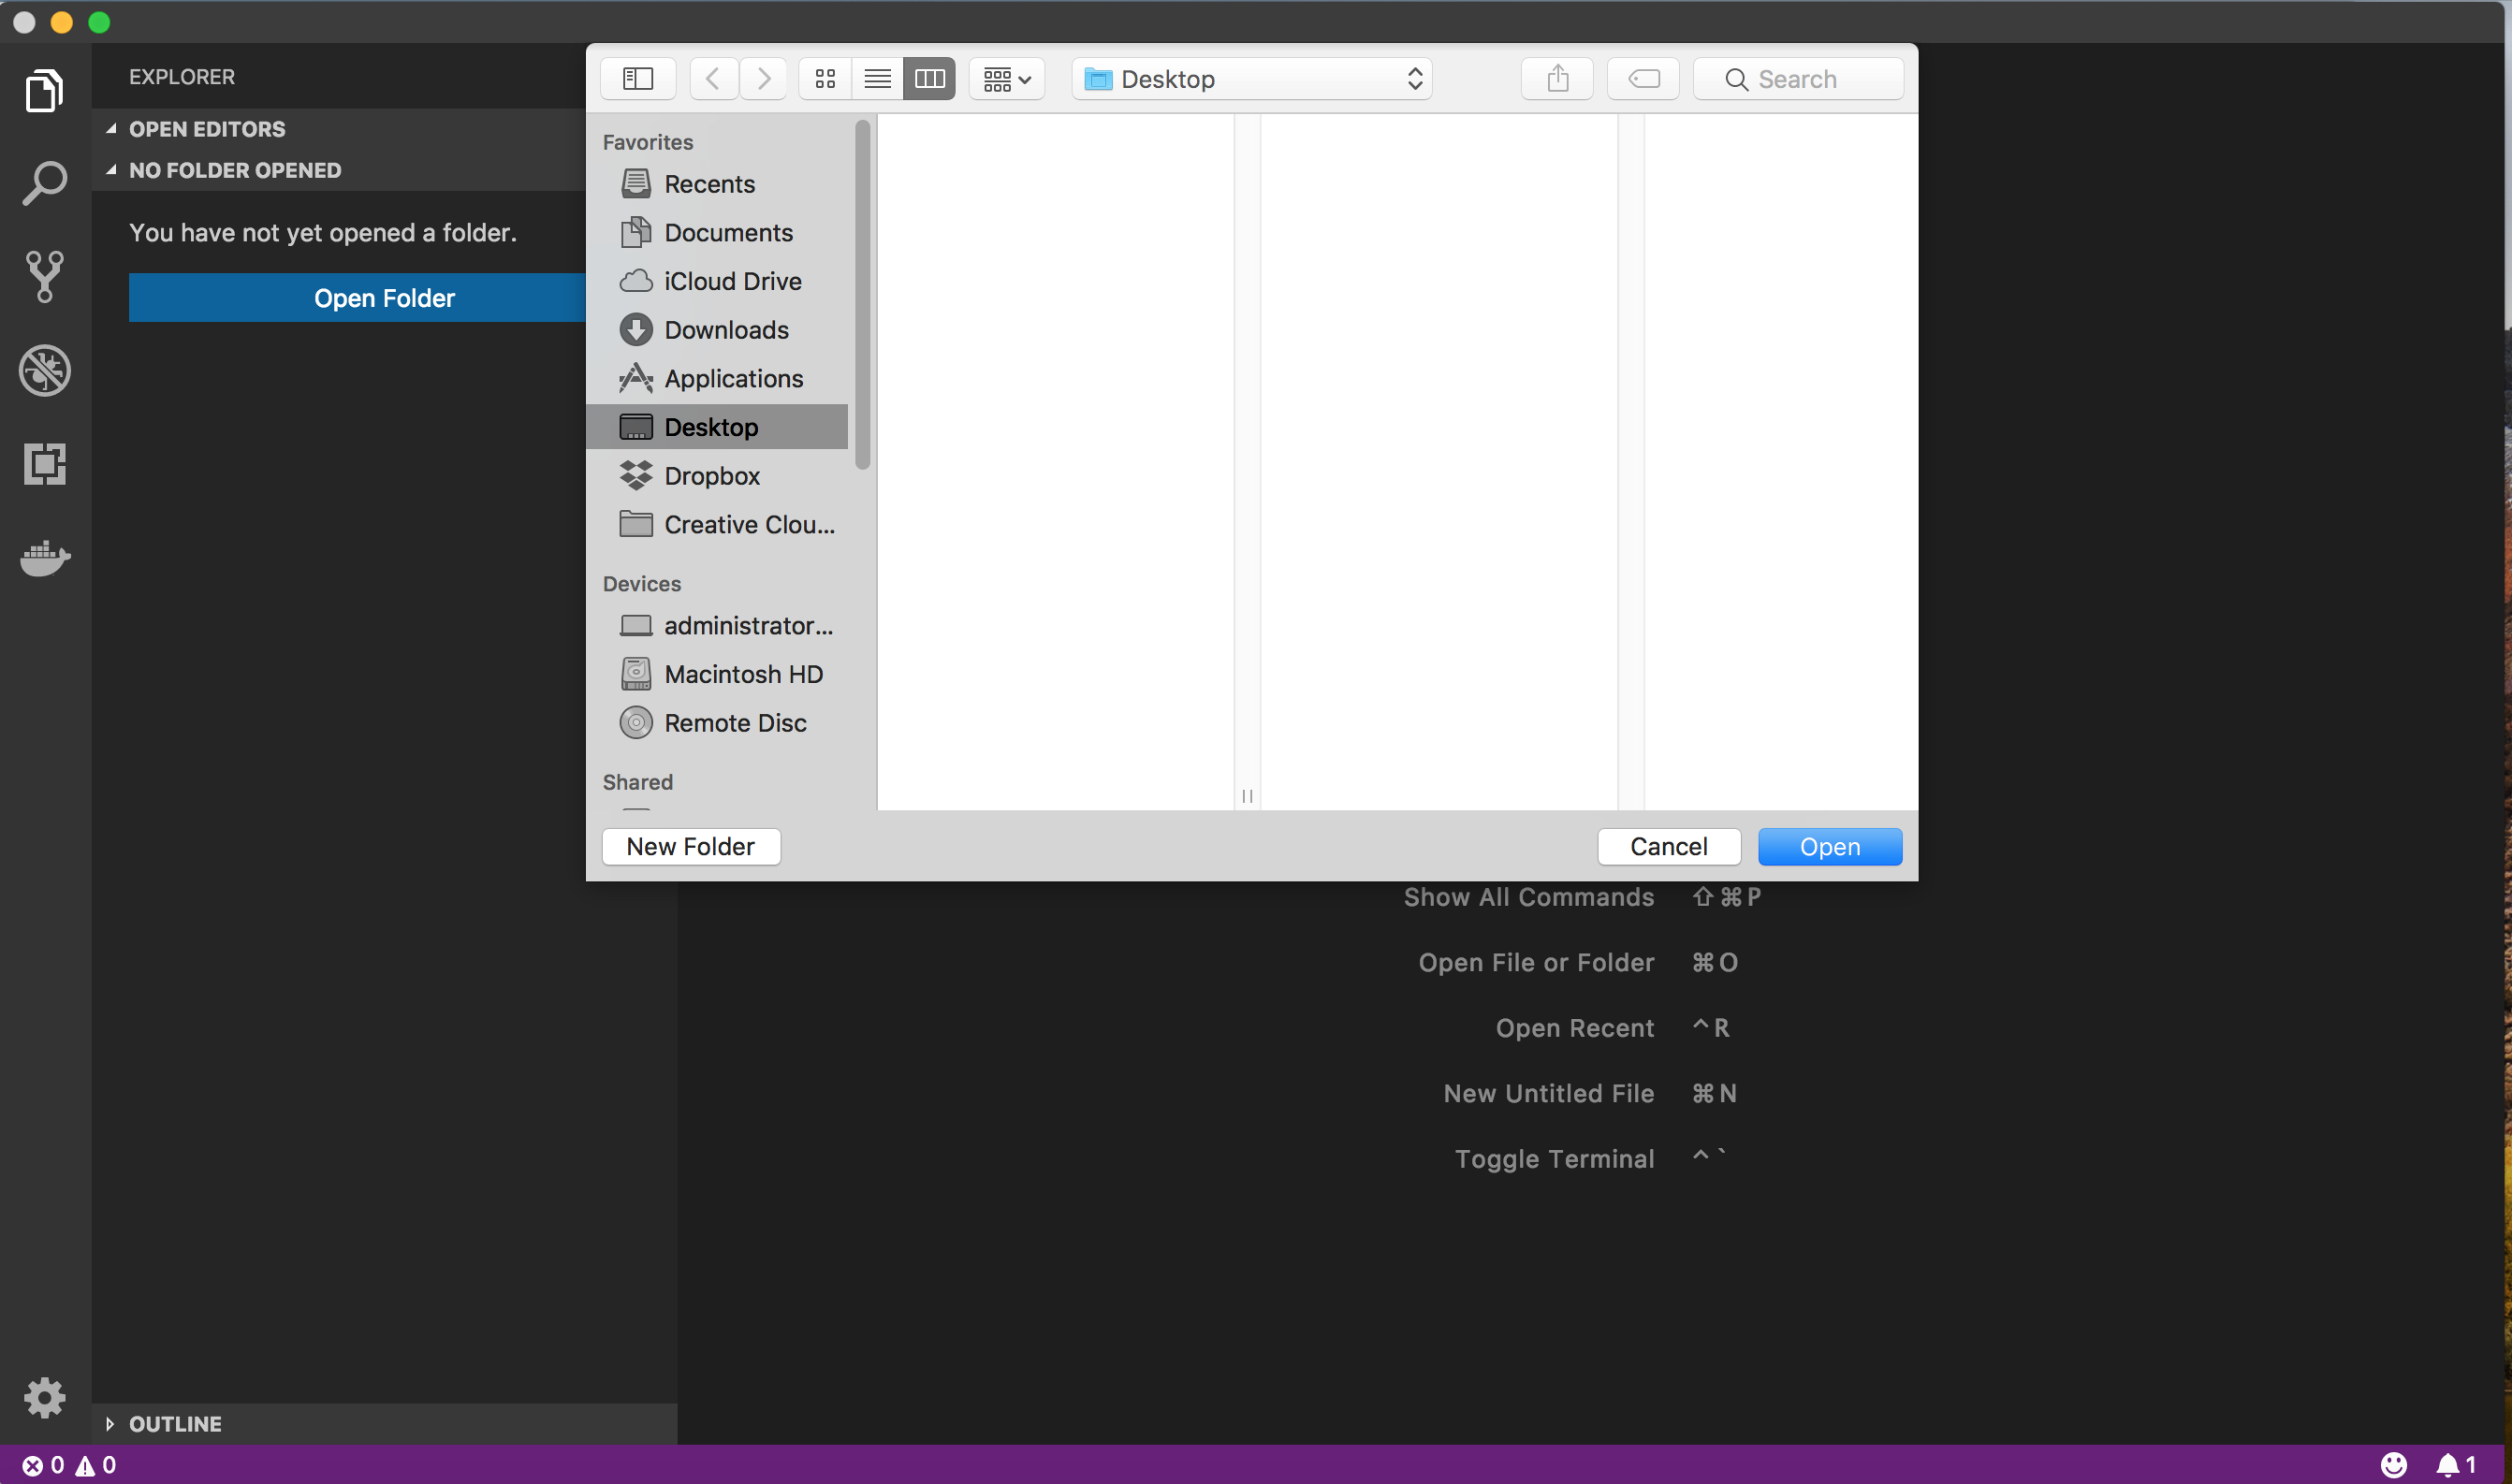 Create a new folder
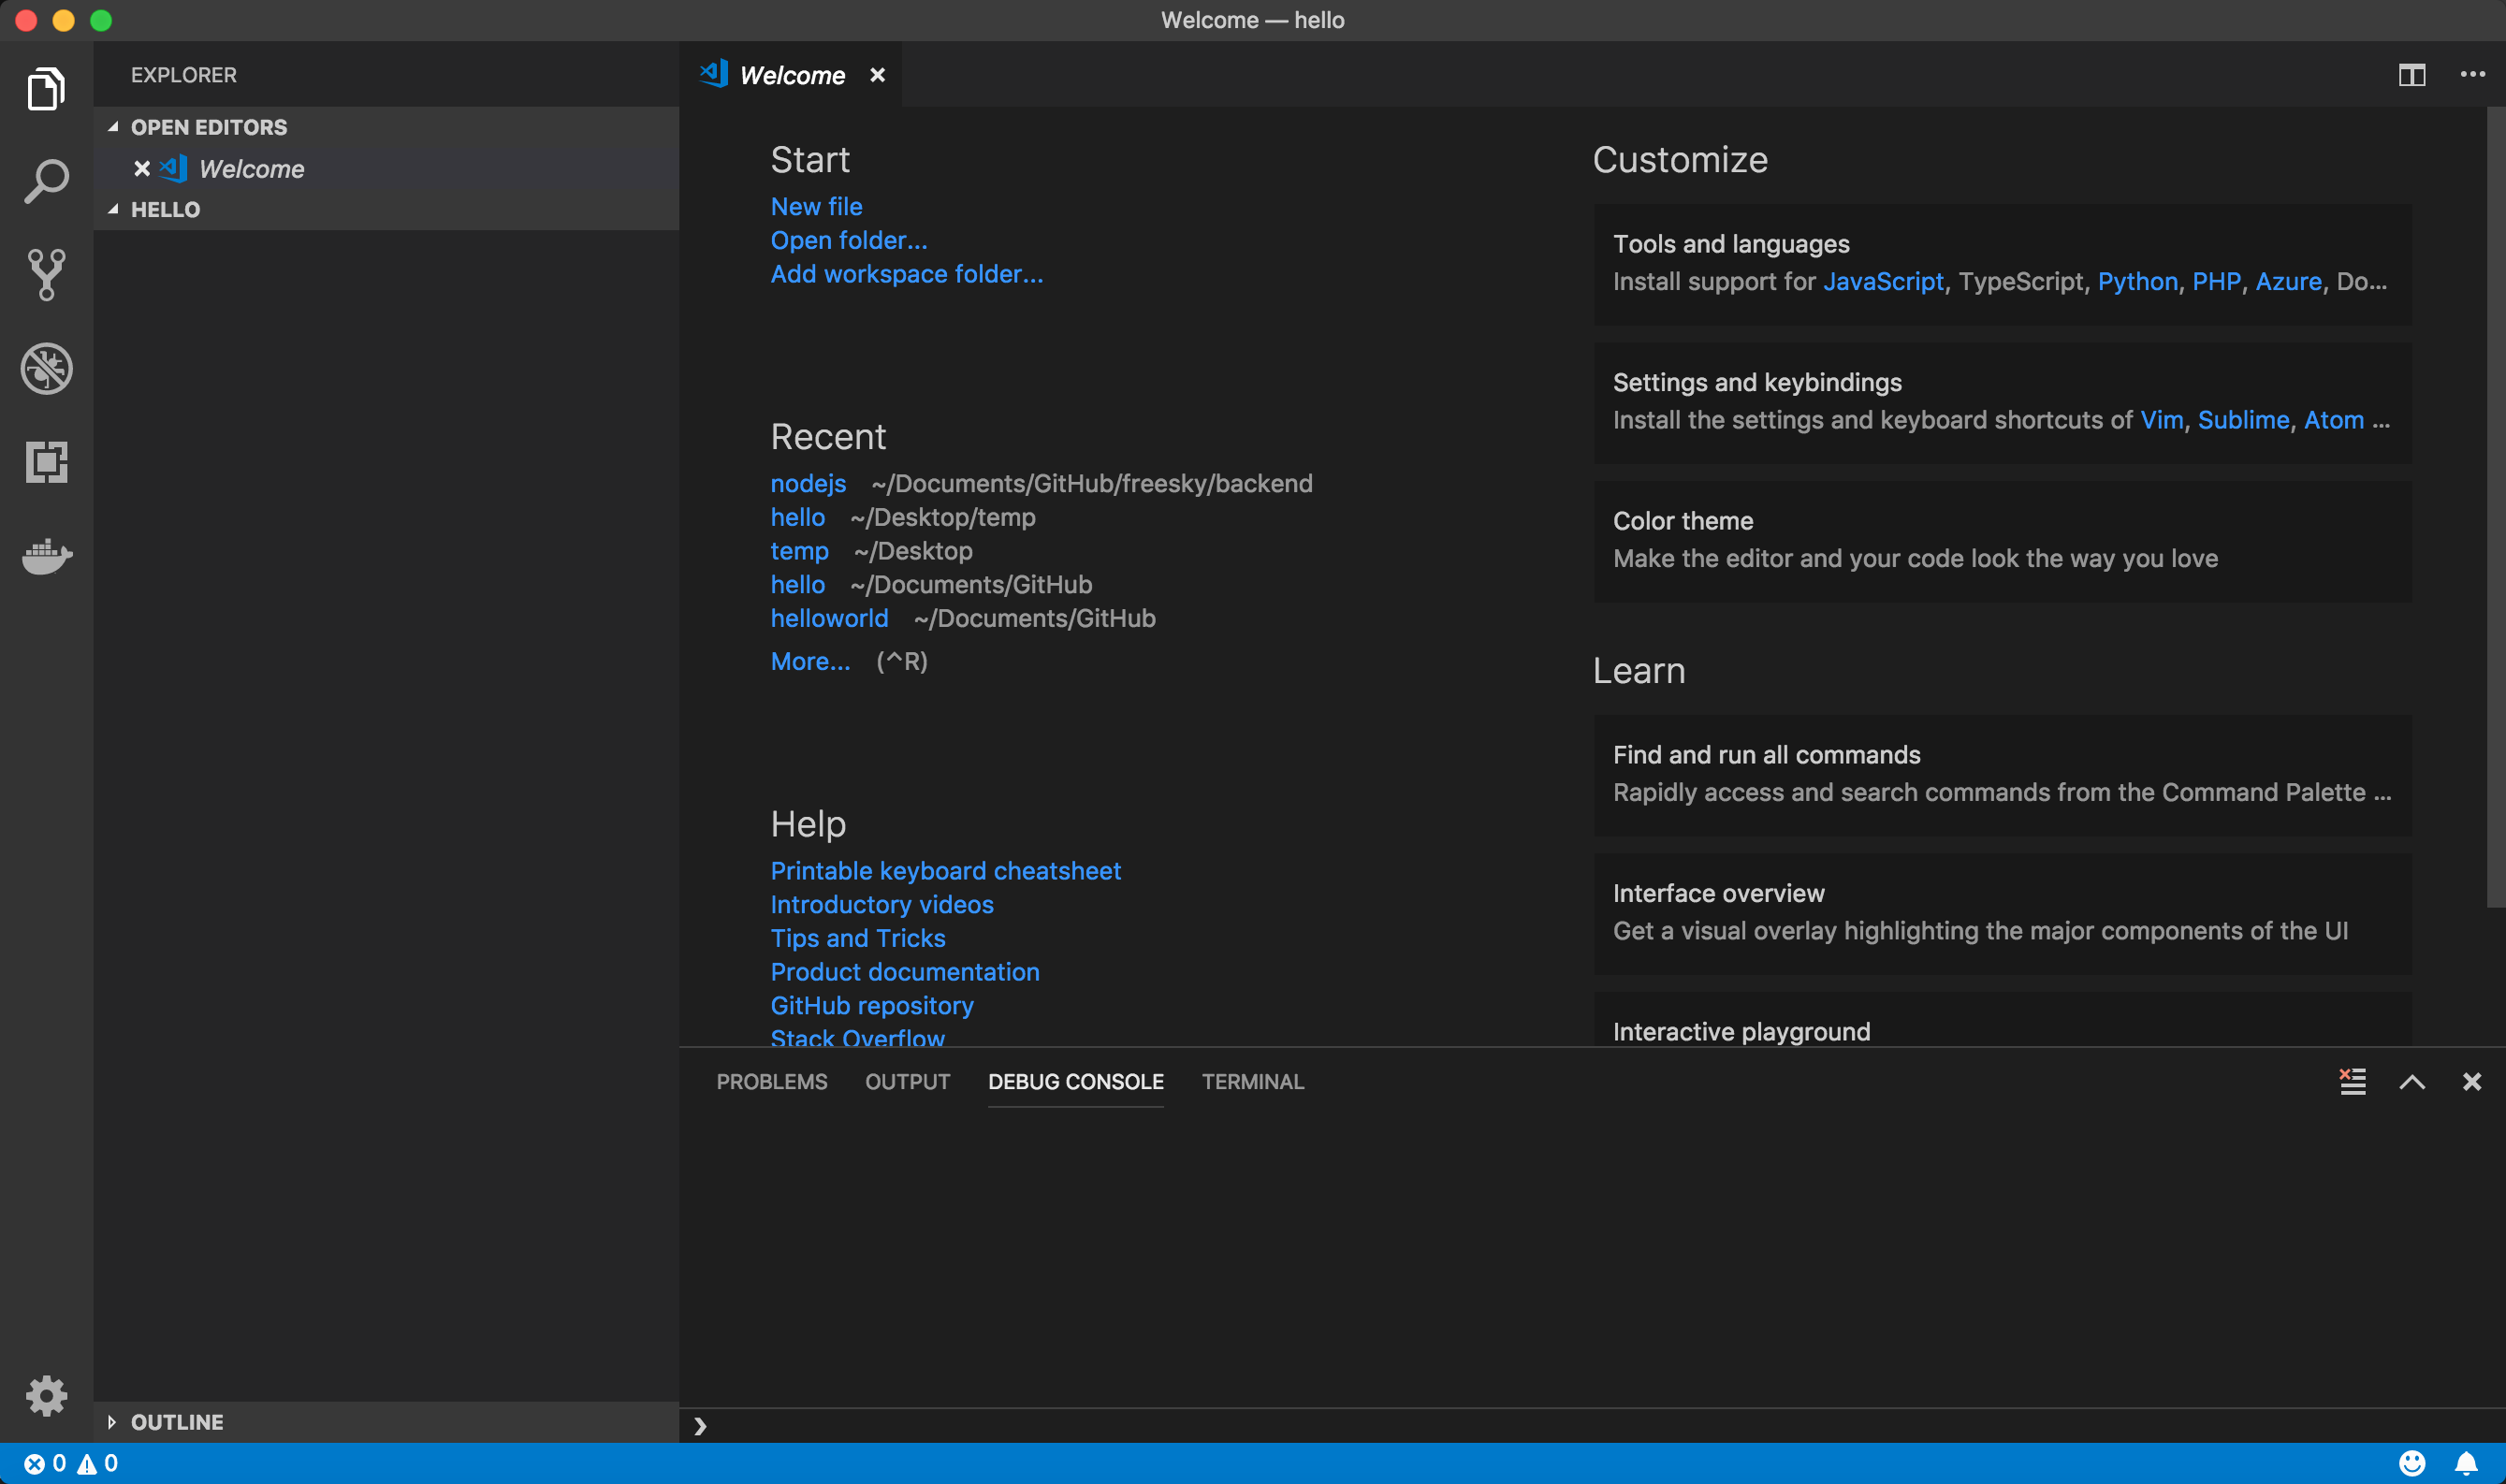 Successfully created hello folder
- Go to marketplace extension tab (Cmd+Shift+X), search C++, and install C/C++ extension from Microsoft.
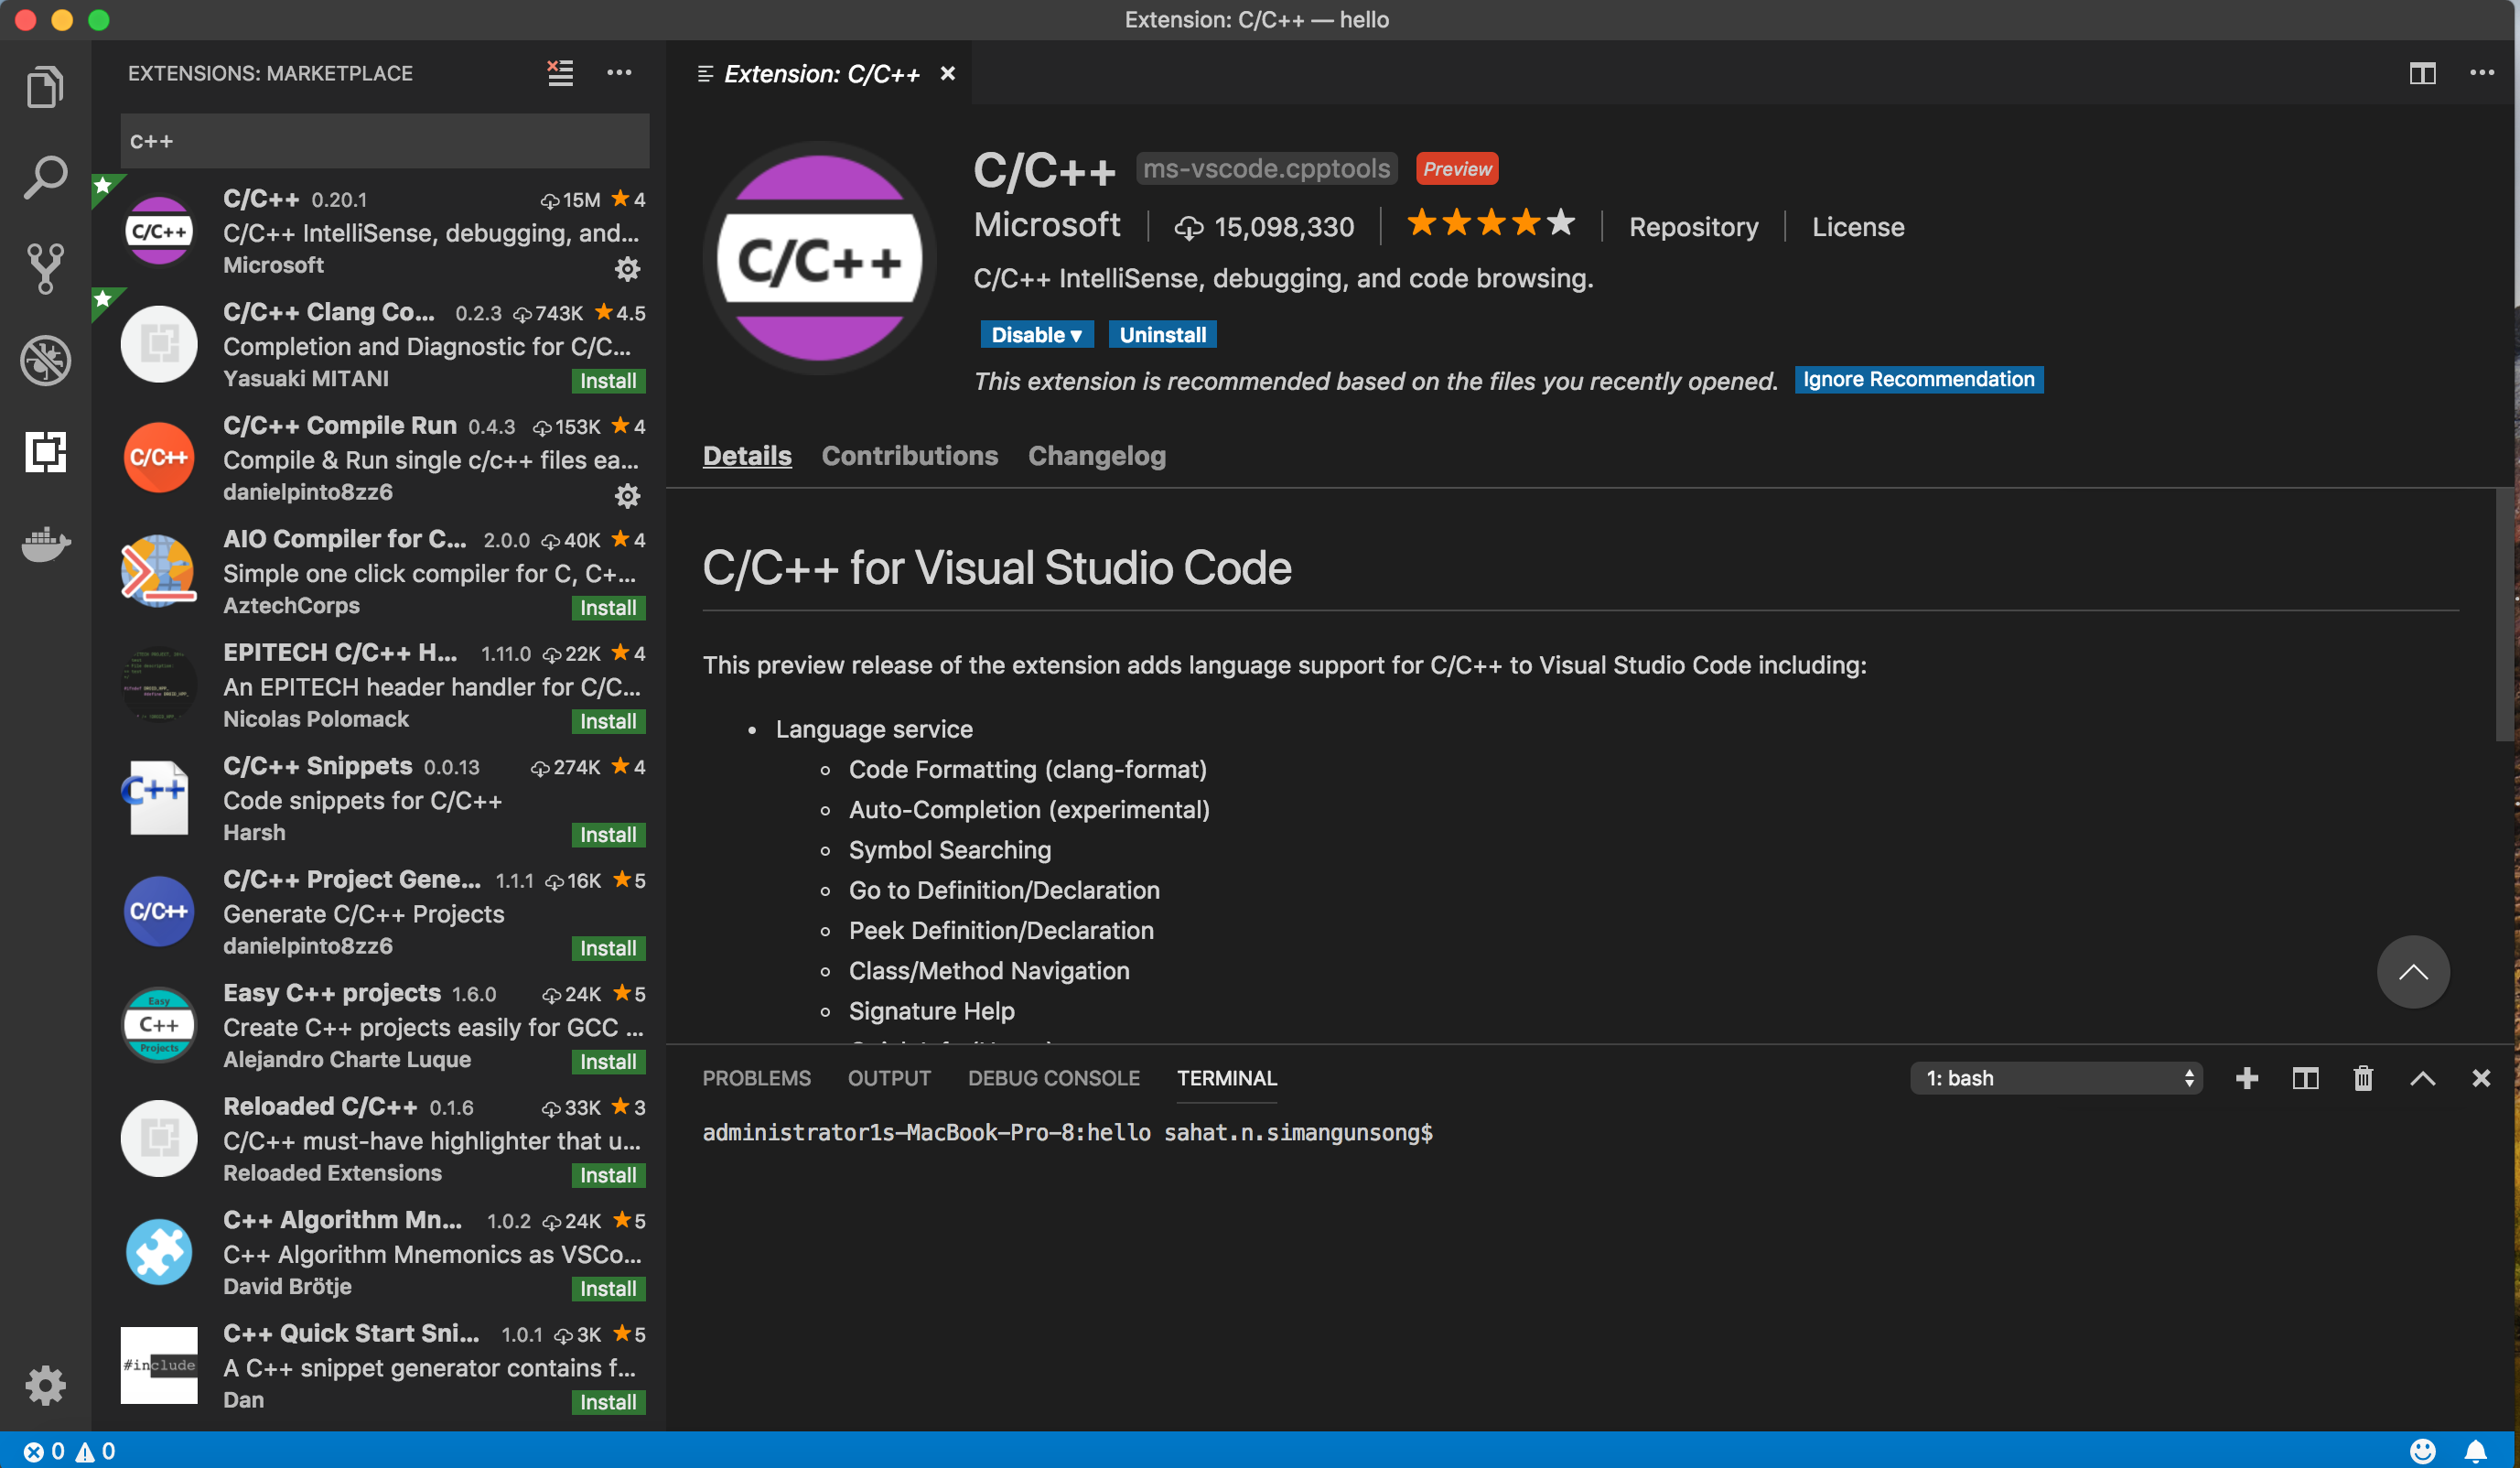 Add language support for C/C++ to VS Code.
- Create a new file (Cmd + N) named hello.cpp and save it under hello folder.
- Copy and paste the following code to hello.cpp.
/* hello.cpp */#include <iostream>using namespace std;int main(){ cout << “Please enter your name: “;string name; cin >> name; cout << “Hello, ” << name; cout << “n”;return 0;}
- Try to build hello.cpp by executing Run Build Task command (Cmd + Shift + B). Run Build Task is also accessible from Terminal Menu.
- Because build command has not been configured, VS Code will show dialogue like the following images.
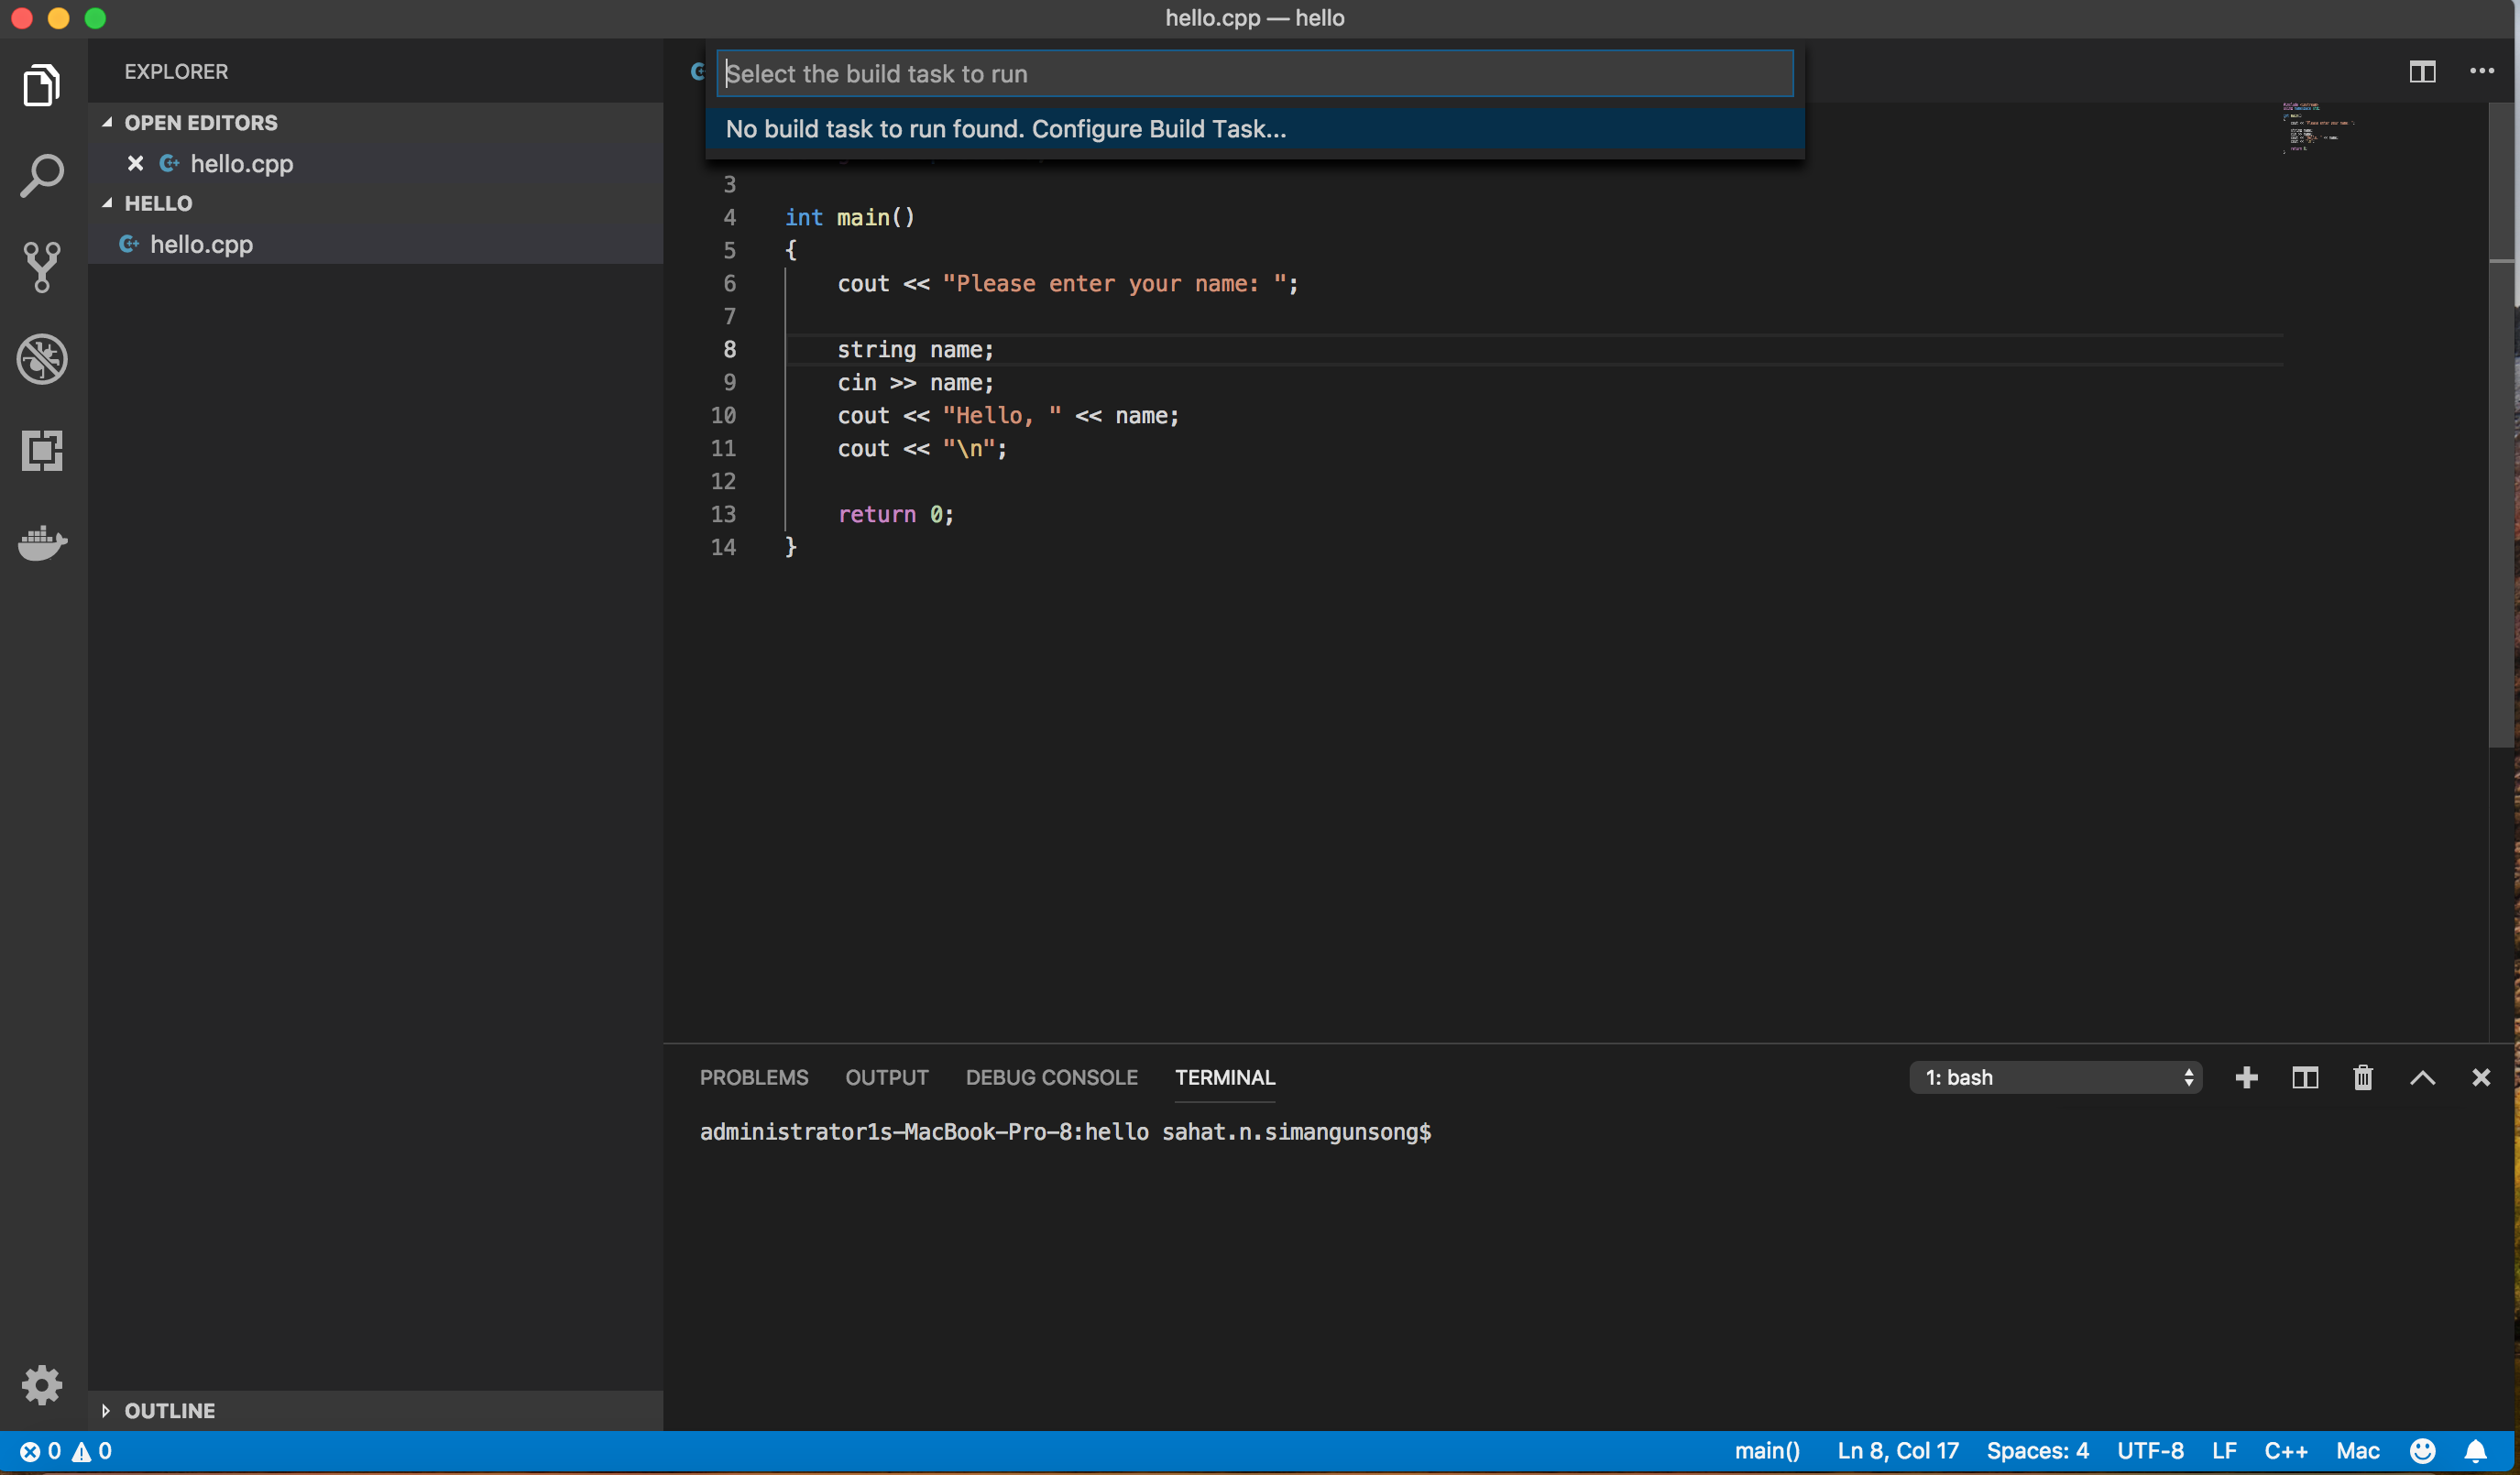 Build command doesn?t exist. Click the dialogue to continue.
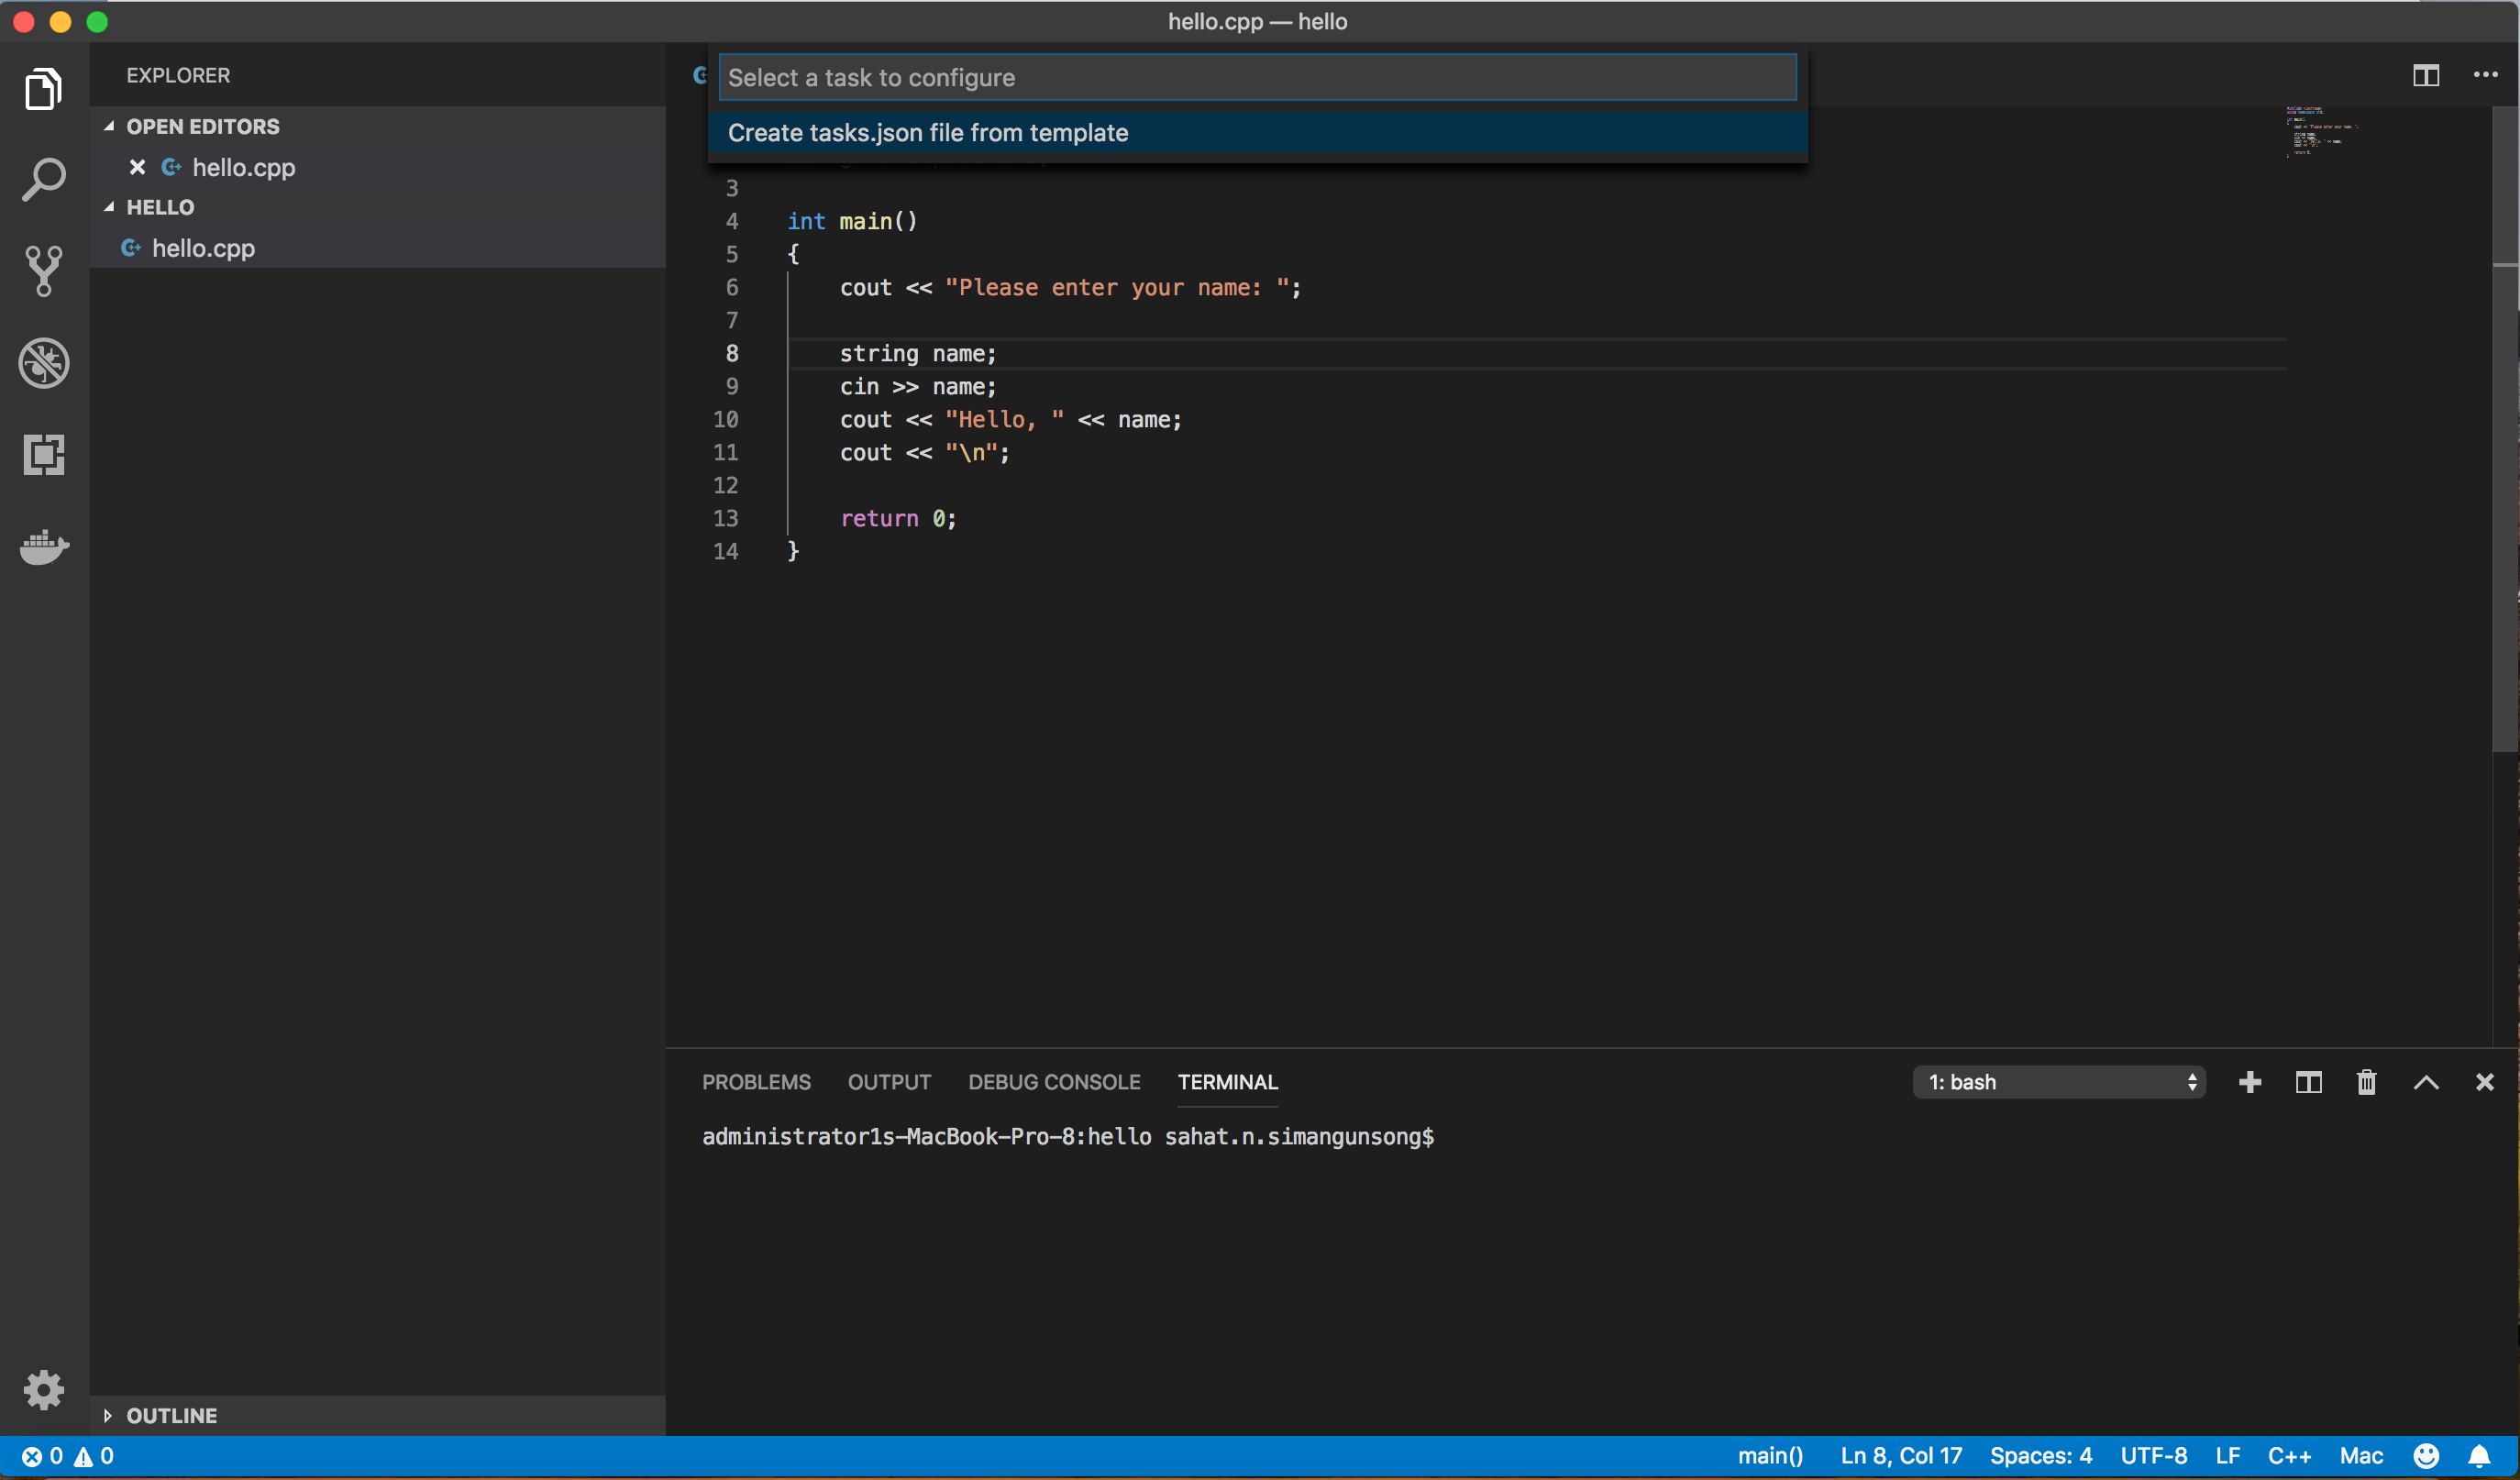 Create tasks.json.
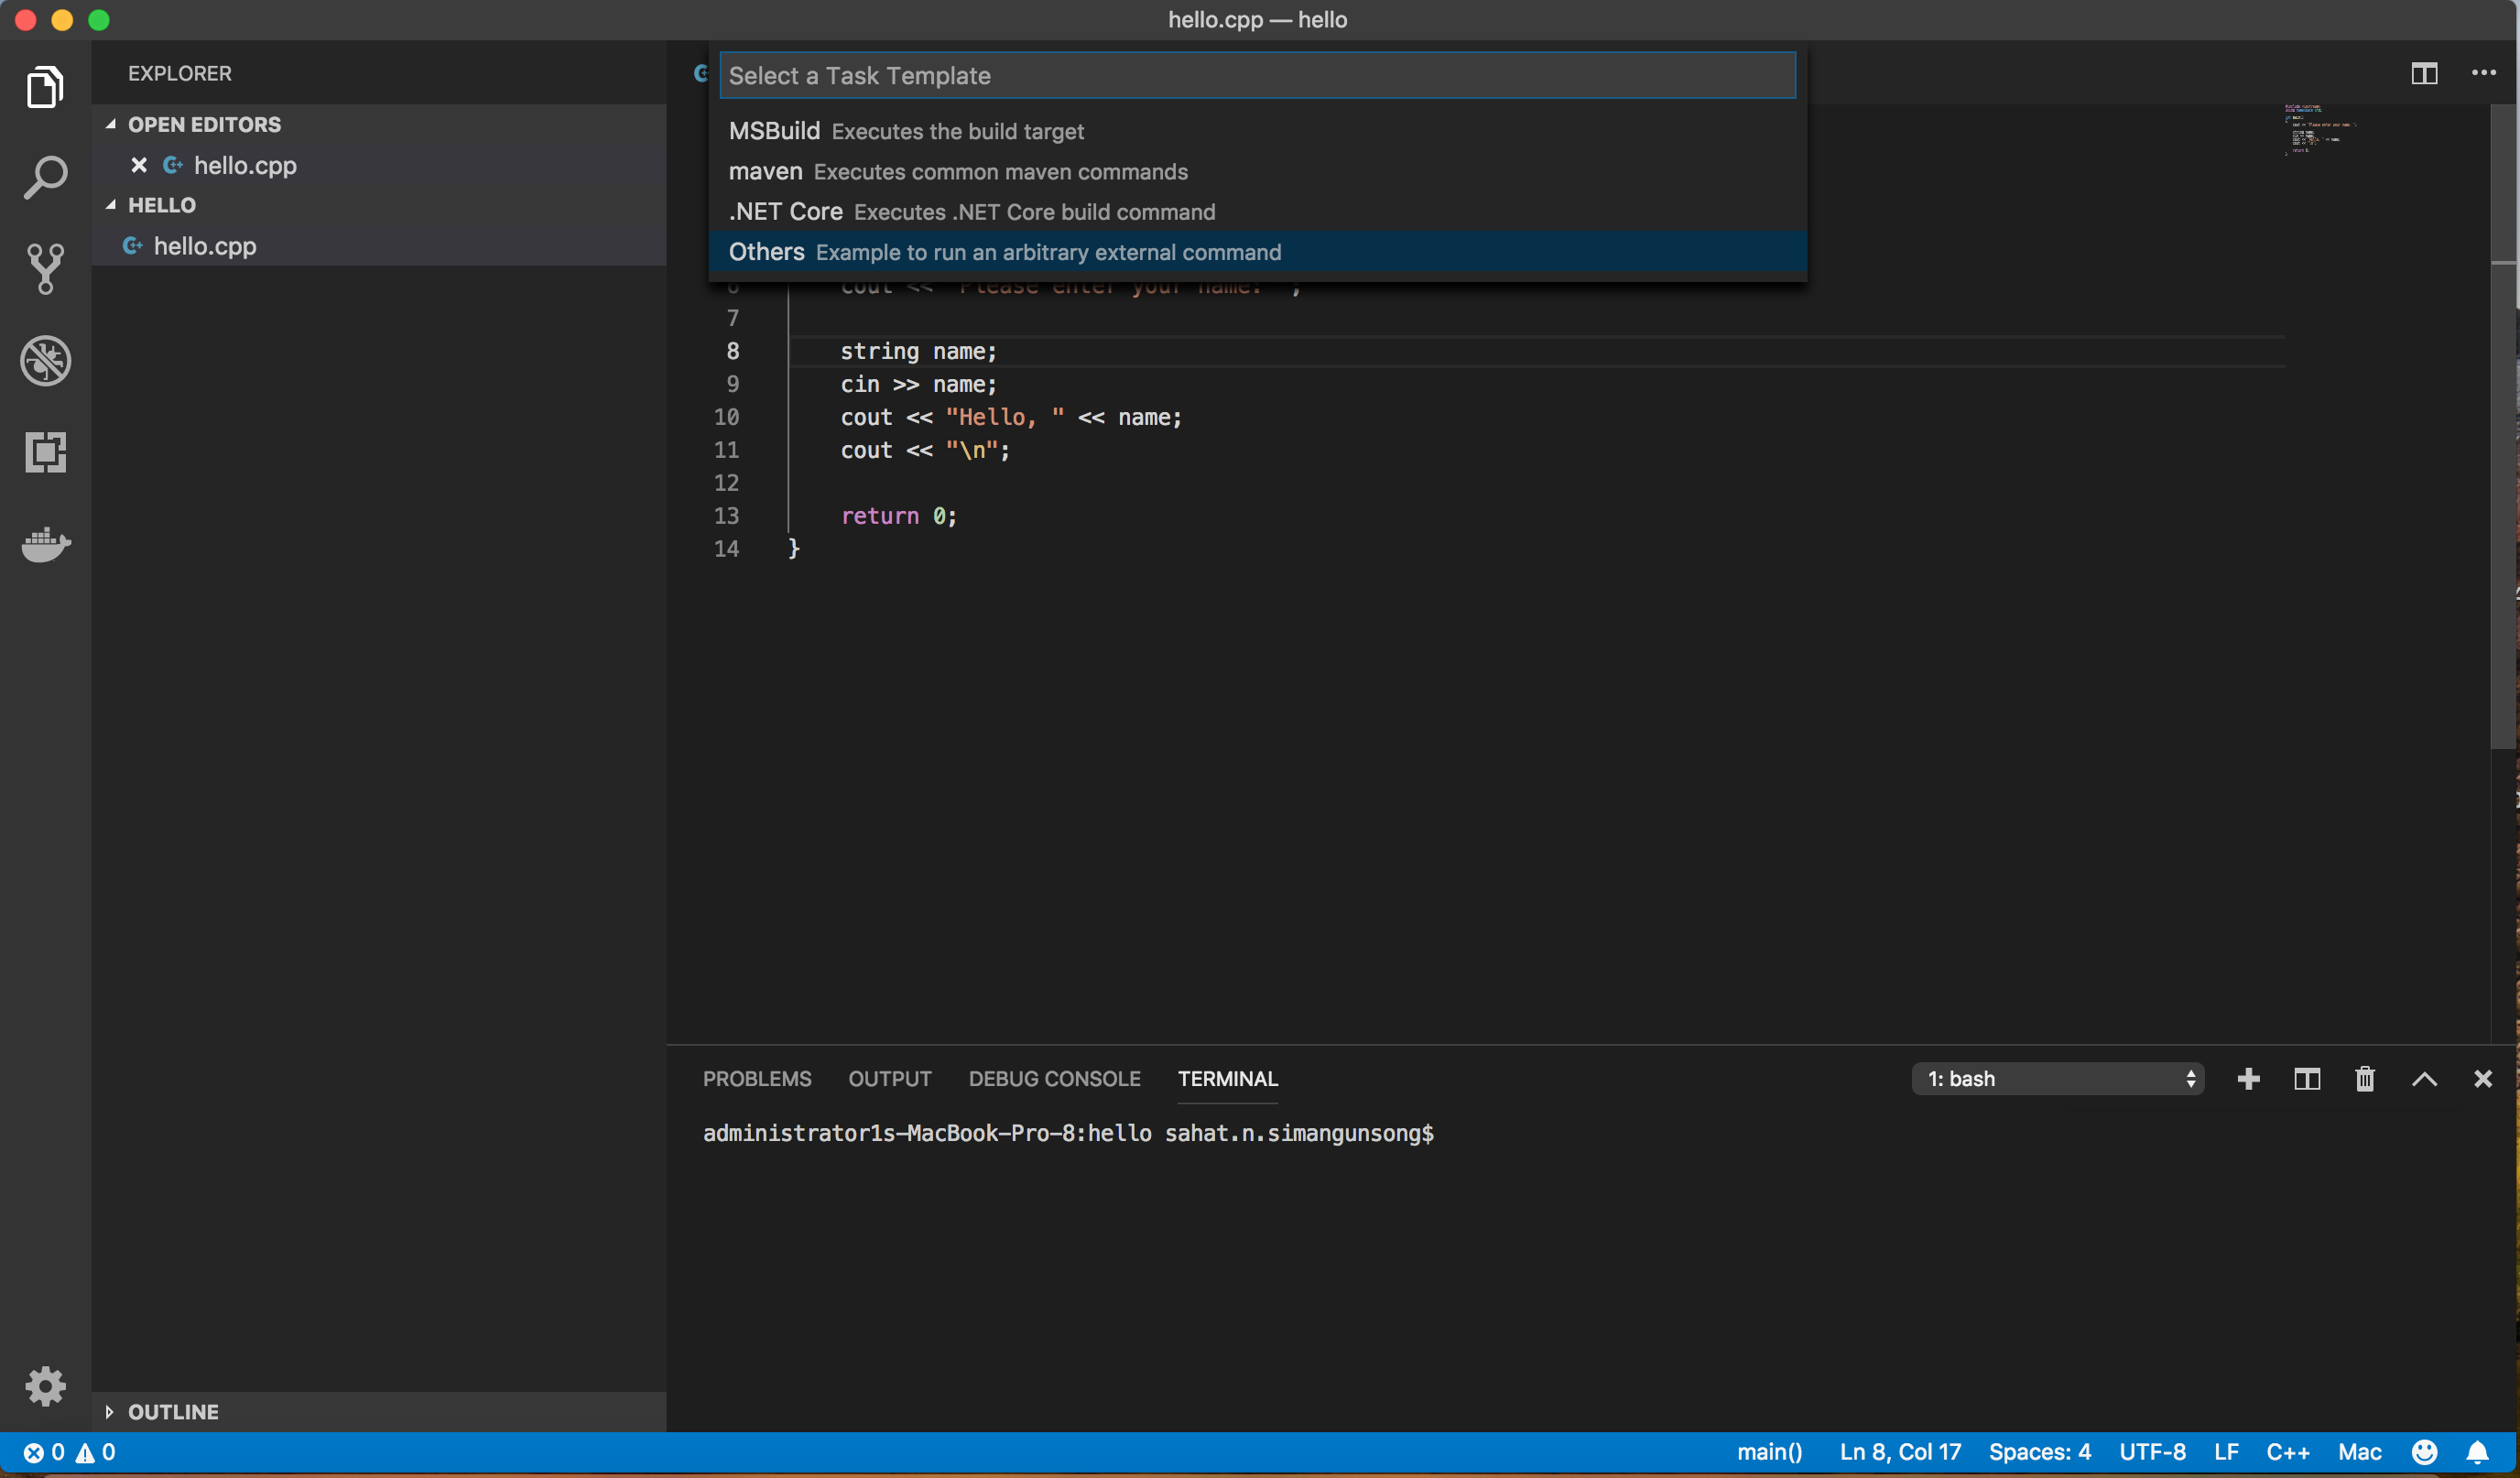 Choose Others. Any templates are also fine because it will be replaced later.
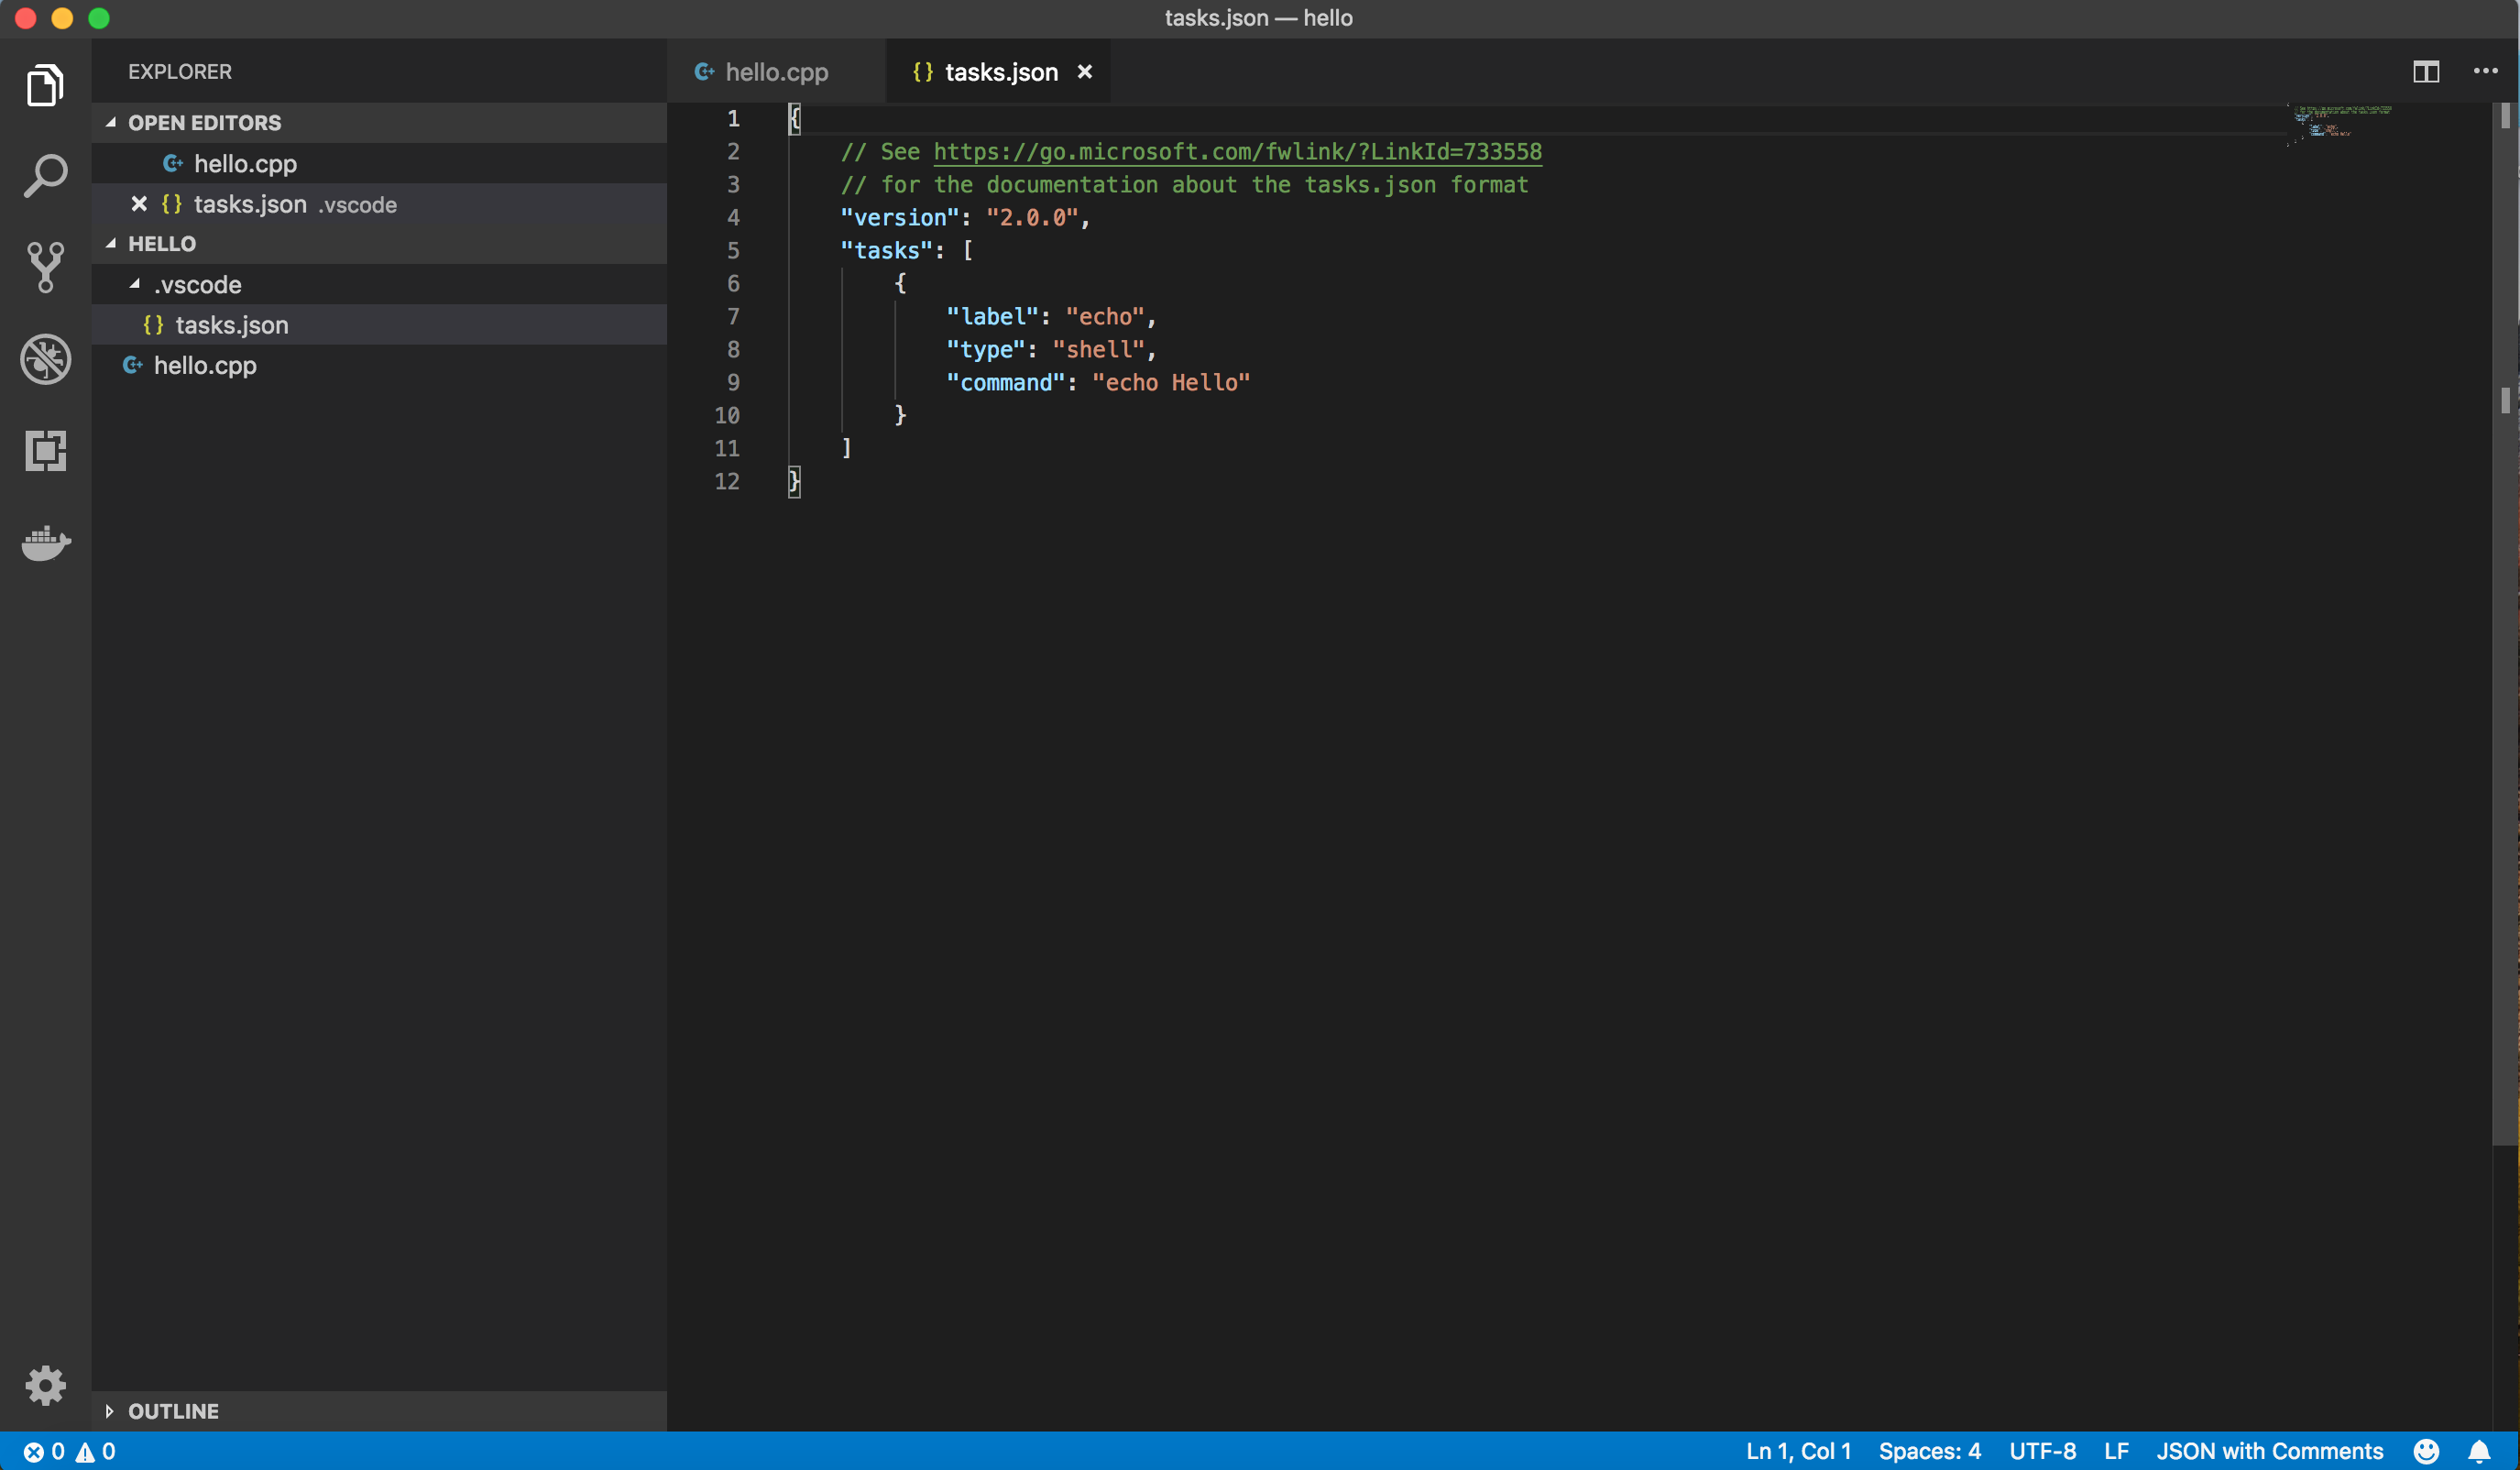 Default tasks.json.
- VS Code will automatically create a file named tasks.json, which is used to specify custom build commands and compiler switches, and arbitrary tasks. Copy and paste the following code to tasks.json.
/* tasks.json */{ “version”: “2.0.0”, “tasks”: [ { “label”: “build”, “command”: “clang++”, “args”: [ “-o”, “hello”, // executable “hello.cpp”, // main file “-g”, “-v” ], “type”: “shell”, “presentation”: { “echo”: true, “reveal”: “always”, “panel”: “shared” }, “problemMatcher”: { “owner”: “cpp”, “fileLocation”: [ “relative”, “${workspaceRoot}” ], “pattern”: { “regexp”: “^(.*):(\d+):(\d+):\s+(warning|error):\s+(.*)$”, “file”: 1, “line”: 2, “column”: 3, “severity”: 4, “message”: 5 } } } ]}
- Execute Run Build Task command (Cmd + Shift + B) once again. If successful, it will create a new executable file named hello.
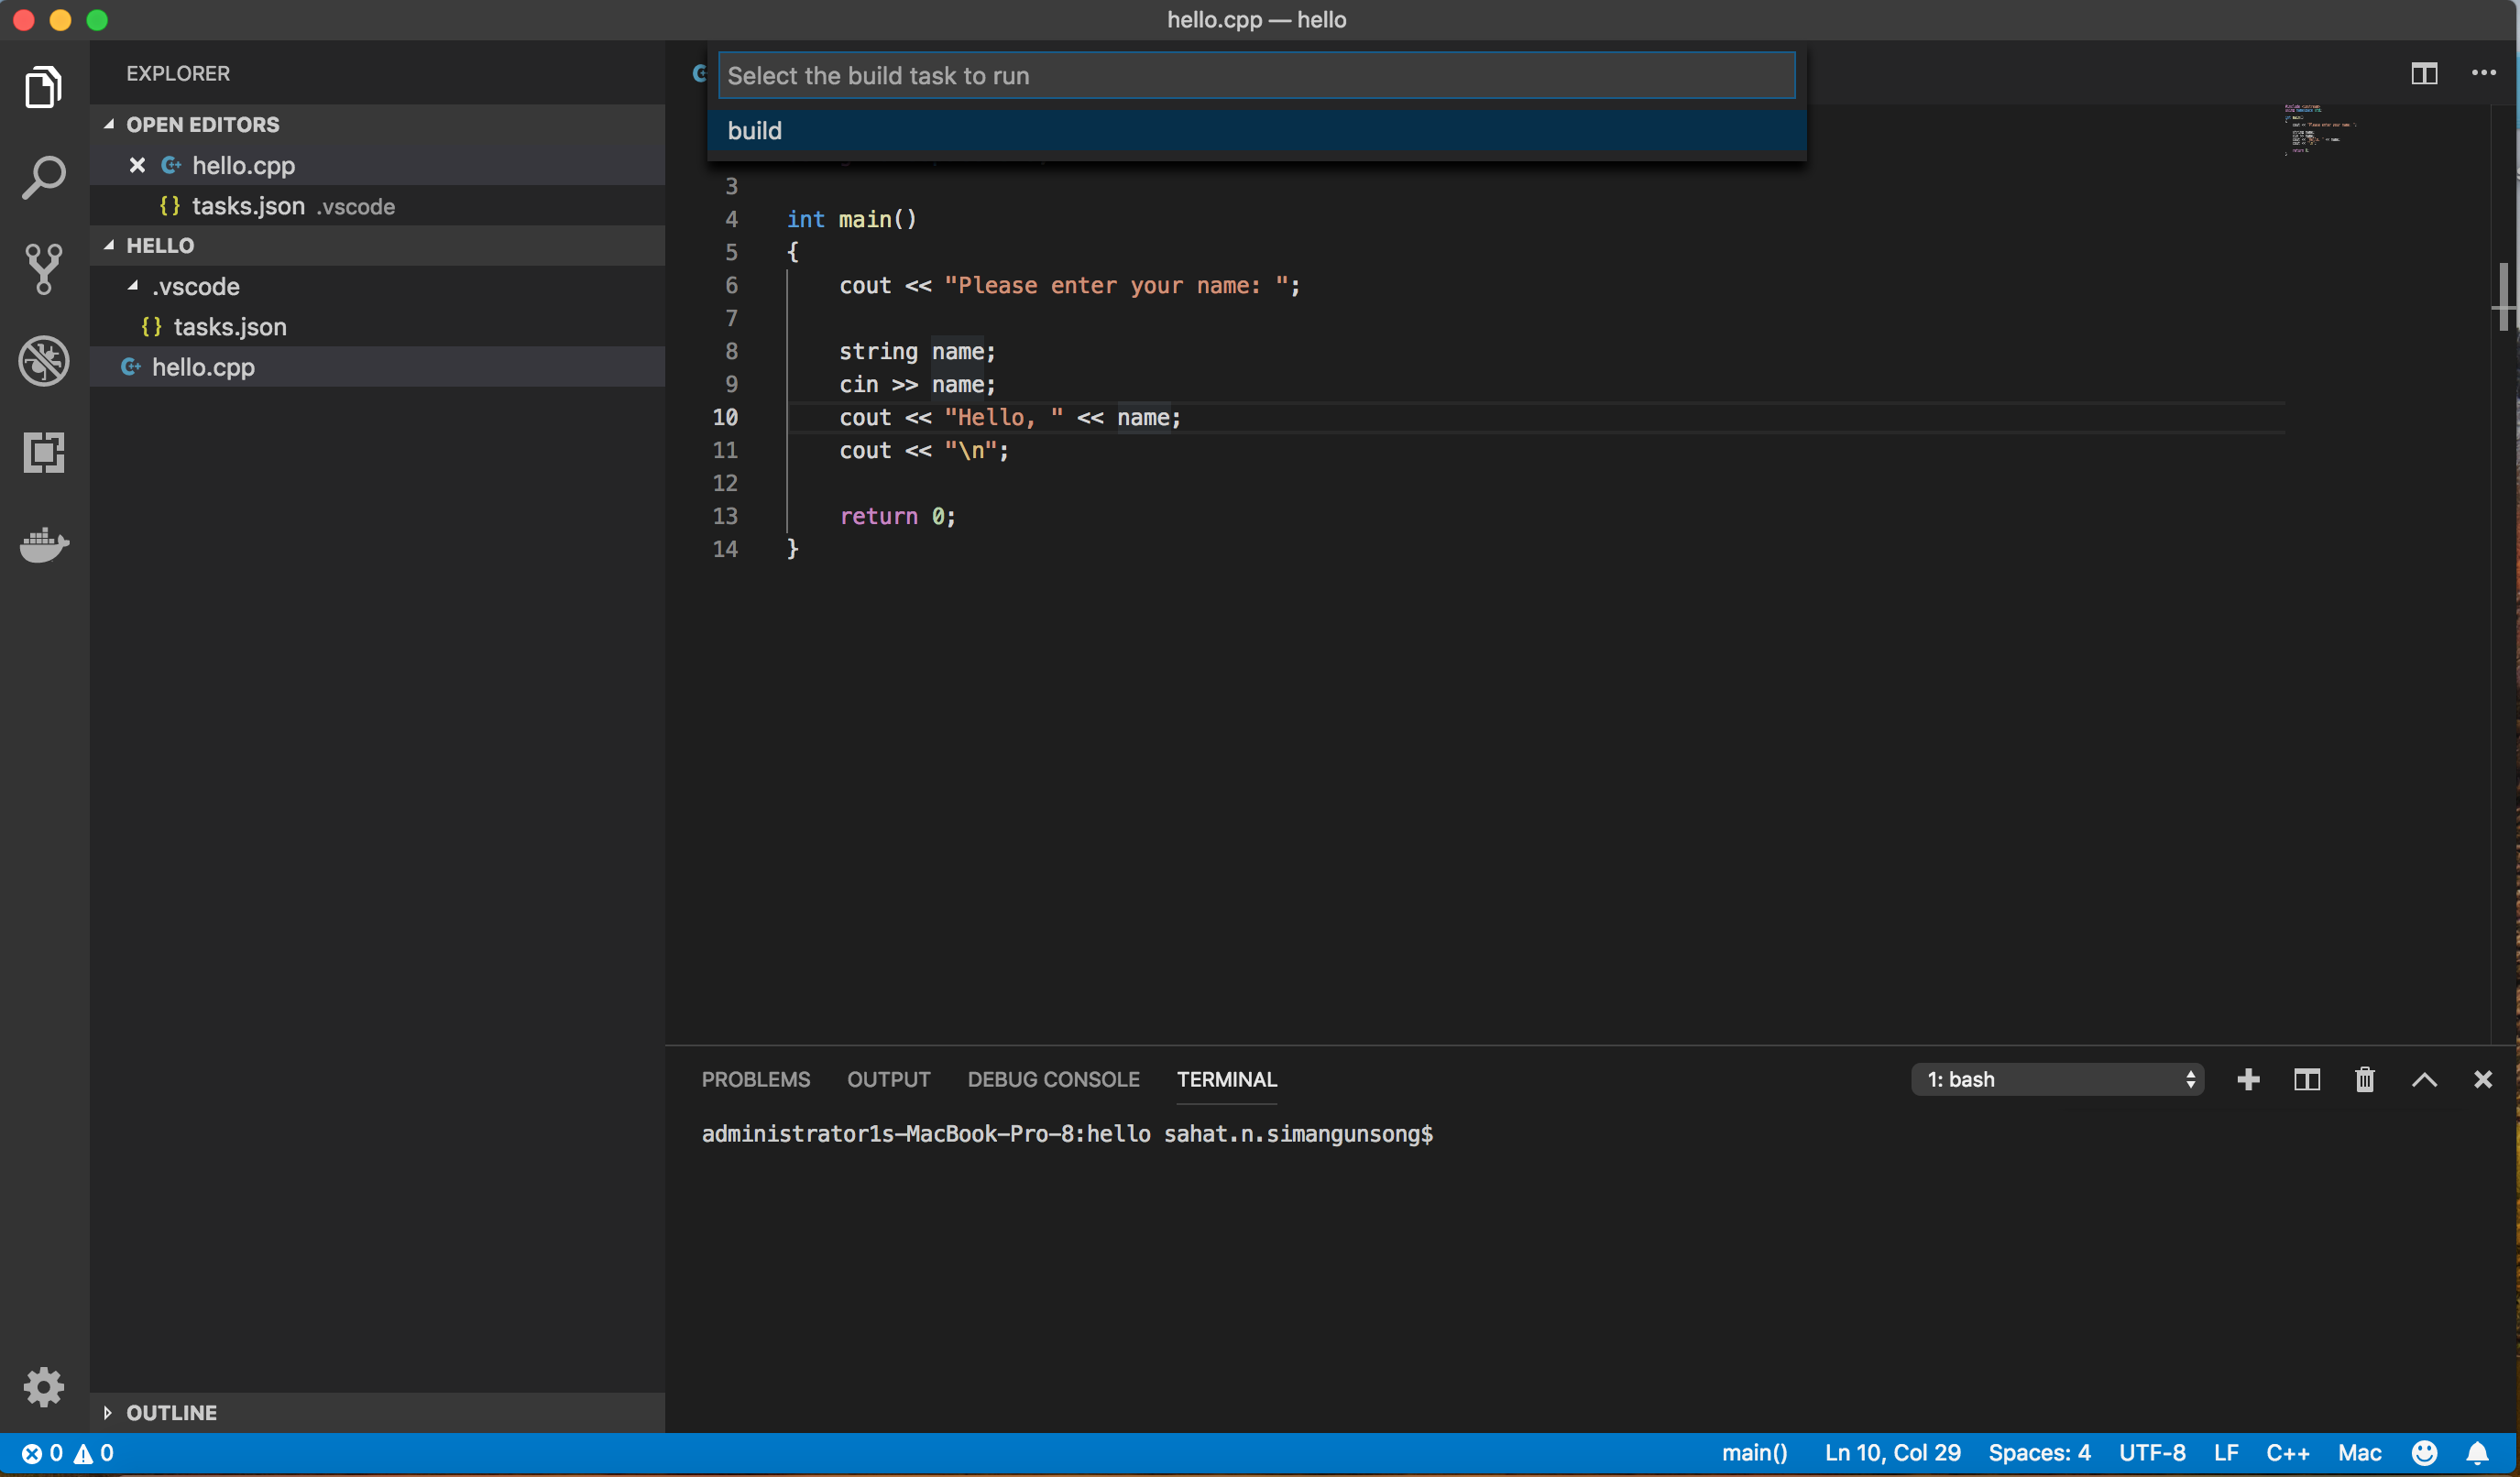 Build a C++ program.
- Now run the hello program by typing ./hello in the terminal.
Steps to debug C++:
- Go to the debug tab (Cmd+Shift+D).
- Debug command has not been configured. Click the gear icon to create launch.json, which is used to specify command-line arguments for debugging. Refer to following images for guidance.
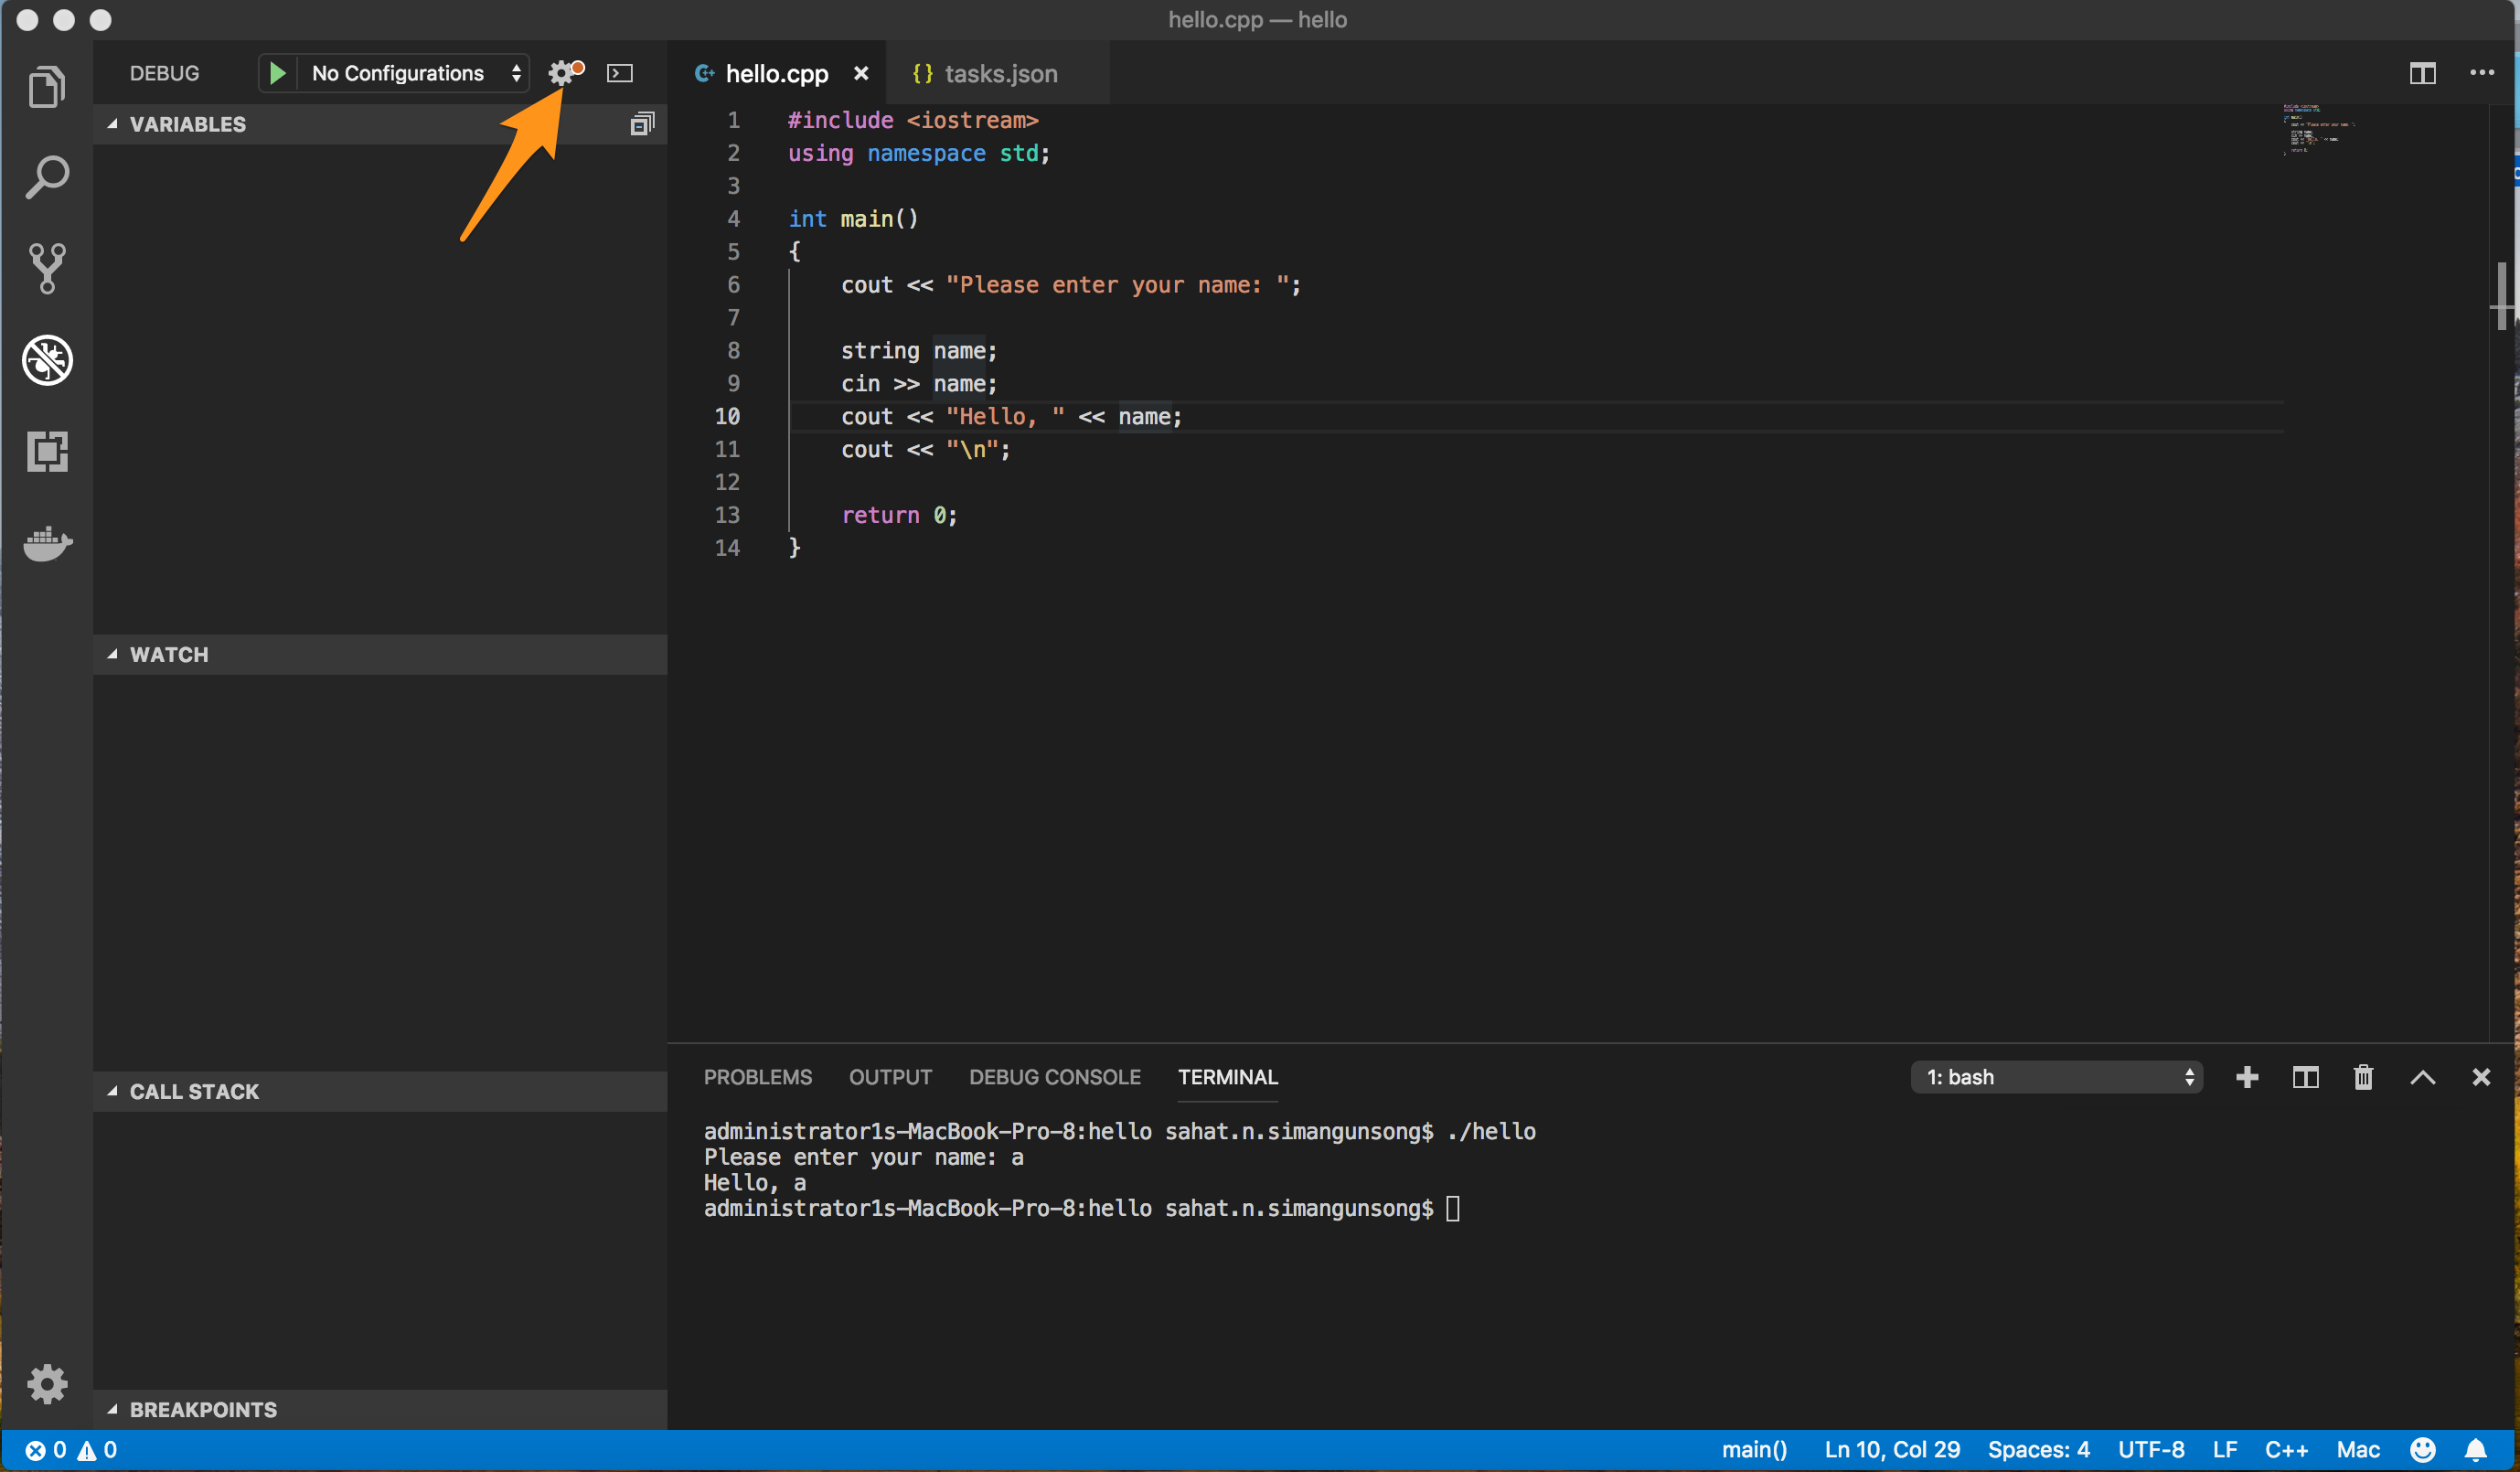 Click the gear icon to create launch.json.
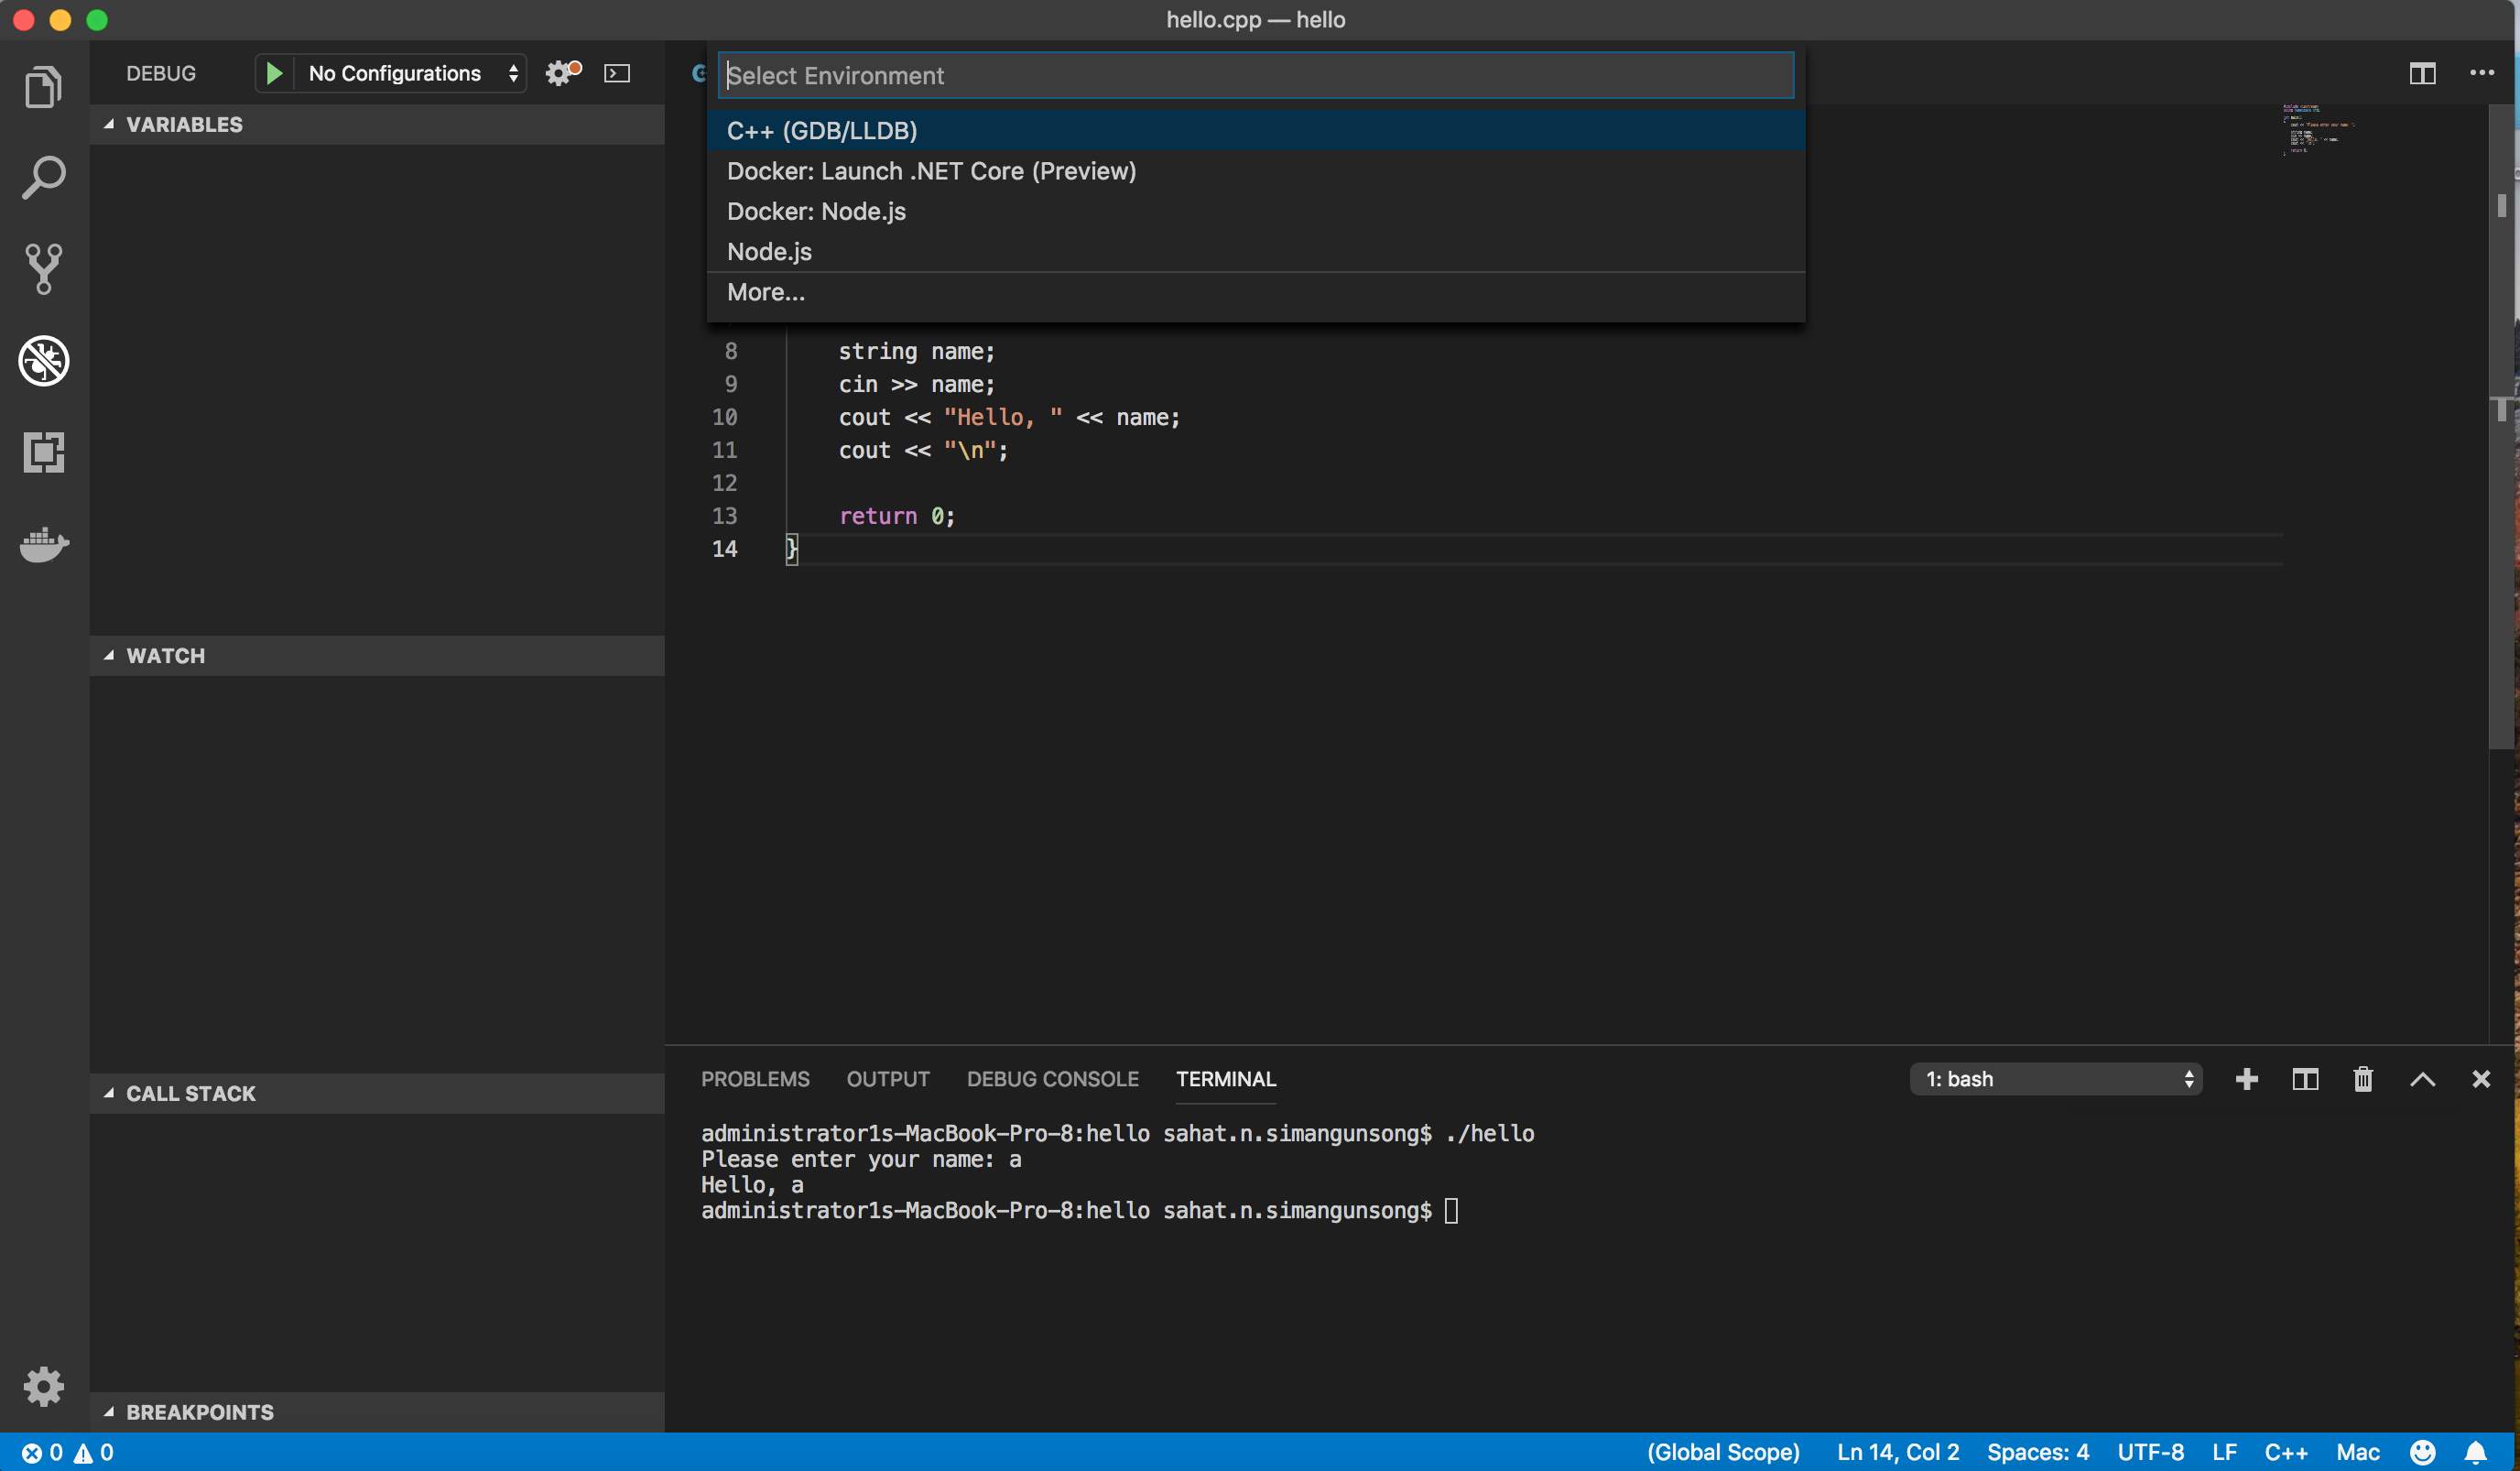 Choose C++ (GDB/LLDB).
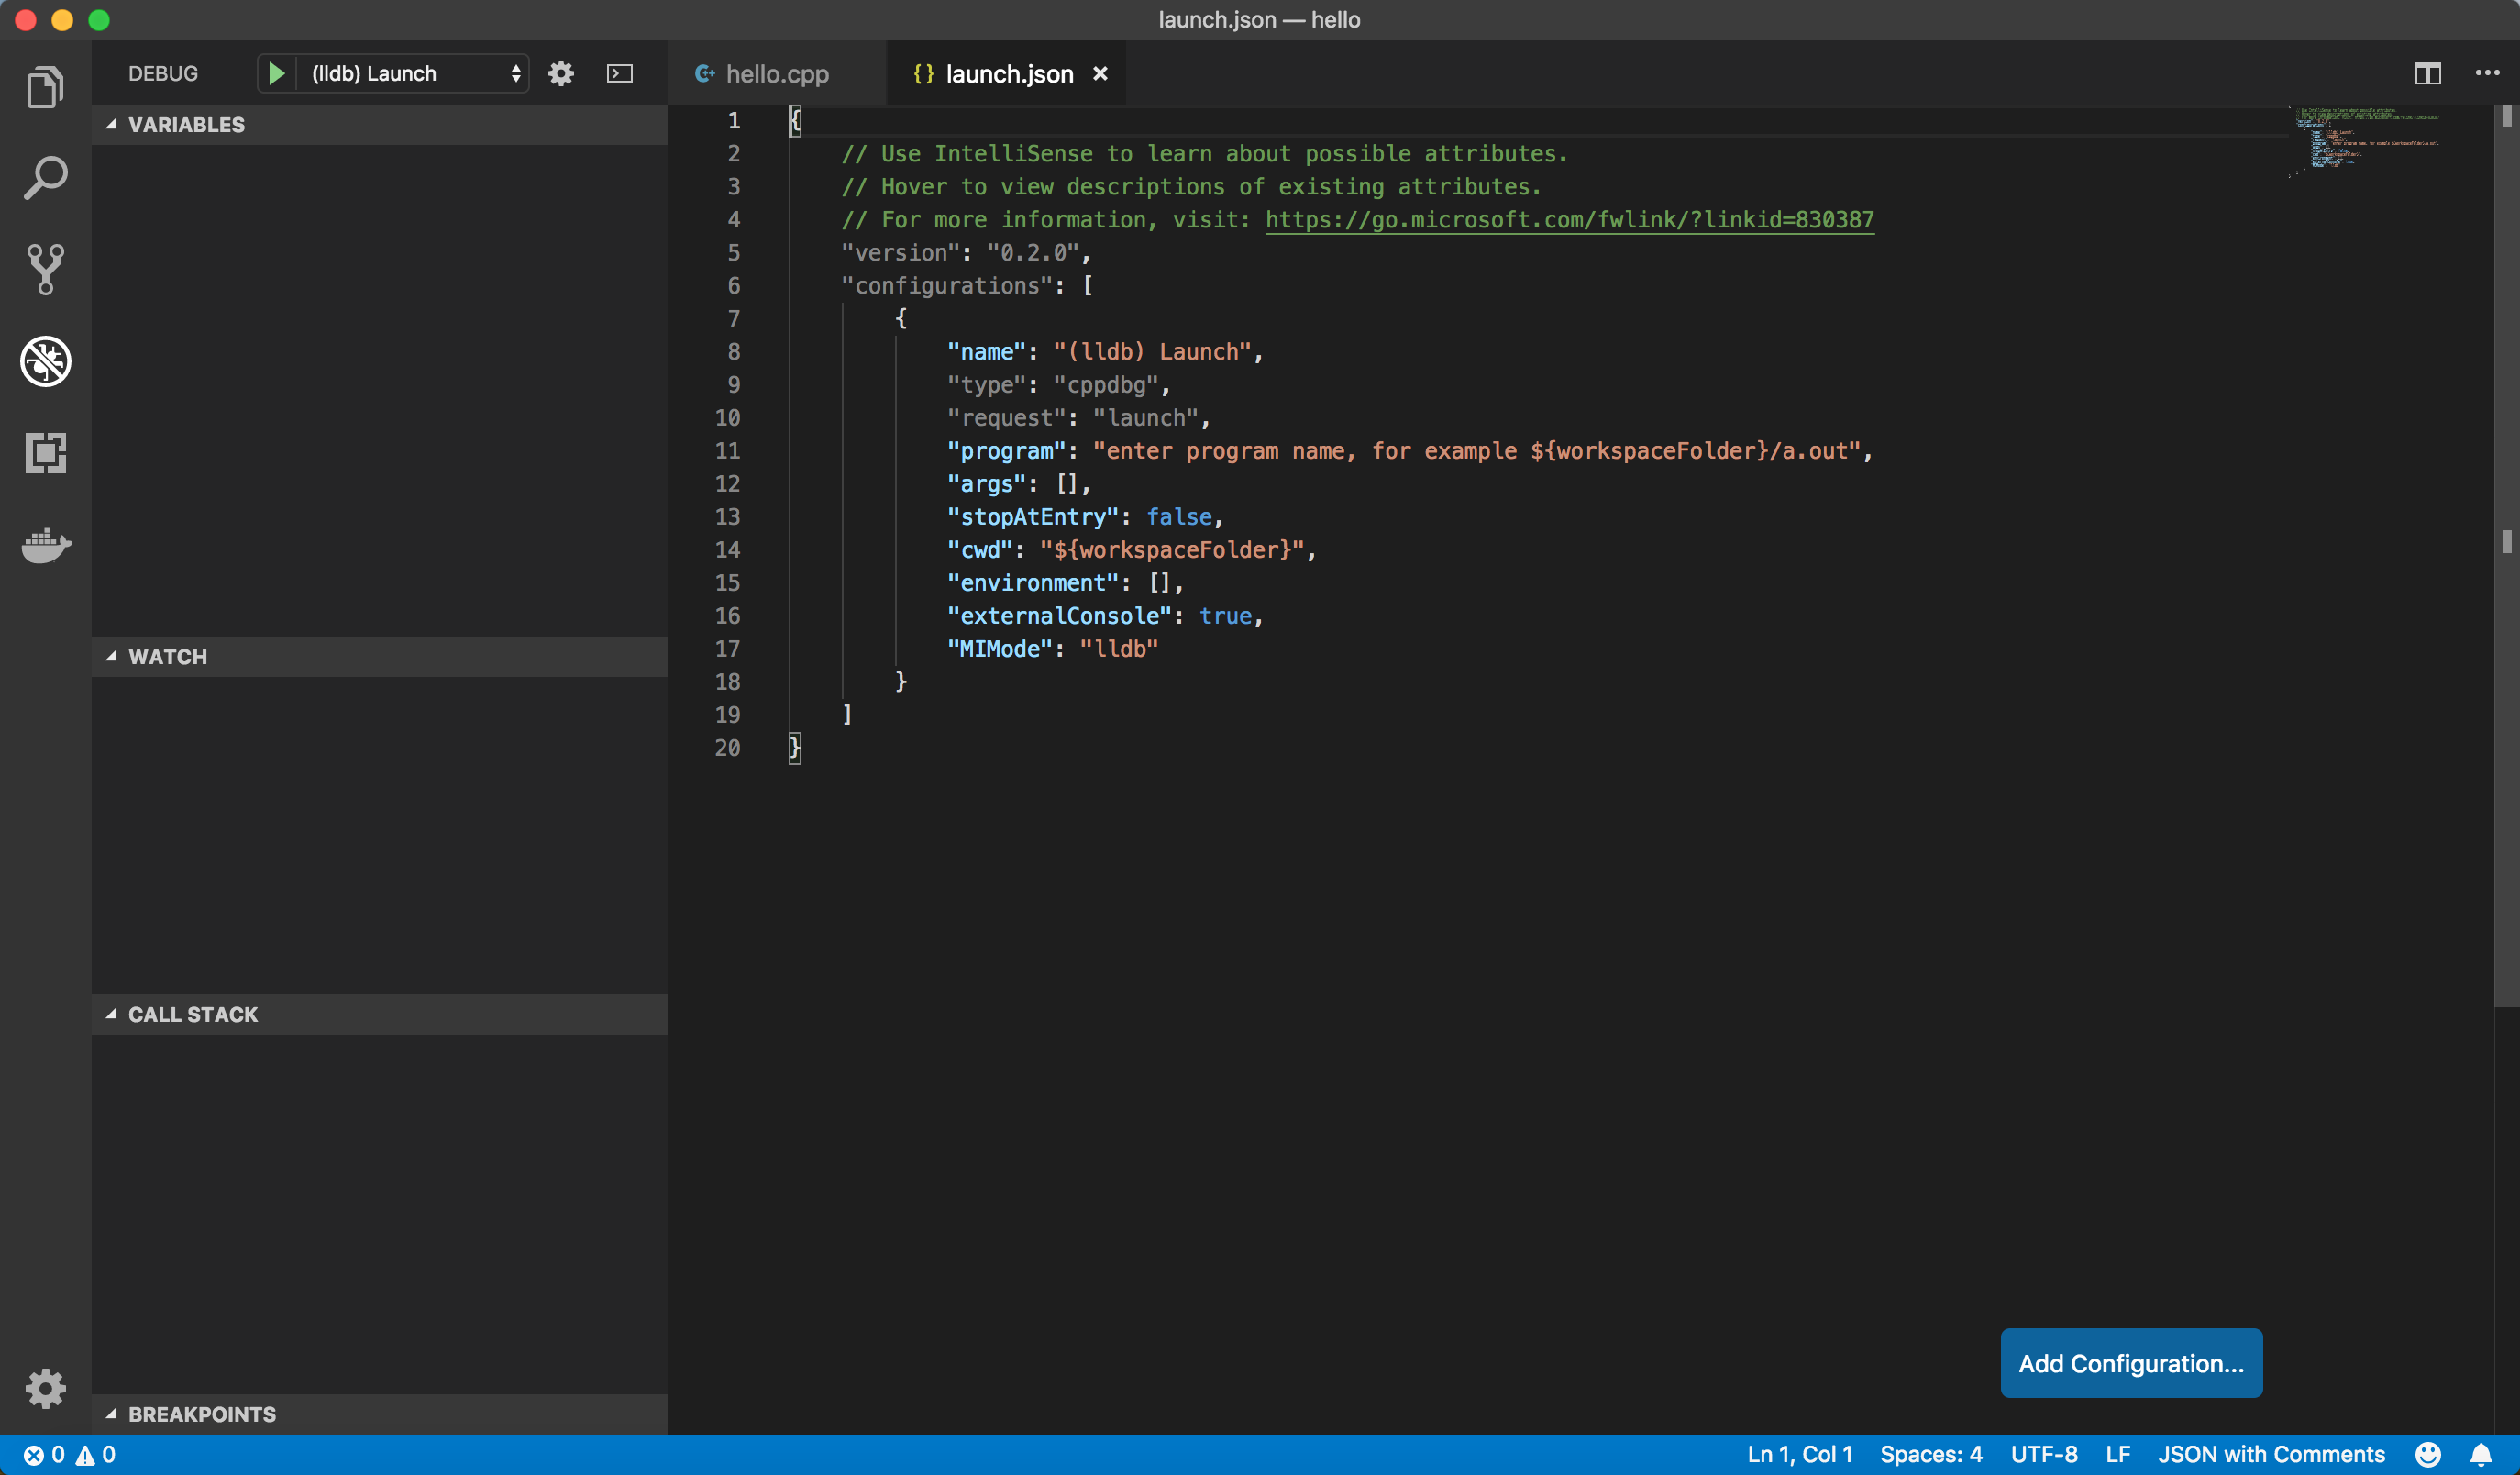 Default launch.json.
- Copy and paste the following code to launch.json.
/* launch.json */{ “version”: “2.0.0”, “configurations”: [ { “name”: “C++ Launch”, “type”: “cppdbg”, “request”: “launch”, “program”: “${workspaceRoot}/hello”, “preLaunchTask”: “build”, “internalConsoleOptions”: “openOnSessionStart”, “logging”: { “moduleLoad”: false, “programOutput”: true, “trace”: false }, “showDisplayString”: false, “args”: , “stopAtEntry”: false, “cwd”: “${workspaceRoot}”, “environment”: , “externalConsole”: true, // set true to enable keyboard input “osx”: { “MIMode”: “lldb” } } ]}
- A breakpoint can be placed by clicking on the left side of the line numbers.
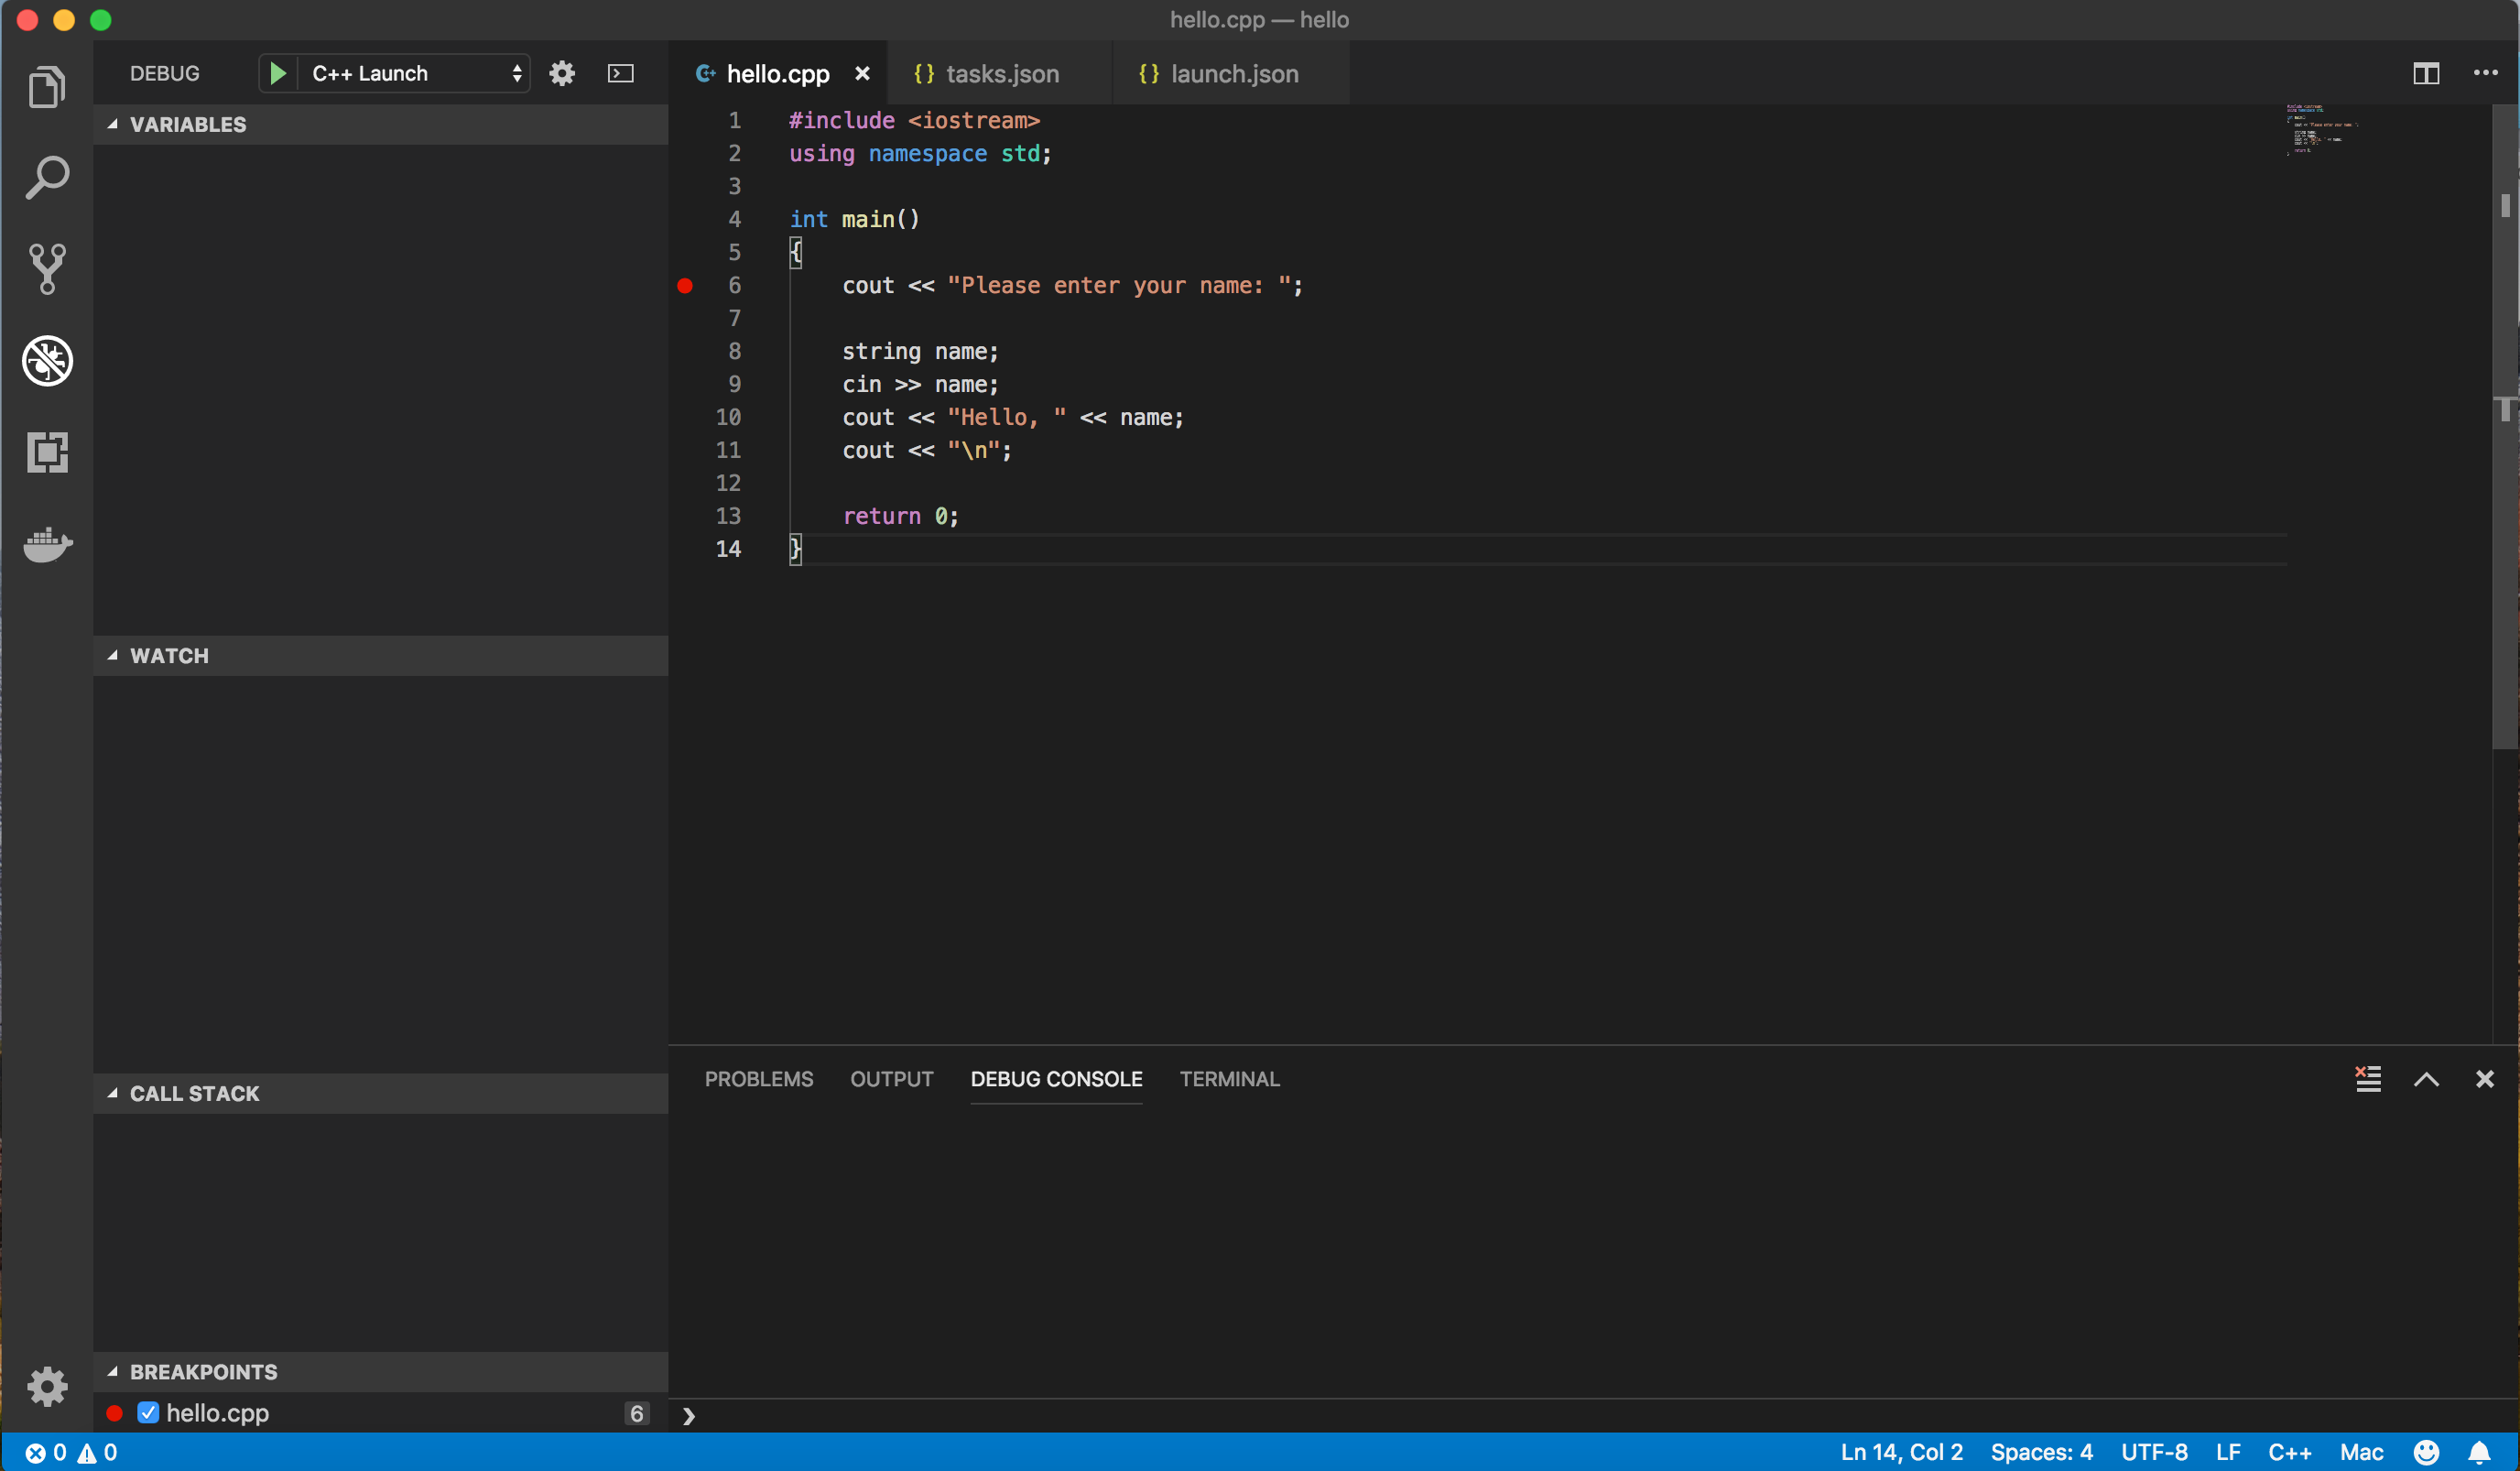 Breakpoint is represented by the red dot.
- Start to debug by clicking on the green play button.
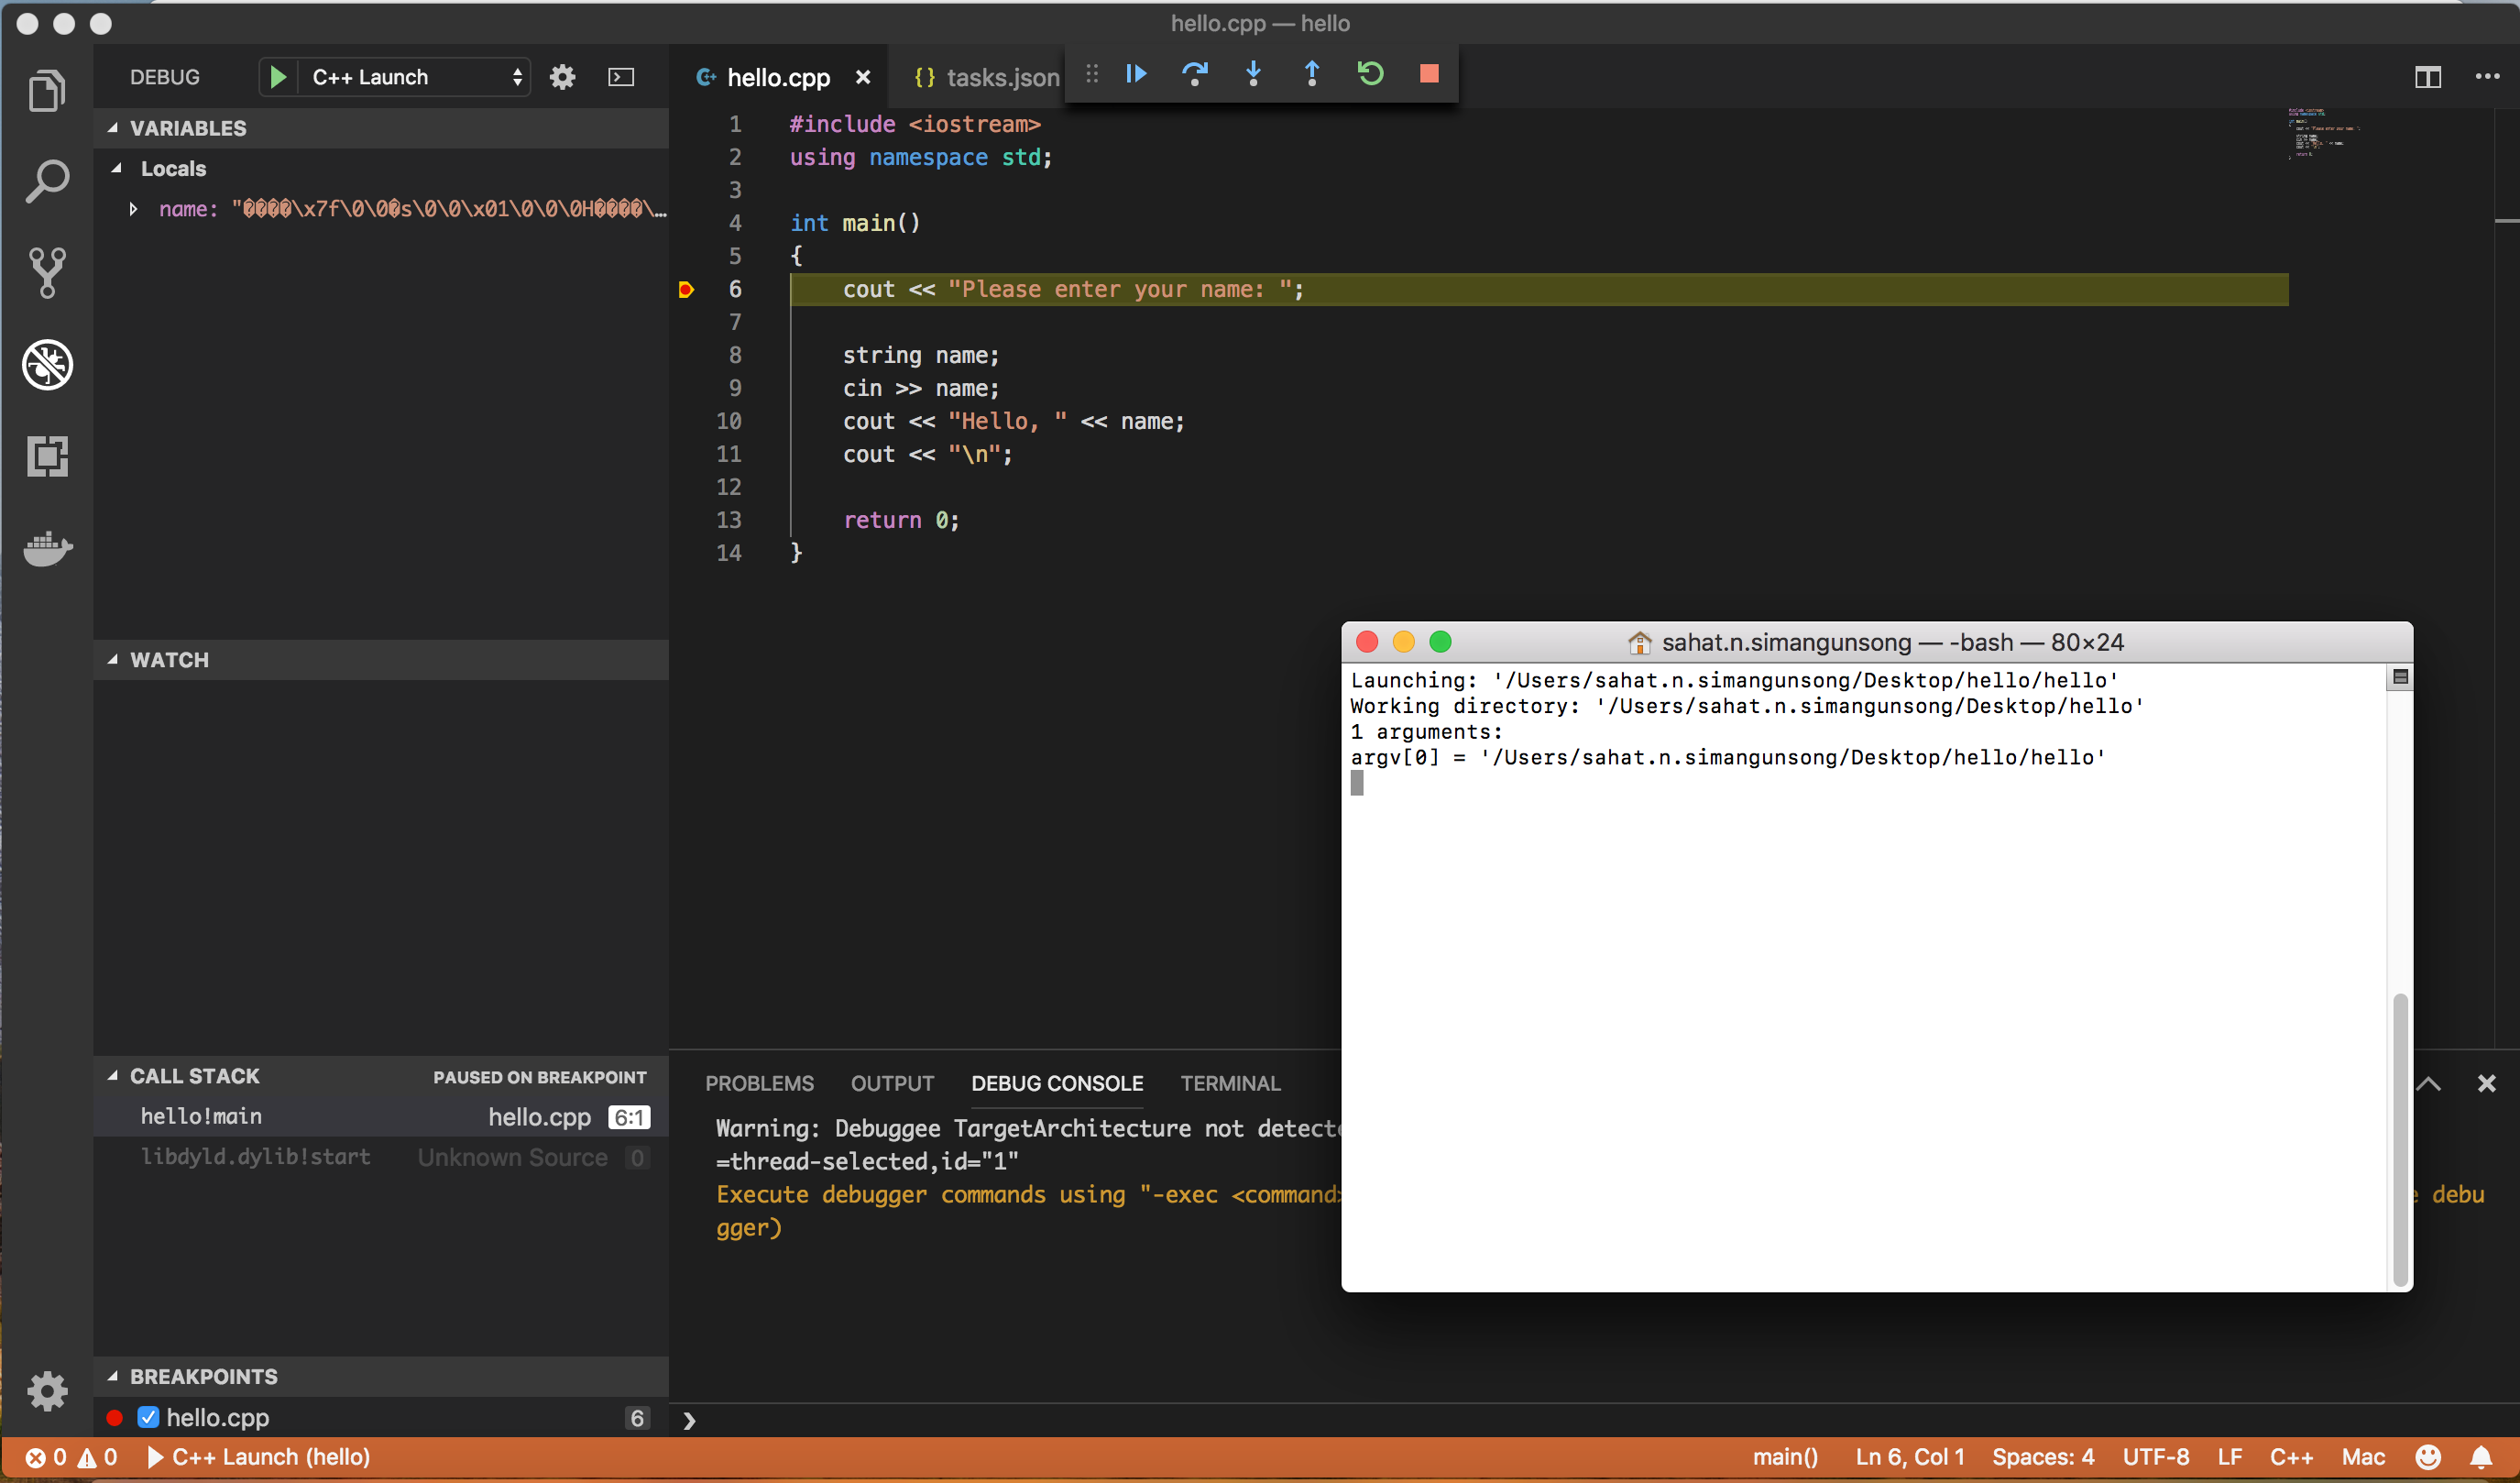 Debug mode.
That?s it!
We hope this guide can help you get started. If you find this article helpful, don?t hesitate to give it a clap ?. Also, feedback and suggestions are welcome!
Resources
- C/C++ for Visual Studio Code
- Tasks in Visual Studio Code
- How do I set up Visual Studio Code to compile C++ code?
HIRING 1,000 GREAT SOFTWARE ENGINEERS!
We are in the process of scaling up our team to 1,000 great software engineers in five major cities: Bali, Bandung, Jakarta, Surabaya and Yogyakarta in Indonesia. There is a global shortage of great software engineers. Therefore, we are going to where the talent is. This is part of the answers to a question posted on Quora: What are some of GDP Venture?s strategies to attract talent?
If the above working environment appeals to you, apply now to https://career.catapa.com/GDPLabs.

